CONNECT TRANSIT SHORT-RANGE TRANSIT PLAN - PREPARED BY: FOR: MCLEAN COUNTY REGIONAL PLANNING ...
←
→
Page content transcription
If your browser does not render page correctly, please read the page content below
3–5 YEARS
   CONNECT
   TRANSIT
   Short-Range Transit Plan

                   BLOOMINGTON-NORMAL   |   2019

			Prepared By:				For: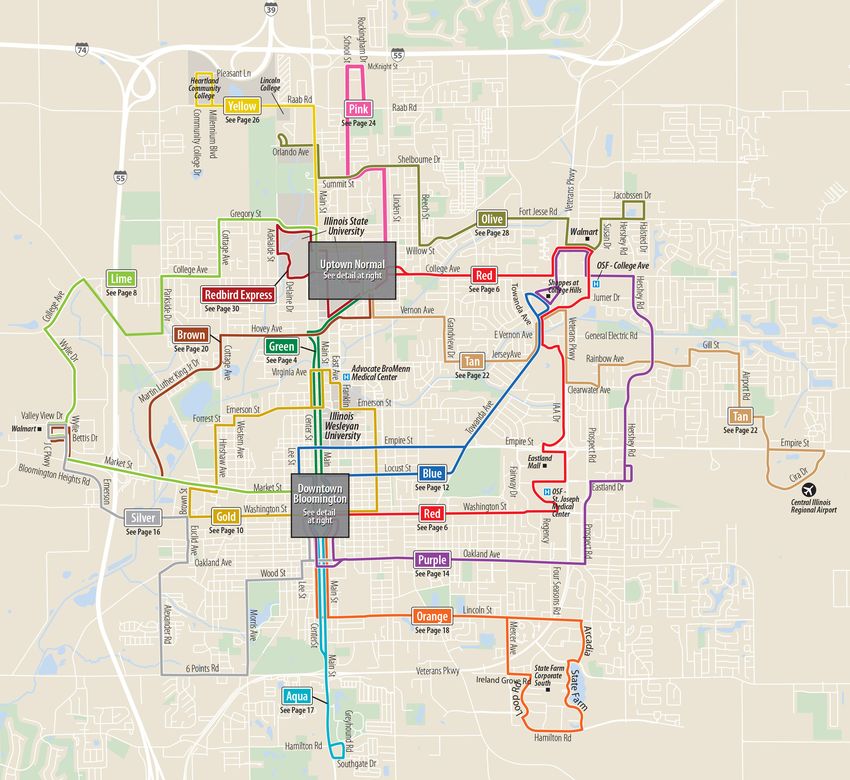
CONNECT TRANSIT
Short-Range Transit Plan (SRTP)

TABLE OF CONTENTS

Introduction and Executive Summary .  .  .  .  .  .  .  .  .  .  .  .  .  .  .  .  .  .  .  .  .  .  .  .  .  .  .  .  .  .  .  .  .  .  .  .  .  .  .  . 3

Connect Transit Service Area Profile .  .  .  .  .  .  .  .  .  .  .  .  .  .  .  .  .  .  .  .  .  .  .  .  .  .  .  .  .  .  .  .  .  .  .  .  .  .  .  .  . 6
Service Area. .  .  .  .  .  .  .  .  .  .  .  .  .  .  .  .  .  .  .  .  .  .  .  .  .  .  .  .  .  .  .  .  .  .  .  .  .  .  .  .  .  .  .  .  .  .  .  .  .  .  .  .  .  .  .  .  .  .  .  .  .  .  .  .  .  .  .  .  .  .  . 7

Demographic Profile of Bloomington-Normal.  .  .  .  .  .  .  .  .  .  .  .  .  .  .  .  .  .  .  .  .  .  .  .  .  .  .  .  .  .  .  .  .  .  .  .  .  .  .  .  .  .  . 8

Connect System Profile .  .  .  .  .  .  .  .  .  .  .  .  .  .  .  .  .  .  .  .  .  .  .  .  .  .  .  .  .  .  .  .  .  .  .  .  .  .  .  .  .  .  .  .  .  .  .  .  .  .  .  .  . 9
Fixed Route.  .  .  .  .  .  .  .  .  .  .  .  .  .  .  .  .  .  .  .  .  .  .  .  .  .  .  .  .  .  .  .  .  .  .  .  .  .  .  .  .  .  .  .  .  .  .  .  .  .  .  .  .  .  .  .  .  .  .  .  .  .  .  .  .  .  .  .  .  .  . 10

Connect Mobility (Paratransit) .  .  .  .  .  .  .  .  .  .  .  .  .  .  .  .  .  .  .  .  .  .  .  .  .  .  .  .  .  .  .  .  .  .  .  .  .  .  .  .  .  .  .  .  .  .  .  .  .  .  .  .  .  .  . 16

Connect Facilities.  .  .  .  .  .  .  .  .  .  .  .  .  .  .  .  .  .  .  .  .  .  .  .  .  .  .  .  .  .  .  .  .  .  .  .  .  .  .  .  .  .  .  .  .  .  .  .  .  .  .  .  .  .  .  .  .  .  .  .  .  .  .  .  .  . 23

Fleet Management.  .  .  .  .  .  .  .  .  .  .  .  .  .  .  .  .  .  .  .  .  .  .  .  .  .  .  .  .  .  .  .  .  .  .  .  .  .  .  .  .  .  .  .  .  .  .  .  .  .  .  .  .  .  .  .  .  .  .  .  .  .  .  .  . 24

Funding .  .  .  .  .  .  .  .  .  .  .  .  .  .  .  .  .  .  .  .  .  .  .  .  .  .  .  .  .  .  .  .  .  .  .  .  .  .  .  .  .  .  .  .  .  .  .  .  .  .  .  .  .  .  .  .  .  .  .  .  .  .  .  .  .  .  .  .  .  .  .  .  .  . 25

Connect Transit Survey Results.  .  .  .  .  .  .  .  .  .  .  .  .  .  .  .  .  .  .  .  .  .  .  .  .  .  .  .  .  .  .  .  .  .  .  .  .  .  .  .  .  .  .  . 30
Fixed Route Rider Profile.  .  .  .  .  .  .  .  .  .  .  .  .  .  .  .  .  .  .  .  .  .  .  .  .  .  .  .  .  .  .  .  .  .  .  .  .  .  .  .  .  .  .  .  .  .  .  .  .  .  .  .  .  .  .  .  .  .  .  . 33

Gaps and Opportunities Analysis .  .  .  .  .  .  .  .  .  .  .  .  .  .  .  .  .  .  .  .  .  .  .  .  .  .  .  .  .  .  .  .  .  .  .  .  .  .  .  .  .  .  . 37
Transit Propensity .  .  .  .  .  .  .  .  .  .  .  .  .  .  .  .  .  .  .  .  .  .  .  .  .  .  .  .  .  .  .  .  .  .  .  .  .  .  .  .  .  .  .  .  .  .  .  .  .  .  .  .  .  .  .  .  .  .  .  .  .  .  .  .  . 37

Fixed Routes Analysis with Respect to Transit Propensity.  .  .  .  .  .  .  .  .  .  .  .  .  .  .  .  .  .  .  .  .  .  .  .  .  .  .  .  .  .  .  . 40

Major and Minor Transit Routes .  .  .  .  .  .  .  .  .  .  .  .  .  .  .  .  .  .  .  .  .  .  .  .  .  .  .  .  .  .  .  .  .  .  .  .  .  .  .  .  .  .  .  .  .  .  .  .  .  .  .  .  . 44

Recommendations .  .  .  .  .  .  .  .  .  .  .  .  .  .  .  .  .  .  .  .  .  .  .  .  .  .  .  .  .  .  .  .  .  .  .  .  .  .  .  .  .  .  .  .  .  .  .  .  .  .  .  .  .  .  . 46
Group 1: Transit Service .  .  .  .  .  .  .  .  .  .  .  .  .  .  .  .  .  .  .  .  .  .  .  .  .  .  .  .  .  .  .  .  .  .  .  .  .  .  .  .  .  .  .  .  .  .  .  .  .  .  .  .  .  .  .  .  .  .  .  . 47

Group 2: Transit Supportive Development. .  .  .  .  .  .  .  .  .  .  .  .  .  .  .  .  .  .  .  .  .  .  .  .  .  .  .  .  .  .  .  .  .  .  .  .  .  .  .  .  .  .  .  . 48

Group 3: Better Bus Stops. .  .  .  .  .  .  .  .  .  .  .  .  .  .  .  .  .  .  .  .  .  .  .  .  .  .  .  .  .  .  .  .  .  .  .  .  .  .  .  .  .  .  .  .  .  .  .  .  .  .  .  .  .  .  .  .  .  . 52

Group 4: ADA/Paratransit.  .  .  .  .  .  .  .  .  .  .  .  .  .  .  .  .  .  .  .  .  .  .  .  .  .  .  .  .  .  .  .  .  .  .  .  .  .  .  .  .  .  .  .  .  .  .  .  .  .  .  .  .  .  .  .  .  .  . 56

Group 5: Marketing and Community Engagement.  .  .  .  .  .  .  .  .  .  .  .  .  .  .  .  .  .  .  .  .  .  .  .  .  .  .  .  .  .  .  .  .  .  .  .  .  . 57

Group 6: Innovative Solutions .  .  .  .  .  .  .  .  .  .  .  .  .  .  .  .  .  .  .  .  .  .  .  .  .  .  .  .  .  .  .  .  .  .  .  .  .  .  .  .  .  .  .  .  .  .  .  .  .  .  .  .  .  .  . 58

Performance Indicators, Targets, and Reporting .  .  .  .  .  .  .  .  .  .  .  .  .  .  .  .  .  .  .  .  .  .  .  .  .  .  .  .  . 64

SRTP            |      TABLE OF CONTENTS                                                                                                                                                                  DRAFT MAY 2019                  1
TABLE OF CONTENTS

FIGURES AND TABLES
Figure 1: Fixed Route Ridership from FY 2011 to FY 2018 .  .  .  .  .  .  .  .  .  .  .  .  .  .  .  .  .  .  .  .  .  .  .  .  .  .  .  .  .  .  .  . 10
Figure 2: Share of Overall Ridership Per Route.  .  .  .  .  .  .  .  .  .  .  .  .  .  .  .  .  .  .  .  .  .  .  .  .  .  .  .  .  .  .  .  .  .  .  .  .  .  .  .  . 12
Figure 3: Average Riders Per Hour (RPH) .  .  .  .  .  .  .  .  .  .  .  .  .  .  .  .  .  .  .  .  .  .  .  .  .  .  .  .  .  .  .  .  .  .  .  .  .  .  .  .  .  .  .  .  .  . 13
Figure 4: Ridership Frequency by Route and by Time of the Day . . . . . . . . . . . . . . . . . . . . . . . . . .13
Figure 5: Fare Type and Monthly Average Users .  .  .  .  .  .  .  .  .  .  .  .  .  .  .  .  .  .  .  .  .  .  .  .  .  .  .  .  .  .  .  .  .  .  .  .  .  .  . 14
Figure 6: Connect Mobility Service Areas .  .  .  .  .  .  .  .  .  .  .  .  .  .  .  .  .  .  .  .  .  .  .  .  .  .  .  .  .  .  .  .  .  .  .  .  .  .  .  .  .  .  .  .  .  . 17
Figure 7: Type of Disability by Percentage of Mobility Riders .  .  .  .  .  .  .  .  .  .  .  .  .  .  .  .  .  .  .  .  .  .  .  .  .  .  .  .  . 20
Figure 8: Mobility User Trip Frequency.  .  .  .  .  .  .  .  .  .  .  .  .  .  .  .  .  .  .  .  .  .  .  .  .  .  .  .  .  .  .  .  .  .  .  .  .  .  .  .  .  .  .  .  .  .  .  . 21
Figure 9: Cost Per Passenger Mile.  .  .  .  .  .  .  .  .  .  .  .  .  .  .  .  .  .  .  .  .  .  .  .  .  .  .  .  .  .  .  .  .  .  .  .  .  .  .  .  .  .  .  .  .  .  .  .  .  .  .  . 22
Figure 10: Operating Expenses Share as Percent of Total. .  .  .  .  .  .  .  .  .  .  .  .  .  .  .  .  .  .  .  .  .  .  .  .  .  .  .  .  .  .  . 22
Figure 11: Mobility Projection.  .  .  .  .  .  .  .  .  .  .  .  .  .  .  .  .  .  .  .  .  .  .  .  .  .  .  .  .  .  .  .  .  .  .  .  .  .  .  .  .  .  .  .  .  .  .  .  .  .  .  .  .  .  .  . 23
Figure 12: FY 2019 Projected Revenue .  .  .  .  .  .  .  .  .  .  .  .  .  .  .  .  .  .  .  .  .  .  .  .  .  .  .  .  .  .  .  .  .  .  .  .  .  .  .  .  .  .  .  .  .  .  .  . 25
Figure 13: 2019 Operating Budget and Projections .  .  .  .  .  .  .  .  .  .  .  .  .  .  .  .  .  .  .  .  .  .  .  .  .  .  .  .  .  .  .  .  .  .  .  . 27
Figure 14: 2019 Capital Budget and Projections.  .  .  .  .  .  .  .  .  .  .  .  .  .  .  .  .  .  .  .  .  .  .  .  .  .  .  .  .  .  .  .  .  .  .  .  .  .  . 28
Figure 15: Primary Sources of Transit Funding, Current and Potential .  .  .  .  .  .  .  .  .  .  .  .  .  .  .  .  .  .  . 28
Figure 16: Location of Survey Respondents.  .  .  .  .  .  .  .  .  .  .  .  .  .  .  .  .  .  .  .  .  .  .  .  .  .  .  .  .  .  .  .  .  .  .  .  .  .  .  .  .  .  .  . 31
Figure 17: Percentage of Survey Respondents Compare to Route Ridership .  .  .  .  .  .  .  .  .  .  .  .  .  .  . 32
Figure 18: ISU and Heartland are Taking Advantage of the Universal Access Program .  .  .  .  .  .  . 36
Figure 19: Transit Propensity Map.  .  .  .  .  .  .  .  .  .  .  .  .  .  .  .  .  .  .  .  .  .  .  .  .  .  .  .  .  .  .  .  .  .  .  .  .  .  .  .  .  .  .  .  .  .  .  .  .  .  .  . 39
Figure 20: Transit Route, Bus Stop Daily Ridership in Conjunction with Transit Propensity .  .  . 40
Figure 21: Bus Stop & Frequency of Service within Low & Moderate Income Census Blocks .  . 41
Figure 22: High Intensity Transit Routes in Conjunction with Transit Propensity .  .  .  .  .  .  .  .  .  .  .  . 44
Figure 23: Growth Priorities .  .  .  .  .  .  .  .  .  .  .  .  .  .  .  .  .  .  .  .  .  .  .  .  .  .  .  .  .  .  .  .  .  .  .  .  .  .  .  .  .  .  .  .  .  .  .  .  .  .  .  .  .  .  .  .  . 50
Figure 24: Bus Stops with 15 or More Boardings Per Day . .  .  .  .  .  .  .  .  .  .  .  .  .  .  .  .  .  .  .  .  .  .  .  .  .  .  .  .  .  .  . 53
Figure 25: Bus Stops with Zero Rides in 6 Months .  .  .  .  .  .  .  .  .  .  .  .  .  .  .  .  .  .  .  .  .  .  .  .  .  .  .  .  .  .  .  .  .  .  .  .  .  . 55

Table 1: Route Frequencies. .  .  .  .  .  .  .  .  .  .  .  .  .  .  .  .  .  .  .  .  .  .  .  .  .  .  .  .  .  .  .  .  .  .  .  .  .  .  .  .  .  .  .  .  .  .  .  .  .  .  .  .  .  .  .  .  . 12
Table 2: Connect Mobility Frequent Destinations. .  .  .  .  .  .  .  .  .  .  .  .  .  .  .  .  .  .  .  .  .  .  .  .  .  .  .  .  .  .  .  .  .  .  .  .  .  . 19
Table 3: Attributes Analyzed for Transit Propensity . .  .  .  .  .  .  .  .  .  .  .  .  .  .  .  .  .  .  .  .  .  .  .  .  .  .  .  .  .  .  .  .  .  .  .  . 38
Table 4: Major and Minor Transit Corridors Recommendation .  .  .  .  .  .  .  .  .  .  .  .  .  .  .  .  .  .  .  .  .  .  .  .  .  .  . 45

APPENDICES
Appendix A—Route Descriptions.  .  .  .  .  .  .  .  .  .  .  .  .  .  .  .  .  .  .  .  .  .  .  .  .  .  .  .  .  .  .  .  .  .  .  .  .  .  .  .  .  .  .  .  .  .  .  .  .  .  .  .  . 66

Appendix B—Frequent Location Stops.  .  .  .  .  .  .  .  .  .  .  .  .  .  .  .  .  .  .  .  .  .  .  .  .  .  .  .  .  .  .  .  .  .  .  .  .  .  .  .  .  .  .  .  .  .  .  . 68

Appendix C—Relevant Plans & Studies.  .  .  .  .  .  .  .  .  .  .  .  .  .  .  .  .  .  .  .  .  .  .  .  .  .  .  .  .  .  .  .  .  .  .  .  .  .  .  .  .  .  .  .  .  .  .  . 71

SRTP          |     TABLE OF CONTENTS                                                                                                                                           DRAFT MAY 2019              2
INTRODUCTION AND
EXECUTIVE SUMMARY

Providing urban public transit service is a complex undertaking,
bound by extensive regulation, uncertain funding, and the inevitable
complications of operating a service for the general public.
Accountability demands that every aspect of the operation
be documented and structured according to the rules. To carry
out these tasks requires careful planning.

This Short-Range Transit Plan fills the gap between immediate decisions and prospective action
that extend across decades. In a period of substantial transition in Connect Transit’s operations and
expectations, and within the major task of establishing and building a complete network of fixed transit
stops, the short-range plan focuses on tasks for which preparation has been done but execution
is waiting, on small-scale changes that enable more complex actions to follow, and common-sense
decisions and implementation to correct specific issues over the next three to five years.

This planning effort provides two advantages. First is its framework for rapid response to issues and
actions that support but are not central to long-range goals. Second, the short-range timeline allows for
new ideas, new technology and new infrastructure to be integrated into Connect Transit management
and operations more quickly, bringing their benefits to bear within the annual and five-year update
schedules of existing plans. However, the Short-Range Plan is not intended to short-circuit the program
requirements discussed in daily operations and in long-term planning. It is intended to foster greater
flexibility, responsiveness, and proactive decision-making into the mix, acknowledging constraints and
finding ways to move past them.

This report examines the current status of Connect Transit operations and administration, and focuses
on recommendations for actions over the next three to five years.

SRTP   |   INTRODUCTION & EXECUTIVE SUMMARY                                DRAFT MAY 2019                   3
The plan builds on existing Connect Transit plans, programs and services, ridership data and Transit
Ridership Survey conducted earlier in 2018. Additional grounding for the plan draws from the adopted
plans such as comprehensive plans for Bloomington and Normal and the Long Range Transportation
Plan, review of projects and initiatives Connect Transit has in view or underway. Financial feasibility
and feasibility for rapid implementation were also taken into account. It also incorporates an extensive
analysis of areas with high likelihood of transit ridership (transit propensity) in Bloomington-Normal,
meaning parts of the community where residents (or work locations) exhibit demographic and economic
characteristics that indicate a high likelihood of transit use.

KEY FINDINGS AND RECOMMENDATIONS
■   Current ridership is transit dependent. While transit becoming a mode of choice is a good long-term
    goal, Connect Transit should focus on serving those who are dependent on it in the short-term.
■   Some very low-income transit riders are paying a higher price to ride the bus. Data suggests that
    frequent transit riders in the lowest income brackets (under $24,000) are using cash to pay for their
    rides. The upfront cost of a bus pass can be a real barrier for many of these riders. Connect should
    prioritize fare capping or other mechanisms to ensure that riders with most need are not unduly
    burdened. Partnership with the McLean County Chamber of Commerce to expand employer-based
    bus pass programs to small businesses and retail operations that may employ transit-dependent
    populations must be considered.
■   Generally speaking, Connect Transit routes are aligned well with the transit propensity of the
    community. Minor modifications to some routes should be further investigated to better align the
    routes with the community need. Those include:
    —Changing the peak hours of Silver and Purple routes
    —Re-routing Blue through higher transit propensity areas such as Vernon Avenue in Normal
    —Changing the frequency of Brown Route to 30 minutes
    —Consider breaking the Tan Route into two routes, utilizing the Shoppes at College Hills as a minor
      transfer hub for buses to continue on or turn back around.
    —In the area south of Downtown Bloomington, bounded by Washington on the north, Oakland on
      the south, Main Street on the east and Morris Avenue on the west, analysis found higher transit
      propensity with low coverage. Several routes run along Washington Street and Main Street. Connect
      should examine the possibility of expanding coverage in this area.

■   Five out of the fifteen routes (Redbird Express, Green, Red, Lime, and Yellow) account for 70% of
    all ridership. Routes with 30 minute or better frequency throughout the day typically have higher
    ridership.
■   Ridership is growing on both fixed route and Connect Mobility. There is room for improvement in
    transit ridership from some institutions and employers who are part of the universal access program.
■   There are 480 bus stops serviced daily as of August 2018.

SRTP   |   INTRODUCTION & EXECUTIVE SUMMARY                                  DRAFT MAY 2019                 4
—319 (66.5%) stops are serviced at least every 30 minutes at some point during the day, referred to
      as high-frequency stops. Nearly 75% of high-frequency bus stops are located in low and moderate
      income census blocks.
■   Normal and Bloomington transit riders are very different. Nearly 70% of Normal riders are under the
    age of 24, and 52% are students while Bloomington riders are more distributed with a majority (48%)
    of riders being 25–45 and 46% are employed full-time.
■   Mobility rides cost Connect Transit nearly three times more than fixed routes. While encouraging more
    people to use fixed routes seems like a natural solution, the fact that every Mobility rider has a unique
    set of needed accommodations makes it very difficult to achieve. More than a quarter of Mobility riders
    live in skilled care group facilities. Connect should continue to partner with local and regional alliances
    to cooperatively improve and expand ADA/Paratransit services.
■   21st century innovations are revolutionizing transit systems across the world. These include electric
    vehicles, autonomous vehicles, ride sharing, smart infrastructure, big data and analytics. After carefully
    reviewing these options, some of these programs may not be feasible for implementation in the
    Bloomington-Normal market yet. Three to five years (the horizon period of this plan) is a long time
    in terms of technological advancements. Connect Transit should examine the innovations outlined
    in Group 6 of the Recommendations chapter closely to determine optimal time for implementation.
    In the meantime, Connect should focus on streamlining the data it gathers and utilize analytics to
    improve efficiency as well as utilizing technologies to improve fare management systems.
■   This study calls for specific actions to make Bloomington and Normal more transit supportive. Those
    include:
    —Designating Major and Minor Transit Corridors based on demand and usage of transit. Table 3 in the
      Gaps and Opportunities Analysis Chapter shows specific suggestions.
    —Improve bus stop facilities and their accessibility, prioritizing those along Major and Minor Transit
      Corridors.
    —Partner with local municipalities to help them implement programs that enhance the multi-modality
      of streets in Bloomington-Normal.

    WHAT IS TRANSIT PROPENSITY?
    Transit propensity means finding the locations that have the highest probability
    of people using and/or needing public transportation so that Connect Transit can
    make sure those locations are being served. Finding these locations means more
    than just finding popular places, it also includes finding high transit propensity
    populations and learning where they live and travel to. MCRPC conducted this analysis
    to ensure that Connect Transit reaches these people so they may use transit as a functional, everyday
    option, as well as having it as a tool to inform future adjustments. See Table 3 and Figure 18 in the
    Gaps and Opportunities Analysis Chapter to see the breakdown and output of this analysis.

SRTP   |   INTRODUCTION & EXECUTIVE SUMMARY                                   DRAFT MAY 2019                  5
CONNECT TRANSIT
SERVICE AREA PROFILE

Urban area public transit has a long history in Bloomington-Normal. Its
inception after the Civil War using horse-powered cars as the Bloomington
& Normal Street Railway, evolution in the 1930s as the Bloomington-Normal
City Lines Inc., and transformation into the Bloomington-Normal Public
Transit System in the 1970s set the stage for today’s Connect Transit (CT). Over
a decade of rapid change and growth, Connect Transit has continued to grow.

SRTP   |   SERVICE AREA PROFILE                               DRAFT MAY 2019       6
Connect Transit Growth in the Last Decade

Connect Transit began and advanced the                     Connect Transit made progress
building of a new and more up-to-date                      on continuing improvement of
vehicle fleet, including vehicles using                    infrastructure at bus stops, with
renewable energy, increasing the fixed                     the Better Bus Stops initiative in
route fleet by 45% in the last 3 years                     2018

Connect Transit entered into closer                        In 2010, Connect Transit moved from
partnerships with Bloomington,                             its undersized downtown location to
Normal, and MCRPC in 2017-2018 to                          a new facility on the west side, with
support the continued development of                       capacity for future growth.
transit services in the urban area.

In 2018-2019, Connect Transit committed to                 In 2015, Connect Transit completed
participation in several regional                          a major operational study and a
studies and projects aimed at                              reinvention of the fixed route system
transportation system safety                               established a network of fixed-
improvements, refining the urban-rural transit             location bus stops around the
relationship, and pursuing long-term fiscal and            community.
operational sustainability.

Service Area
Connect Transit has unusual characteristics when compared to other small urban transit systems in
Illinois. Most notably, Connect Transit is not organized as a mass transit district. Instead, it is a creature
of the two municipalities, Bloomington and Normal, which appoint and are represented on the CT Board
of Trustees. These two municipalities provide some direct funding support to the system according to an
agreed process established in the transit system charter.

This organization structure limits the Connect Transit service area to within the incorporated boundaries
of Bloomington and Normal, a restriction applied to both fixed route and mobility (paratransit) service.
(See Figure 6 in the Connect System Profile Chapter, Service Area Map) Given the irregular boundaries
of both Bloomington and Normal, this limitation can exclude people likely to have a high propensity for
transit use who live immediately outside the incorporation boundaries. There are a number of residential
developments immediately adjacent to, but not within, Bloomington and Normal which would benefit
greatly from expansion of transit service access beyond the municipal boundaries. While the strategic
implications of this structure will be pointed out, these and other longer-term issues are not discussed in
this short-range plan as they fall beyond it’s scope.

SRTP   |   SERVICE AREA PROFILE                                               DRAFT MAY 2019                     7
Demographic Profile of Bloomington-Normal
Bloomington-Normal is often analyzed as a single community, given that many residents and visitors
don’t distinguish between them in day-to-day activities. The infographic below highlights some general
demographic information applicable to transit about the aggregated population of Bloomington and Normal.

Information based on data from the U.S. Census American Community Survey (ACS) five-year samples for 2013–2017.

BLOOMINGTON-NORMAL
                                  AGE
        BLOOMINGTON                                                                                                           0-1                 3+ cars
                                                                                                                              cars
          + NORMAL               30,000
                                 25,000

   133,000
                                 20,000
                                 15,000
                                 10,000
                                  5,000                                                                                                           2 cars
          population                                                                                                             Cars available
                                      0
                                           0–9    10–19 20–29 30–39 40–49 50–59 60–69 70–79                       80+             to workers

 INCOME                          HOW WE GET TO WORK

                                                         78.6%                                                                   9.4% Carpool
                                                         Drive Solo

Less than $10,000          9%
$10,000 to $14,999         5%                                                                                                     1% Other
                                                                                                                              (catch a cab, ride
$15,000 to $24,999         9%                                                                                                   a motorcycle)
$25,000 to $34,999         8%
$35,000 to $49,999        11%
$50,000 to $74,999        17%
$75,000 to $99,999        13%
$100,000 to $149,999      16%
$150,000 to $199,999       7%
$200,000 or more           6%             5.1% Walk              3.6% Work at Home                 2.2% Take the Bus                 .5% Pedal

 RACE                             EDUCATION
White                    80.0%   25,000
Black/African American   10.0%   20,000
Asian                     6.5%   15,000
2 or More Races           2.4%   10,000
Other                     1.2%    5,000
American Indian/          0.2%       0
Alaska Native                             High School    GED or      Some College,   Associate’s     Bachelor’s    Master’s   Professional   Doctorate
                                           Diploma      Equivalent    No Degree       Degree          Degree       Degree        School

SRTP      |   SERVICE AREA PROFILE                                                                          DRAFT MAY 2019                               8
CONNECT SYSTEM PROFILE

Connect Transit offers two distinct transportation programs.
1. Fixed Route: Fixed route services include any transit service in which vehicles run along
   an established path at preset scheduled times. Passengers are expected to get on-board and
   off-board at designated bus stops.

2. Paratransit: Paratransit is specialized bus service providing curb to curb transportation
   for persons whose disability prevents them from riding local fixed route buses. Vehicles used
   to provide paratransit (mobility) service are equipped to give access to people with mobility
   issues and for those using assistive devices, such as walkers or wheelchairs.

SRTP   |   CONNECT SYSTEM PROFILE                                         DRAFT MAY 2019           9
Fixed Route
Connect Transit’s current fixed route system operates using 15 different fixed routes and currently
services 480 bus stops. Uptown Station in Normal and Downtown Bloomington serve as major transfer
centers offering 3 or more route transfers. Walmart store locations in both Bloomington and Normal
serve as micro transfer centers as well as the Shoppes at College Hills

As shown in Figure 1, fixed route ridership has fluctuated over the years. The route restructuring in 2016
initially caused a decrease in FY 2017. FY 2018 saw a modest increase of 1% compared to the previous
year. Connect Transit estimates nearly 16% (or 3% annually from FY 2018 to FY 2023) increase
in its ridership by 2023.1

Figure 1: Fixed Route Ridership from FY 2011 to FY 20181

3,000,000

                                                           2,654,677
                                           2,522,000
2,500,000
                                                                                2,427,565

                                                                                     2,217,641   2,240,244
                        2,033,698
2,000,000
                                    2,009,241

            1,807,676

1,500,000
            FY2011      FY2012      FY2013        FY2014   FY2015      FY2016         FY2017     FY2018

Frequency
Fixed routes run between the times of 5:40 a.m. to 10:00 p.m and Monday through Saturday with
compressed schedules on Sundays. Extended hours on a number of routes begin when the school and
university academic year begins in August, and can extend as late as 3:00 a.m. on weekends. As identified
in Table 1, eleven (11) of the 15 routes have 30 minutes or better frequencies at some point during the
weekday, while 6 of them have 30 minutes or better frequencies at all times during weekdays. Appendix A
provides a detailed description of span, frequency, and daily trips during weekdays and weekends.

1 Source: Connect Transit Fleet Management Plan, Revised July 2018

SRTP    |   CONNECT SYSTEM PROFILE                                                                       DRAFT MAY 2019   10
Routes Map
Downtown
Bloomington
Uptown Normal
SRTP | CONNECT SYSTEM PROFILE DRAFT MAY 2019 11Table 1: Route Frequencies
Route Peak Frequency Off Peak Frequency RPH During Peak* Overall Average RPH
Redbird 5–7 Minutes 20 Minutes 249.1 75.1
Yellow 15 Minutes 30 Minutes 55.1 28.2
Green 15 Minutes 15 Minutes 51.8 45.4
Lime 30 Minutes 30 Minutes 64.5 59.3
Red 30 Minutes 30 Minutes 63.2 60.3
Purple 30 Minutes 60 Minutes 39.0 22.1
Silver 30 Minutes 60 Minutes 21.6 13.0
Aqua 30 Minutes 60 Minutes 20.9 12.9
Orange 30 Minutes 60 Minutes 14.5 8.3
Blue 30 Minutes 60 Minutes 12.9 8.3
Pink 30 Minutes 30 Minutes 12.2 11.6
Gold 60 Minutes 60 Minutes 14.5 13.1
Tan 60 Minutes 60 Minutes 10.4 10.3
Brown 60 Minutes 60 Minutes 9.6 9.2
Olive 60 Minutes 60 Minutes 9.3 8.7
*Weekday riders per hour (RPH) for routes with same frequency all day
As shown in Figure 2, the Redbird route alone accounts for over 20% of ridership. This route predominantly
serves the Illinois State University campus, servicing the stops every 5 to 7 minutes and no longer than 20
minutes during weekdays. The Green, Red, Lime, and Yellow routes account for over 50% of all Connect
transit rides. Downtown Bloomington and Uptown Normal are among the popular destinations on these
routes along with student apartments, schools and colleges, shopping and entertainment venues. Figure
3 shows individual route performance during weekdays and weekends. A third, 30%, of the ridership is
shared by the rest of the routes.
Figure 2: Share of Overall Ridership Per Route
3% Silver
3% Tan
3% Gold
The Green, Lime, Red,
21% Redbird 2% Olive and Yellow routes
3% Aqua account for over 50% of
2% Orange
3% Brown all Connect Transit rides.
2% Blue Those routes plus the
3% Pink
Redbird Express make up
15% Lime
5% Purple over 70% of all Connect
Transit rides.
8% Yellow
12% Green
SRTP | CONNECT SYSTEM PROFILE DRAFT MAY 2019 12Figure 3: Average Riders Per Hour (RPH)
100 94 .5 Weekday Wee
Weekend
80
Average RPH Total Wee
60
64 .5 63 .2
Aver
51 .8 52 .8
48 .2
40 37 .7 39 .9
30 .0 29 .6
20 16 .2 16 .4
14 .5 12 .210 .7 15 .4 12 .0 11 .3
9 .6 7 .8 10 .1 9 .3 7 .0 10 .76 .4 10 .2 10 .4 9 .4
7 .3 5 .6
0
Brown Gold Green Lime Olive Pink Red Purple Yellow Silver Orange Blue Aqua Redbird Tan
Data from October 2017 to August 2018 averaged
Based on the data, it is safe to say that frequency has a large effect on ridership. Routes that have
consistently high frequencies (30 minutes or better) throughout the day such as Redbird, Yellow, Green,
Lime and Red have the highest ridership.
Figure 4: Ridership Frequency by Route and by Time of the Day
60 Yellow
55.05
Purple
Blue
50
Aqua
48.27 44.71 Orange
Silver
40 38.99
Silver
Orange
28.69 Blue
30
27.15
Yellow
21.59
20
18.62 17.28 20.86 19.48
Aqua
14.30 14.48 16.96
13.35 16.46 11.67
10 11.65 10.72 12.91 11.40 Purple
9.02 6.19
4.86
0
Morning Peak Morning Off-Peak Afternoon Peak Night Off-Peak
SRTP | CONNECT SYSTEM PROFILE DRAFT MAY 2019 13Price and Availability Factors
A typical Connect Transit ride costs $1 including transfers. Many Connect riders take advantage of bus
passes allowing access over a set period of time. Regular service fare options include:
■ 1 Ride—$1 ■ 7 Day Pass—$10
■ 1 Day Pass—$3 ■ 30 Day Pass—$32
A few area employers, educational institutions, and social service agencies offer fare subsidy programs.
These programs allow unlimited rides for students, and employees of these agencies. These include:
■ Illinois State University ■ Heartland Community College ■ Town of Normal
■ Illinois Wesleyan University ■ Illinois Farm Bureau Companies ■ Youth Build
Other fare subsidy programs include:
■ Free rides for kids under the age of 5 when accompanied by a fare paying rider
■ Senior Free Ride Pass for people 65 years or older
■ BEAM Pass (or Circuit Breaker) recipients
■ People with disabilities are offered half fare after receiving a pass from Connect Transit
Administration Office.
Figure 5: Fare Type and Monthly Average Users (June 2017- June 2018)
ISU 43,413.2
UNIVERSAL ACCESS
IWU 542.5
PROGRAM
HCC 9,157.6
Illinois Farm Bureau Companies 597.9
Town of Normal 26.4
Youth Build 728.8
Connect Transit Employee 258.3
INTERNAL
PASSES
Family of Connect Transit Employees 581.0
CTAC Members 13.2
Disabled 616.3
PASSES
Senior 5,526.2
BEAM Pass or Circuit Breaker* 9,752.5
Full Fare (Cash) 26,393.0
1 Ride Pass 931.6
1 Day Pass 319.4
7 Day Pass 2,397.5
30 Day Pass 17,808.8
Child 2,080.8
Promotion 357.8
Transfer 10,798.7
Change Card 76.7
Bad Pass 483.1
Short Fare 101.0
0 10,000 20,000 30,000 40,000 50,000
*Illinois Benefit Access Program for seniors and persons with disabilities
SRTP | CONNECT SYSTEM PROFILE DRAFT MAY 2019 14Figure 5 shows the breakdown of how each of these fares and passes were used, calculated as a monthly
average from June 2017 to June 2018. Similar to the trend in route use, those connected to ISU are
overwhelmingly the majority of riders. The next closest are those paying full fare, followed by those
with 30 day passes. 65% of those using an ISU IDs are riding the Redbird service. The remaining uses
are distributed similarly to the most populated routes with 26% using the Red, Lime, Green, and Yellow
routes. People paying full fare are mostly on the Red route, closely followed by Lime, then Green, Purple,
and then Yellow. The 30 day pass holders share the same order of shares per route as those paying full
fare.
Key Observations
■ Connect Transit fixed route ridership is growing.
■ Five out of the fifteen routes account for 70% of all Connect Transit ridership. The remaining
30% ridership is distributed among 10 routes.
—The Redbird route alone accounts for over 20% of total ridership. This route predominantly serves
the Illinois State University campus and services the stops every 5 to 7 minutes and no longer than
20 minutes during weekdays. ISU riders are the single largest user group on the system.
—The Green, Red, Lime, and Yellow lines account for over 50% of all riders.
■ Routes with 30 minute or better frequency throughout the day typically have highest ridership than
those with more than 30 minutes or varied frequencies. The Pink route is an exception. Despite 30
minute frequency throughout the day, ridership is low on this route.
■ For the six routes that do change frequency, the peak times have higher ridership than off-peak,
except for the Silver and Purple routes.
■ There is room for improvement in transit ridership from some institutions and employers, such as the
Town of Normal or Illinois Farm Bureau Companies, who are signed up for universal access programs.
■ As noted in the Connect Transit Survey Results chapter, those who are paying full fare rather than
buying a monthly pass are typically lower income who cannot afford to buy a pass upfront. With
around 8,000 riders buying ride by ride rather than getting a monthly pass each month, Connect
should institute programs like fare caps for more equitable pricing.
The Redbird route accounts for over
20% of total ridership. This route serves
the Illinois State University campus and
services the stops every 5 to 7 minutes
and no longer than 20 minutes
during weekdays.
SRTP | CONNECT SYSTEM PROFILE DRAFT MAY 2019 15Connect Mobility (Paratransit) Mobility service upends the usual relationship between transit and transit users, in which fixed-route service is offered at specific locations and at times determined by the transit system. The demand- response service model used for Connect Mobility service radically expands the possible points of origin, as eligible riders may live anywhere in the incorporated areas of Bloomington-Normal, and seek transportation to the same distribution of destinations served by the fixed route. Service Area By law, paratransit service is provided by urban public transit systems according to a formula based on the extent of the fixed route system, in which paratransit service must be provided at any point within 0.75 miles on either side of a fixed route. In Bloomington-Normal this requirement covers a substantial portion of the incorporated areas to which Connect Transit is restricted. Connect Mobility satisfies this requirement for a fare of $2 each way for standard paratransit demand-response service. Connect Mobility also provides paratransit services beyond the area required by the fixed routes, through two premium mobility services. These expanded services areas go to points up to an additional 0.25 and 0.5 miles beyond the required core zone, with $1 and $2 increases in the base fare, respectively. Currently the premium service is not heavily used, but is used at levels consistent with the much smaller areas the outlying service bands serve within the corporate limits of Bloomington and Normal (See Figure 6, Service Area Map). Together, the regular and premium Mobility service areas cover most of the combined urbanized area of Bloomington and Normal, including much of the residential neighborhood areas. Even with the addition of the premium Mobility service areas, notable exceptions to the served area within the incorporation boundaries remain. These include portions of the Ironwood subdivision and all of the Northbridge and Eagle Crest subdivisions in northeast Normal, most of the Fox Creek area in southwest Bloomington, and the entire Grove subdivision in far southeast Bloomington. Some of these developed areas include public schools and amenities not now accessible by public transit. These gaps in service emphasize the limitations on Connect Transit service resulting from urban sprawl and the restriction to serving only the incorporated areas of Bloomington and Normal. As with the fixed route service, this limitation on Connect Transit service reduces the options available to optimize service delivery and control costs. This remains a matter for discussion by the Board of Trustees and Connect Transit administration. However, the complexities involved in altering the system’s fundamental structure place such an action outside the three- to five-year window of this plan. A moderating factor on the provision of mobility service in the ongoing is Connect Mobility cooperation with non-profit and other providers, both directly and through the MCRPC Transportation Advisory Committee (TAC). Providers such as Advocate BroMenn Adult Day Services, Marcfirst, Faith in Action and rural public transit provider SHOW BUS supplement Connect Mobility services, either for agency clients or the general public. Continuing and increasing coordination and cooperation with these entities is essential to maintaining and expanding services available for people who need and qualify for mobility service. This effort is very much within the window for action in this short-term plan. SRTP | CONNECT SYSTEM PROFILE DRAFT MAY 2019 16
Figure 6: Connect Mobility Service Areas

The service area for the Mobility program is determined by the location of the fixed routes and the incorporated areas of Bloomington and
Normal. As currently organized, Connect Transit cannot provide service beyond the incorporated areas. The standard Mobility service area
extends up to three-quarters of a mile (.75) on each side of a fixed route. In Figure 6, that area, shown in light peach, covers a substantial
portion of the community. To extend the reach of Mobility service, Connect Transit created two Premium service categories. The first, shown
in dark pink, extends service an additional quarter-mile outward from the fixed routes, and the second, shown in red, extends service
an additional half-mile beyond standard service. Fares are higher than for Mobility service in the standard service area.

SRTP     |   CONNECT SYSTEM PROFILE                                                                           DRAFT MAY 2019                     17
Mobility Ridership
Mobility is not an area of service directed at choice riders. People who wish to use the Mobility service
must go through a qualification process. The Connect Transit website and office provide the application
form, which is intended to ensure that Connect Mobility riders meet the requirements for paratransit
service as set forth in the Americans With Disabilities Act (ADA). The application is very detailed, and
requires a great deal of information regarding the applicant’s disability and medical diagnosis, their
cognitive and physical capacities, capacity to use the fixed route system and a list of the assistive devices
used by the applicant.

The application process also requires that a medical professional be identified who can and will verify
the information in the application. Once the complete application is submitted, Connect Transit reviews
the application and the medical verification and determines if the applicant qualifies for Mobility service.
There is an appeal process should the initial review result in a denial.

Three years ago Connect Transit entered into an agreement with the Life Center for Independent Living
(LIFE-CIL) office in Bloomington for assistance in reviewing applications from potential riders seeking to
use Connect Mobility services. LIFE-CIL was also tasked with reviewing the full roster of eligible riders
to determine the current eligibility status of each person listed. (This contract is no longer in force, and
Connect Transit is now maintaining Mobility program and rider information internally.)

Responding to the Connect Transit requirements, LIFE-CIL staff compiled an index of Mobility riders,
including demographic and location information for each qualified rider. Specifically, data collected
regarding each rider included age, gender, race or ethnicity, veteran status, residential address/point of
trip origin, and trip destination addresses. Importantly, it also identifies the primary disability for which
Mobility eligibility was determined, as well as any co-morbid conditions or disabilities experienced by the
rider. During the eligibility review process carried out by LIFE-CIL, the current status of user’s eligibility
was assessed, with the determination that roughly half of the 950 identified users were no longer actively
using the service.

The LIFE-CIL dataset and the opportunity it provides for detailed comparison and analysis have been
essential to the understanding of the challenges and opportunities ahead for Connect Transit’s Mobility
service. Although not all of the riders included are known to be currently using the service, the large size
of the ridership sample provides a better cross-section of the likely ridership mix than can be derived
from the smaller group of recent riders.

The striking characteristic of the currently qualified Mobility riders is the small size of the group in
comparison with the overall ridership of Connect Transit. In addition, the active qualified riders represent
only about ten percent of persons with disabilities in the area, based on the aggregated five-year findings
of the American Community Survey for 2013–2017. The latter statistic suggests that Mobility service
ridership is focused on persons who not only have a qualifying condition or circumstance, but who also
have very limited choices for transportation in daily life.

The paradox of mobility service is the inverse relationship between the number of unduplicated
riders and the resources needed to provide the necessary transit services, as compared to the fixed
route service. Because each population of Mobility riders represents an aggregation of needs and
circumstances that is both unique and constantly changing, efforts to manage costs and improve
efficiency confront requirements that are difficult to predict.

SRTP   |   CONNECT SYSTEM PROFILE                                             DRAFT MAY 2019                   18
Mobility Rider Profile

Mobility riders are generally older than the ridership of the fixed route system.
Riders qualified to use the Mobility service range in age from 12 to 100 years, but the ridership is
concentrated in the upper range of age groups. Persons aged 51 or above make up more than 73%
of the total roster of qualified riders, and have an average age of 62 years. This finding is derived from
the LIFE-CIL dataset, and is consistent with broader demographic data for Bloomington-Normal.

Many Mobility users live in group care facilities.
A notable subgroup among Mobility riders includes people who live in some form of group facility,
such as nursing homes or rehabilitation providers; the principal location of these riders is the McLean
County Nursing Home in Normal. In the LIFE-CIL dataset, 26% of all qualified riders live in nursing homes.
Although this concentration of riders in a handful of locations in Bloomington-Normal might simplify
routing Mobility vehicles, the scheduling needs of each individual rider may not correlate at all with other
residents at the same facility. For Connect Transit, any operational efficiencies realized will need to offset
the administrative demands of coordinating transportation for multiple riders at one origin point to an
array of destinations. In the short term, studying a systematic process of continuing coordination with
care facilities should be investigated as a means to manage transportation for these riders before this
aspect of mobility service creates greater difficulties in managing transportation for all Mobility riders.
This proposal is sufficiently complex that it is likely to require more than five years to implement, but the
idea will be raised during the development of the next long-range transportation plan.

Table 2: Connect Mobility Frequent Destinations

    Frequent Residential Mobility                           Frequent Non-Residential Mobility
    Destinations                                            Destinations

    ■   The Irvin Apartments (239)                          ■   Marcfirst (784)
    ■   215 Douglas (188)                                   ■   Country Financial (GE Road) (144)
    ■   Phoenix Towers (172)                                ■   Second Presbyterian Church (136)
    ■   Near Shelbourne and School Intersection (157)       ■   Pheasant Lanes Family Fun Center (106)
    ■   Fox Creek Neighborhood (intersection of Fox Creek   ■   OSF Medical Group College Avenue (106)
        Road and Savannah Road) (152)                       ■   Walmart (Normal) (105)
    ■   898–800 West Oakland Avenue (114)                   ■   Walmart (Bloomington) (103)
    ■   9th Street in Hilltop Mobile Home Park (110)        ■   Advocate BroMenn Medical Center (95)
    ■   Landings Estate Mobile Home Park (91)               ■   Afni (87)
    ■   Woodhill Towers (89)                                ■   Nicor Gas (82)

  Persons aged 51 or above make up more than 73% of the
  total roster of qualified riders, and have an average age of
  62 years.
  .

SRTP    |   CONNECT SYSTEM PROFILE                                                            DRAFT MAY 2019   19
Figure 7: Type of Disability by Percentage of Mobility Riders
0.6% Hearing
0.8% Unknown
3.0% Mental/Emotional
5.9% Multiple
6.3% Vision
57.0%
Physical
25.3% Cognitive
Mobility users have limitations that forestall use of the fixed-route system.
By definition, Mobility riders are constrained by physician-confirmed medically-based limitations, and
live with a broad range of conditions, circumstances or illnesses. This includes riders who qualify for
the service on a temporary basis, but who may be expected to return to the fixed route system. The
destinations and accommodations riders need will vary for each rider, and for that same rider over time.
Rather than the broad service created by the design, networked capacity and reach of the fixed route
system, mobility service requires flexibility in the fundamentals of the riders’ interactions with the service
as provided by the demand-response model of operation.
Cognitive limitations may forestall a rider’s ability to use fixed-route service even with considerable
support. However, many people with disabilities may find that they prefer the fixed-route service.
Shifting Mobility riders to the fixed-route system was once a specific policy target, with the dual goals
of enabling people with disabilities to use the more frequent and less costly service, and of reducing
demand for the higher level of service required with paratransit.
At minimum, this shift requires a high level of access across the fixed-route system, with adaptable
vehicles, fully accessible bus stops, and staff trained with respect to requirements under the Americans
with Disabilities Act and related legislation. Vehicle specifications, routing choices and efforts such as the
Better Bus Stops campaign should include robust analysis not only of conventional fixed-route standards,
but also of designing the elements of the fixed route system to enable and expand its use by Mobility
riders as they prefer.
For many riders, their ability to navigate Mobility service, let alone to transition to the fixed route system,
is challenged by additional conditions which reduce their capacity to take on the required tasks. For
example, and as shown in Figure 7, more than a quarter of riders have cognitive difficulties; of that
number, about 40% are identified as having Alzheimer’s Disease or some other form of dementia. For
many of these riders, the difficulties of coping with their primary conditions are exacerbated by additional
concerns, ranging from other cognitive issues to physical conditions that create additional barriers or
needs. These co-existing issues create a greater administrative burden for Connect Transit in addressing
these riders’ mobility needs.
SRTP | CONNECT SYSTEM PROFILE DRAFT MAY 2019 20Figure 8: Mobility User Trip Frequency
40%
36.1%
35%
RIDER FREQUENCY AS PERCENTAGE OF MOBILITY
30%
25%
20%
17.5%
15%
10.2% 9.5%
10%
7.1%
4.9% 4.8% 4.9% 4.9%
5%
0%
1–5 6–10 11–15 16–20 21–25 26–30 31–35 36–40 >40
NUMBER OF TRIPS PER UNIQUE RIDER
Mobility Service is statistically complex.
A primary finding is that use of the service is not evenly distributed among all Mobility riders. Figure 8 shows
the percentage of total trips taken in a given period by riders who use the service at varying frequencies.
“Trip” refers to each leg of the overall ride; going to the doctor and then returning home equals two trips,
meaning that the range of trip frequencies should be divided by two to estimate the number of round trips.
More than a third of all trips are taken by riders who use the service infrequently, no more than 5 times per
month. More than 25% of trips involve riders using the service between 6 and 15 times per month, perhaps as
often as four times per week. However, nearly 10% of trips involve riders using mobility service at a rate of more
than 40 times per month, or at least twenty round trips, the equivalent of a round trip on every weekday.
In addition to the potential for multiple constraints applying to the same rider discussed above, the
substantial variance in trip frequency can create greater administrative burdens for Connect Mobility.
At first glance it may seem that, presuming a monthly basis for the chart above, the finding that 36%
of all riders only use the service a maximum of five times each month allows conclusions to be drawn
regarding the cost of service. Looked at in greater depth, the distribution of trip frequency indicates
that the 36% of riders account for just over 7% of all trips. At the other end of the distribution chart, less
than 10% of riders account for nearly 28% of trips. These extremes offer an opportunity to assess how
well the trip reservation and dispatch systems handle the disparity in use frequency, so that the needs
of everyday users and those who ride only a few times each month are all properly managed and that
resources are equitably applied. Further, it provides a more nuanced approach to projecting costs when
analyzing the impact of demographic shifts.
The distribution of trip frequency indicates that the 36% of riders account for just over
7% of all trips. At the other end, less than 10% of riders account for nearly 28% of trips.
36% 28% 10%
use the service use the service use the service more
1–5 times per month 6–15 times per month than 40 times per month
SRTP | CONNECT SYSTEM PROFILE DRAFT MAY 2019 21When considered with the fare structure for Mobility service, the disparate levels of usage are potentially
even more significant for the rider and for Connect’s cost to provide the service. Further investigation
and analysis of these patterns of use is warranted in the near term. Given the highly customized services
offered by the mobility program, any operational area in which these patterns may complicate the
delivery of mobility services is likely to need a closer look over the next three to five years.
Figure 9: Cost Per Passenger Mile 2
$7.00
$6.09 $5.72 $6.19 $6.05 Demand Response
Demand Response
$6.00 $5.32
$4.74 $5.65 $4.85 $5.08 $5.88 Fixed
Fixed RouteRoute
$5.00
$4.00
$3.00
$2.00 $1.375
$1.19 $1.15 $1.21 $1.37
$1.64 $1.07 $0.99 $1.06 $1.11
$1.00
$0.00
2009 2010 2011 2012 2013 2014 2015 2016 2017 2018
One unavoidable aspect of Mobility service is the high cost, attributable to the individualized level of
service provided to riders. Although the vehicles used in Mobility service are far less expensive than fixed
route buses, they can only carry between 12 and 20 passengers, depending on the number of riders
using assistive devices. The many components of delivering a demand response service contribute to the
disparity in cost per passenger mile illustrated in Figure 9, above.
Connect Transit’s data is clear on the cost of this required service, but it also provides a window into likely
future impacts on capital and operating costs. As the population of older Americans become a larger
share of the overall population, there will be increased need for Mobility style services as a component
of public transit. If the basic cost assumptions are reasonably consistent over time, providing Mobility
service will require an expanding share of public transit resources.
A show in Figure 10, this trend has already begun. Over the past decade, Mobility’s share of operating
expenses has increased, and the gap in needs between the two service types has narrowed. In the short-
term this relatively slow phenomenon will continue, and Connect Transit should keep the changing
distribution in mind for medium- and long-term planning.
Figure 10: Operating Expenses Share as Percent of Total 2
100%
85.2% 84.2%
Demand Response
83.4% 81.6% Demand Response
81.3% 78.1%
80%
78.3%
Fixed Route
Fixed Route
76.2% 76.0% 76.0%
60%
40%
21.7% 23.8% 24.0% 21.9% 24.0%
18.4% 18.7%
20%
14.8% 16.6% 15.8%
0%
2009 2010 2011 2012 2013 2014 2015 2016 2017 2018
2 Source: FY 2018 Comprehensive Annual Financial Report
SRTP | CONNECT SYSTEM PROFILE DRAFT MAY 2019 22Figure 11: Mobility Projection 3
100000 Paratransit Ridership
89,313
83,366
80000
74,134
75,477
65,400
60000
50,249 58,035
41,558
40000
FY2011 FY2012 FY2013 FY2014 FY2015 FY2016 FY2017 FY2018
Connect Facilities
Wylie Drive Campus
The Connect Transit (CT) Administration and Maintenance Department Garage, Fueling Station and
Wash Bay are located at 351 Wylie Drive in Normal, Illinois. This facility also includes Connect Transit’s
offices, bus repair, fueling, washing, and storage. The garage facility features a repair facility, a wash bay,
bus parking garage and a fueling station. The entire property is completely fenced and provides secure
parking for all the revenue fleet and support vehicles Connect Transit operates. Connect Transit Facility
Maintenance Plan, last updated in December 2017, dictates the maintenance of this facility.
Bus Stops
In summer 2014, Connect Transit began the process of converting from a “flag stop” system to a traditional
“fixed” stop system. Currently there are 514 bus stops identified with flag poles. Connect Transit recently
launched better bus stop campaign to improve the shelters and other facilities at these stops.
As part of the Better Bus Stops for Bloomington-Normal Campaign,
Connect Transit has provided shelters for over 20 stops and taken
several steps to improve infrastructure including adding Simmi-Seat
units and solar powered lights at various stops around town. Simme-
Seats are small benches made by attaching two seats to a bus stop sign,
one on either side, creating more seating options for stops that may not
warrant a full bench or shelter, but still have riders that will enjoy a place
to sit.
Solar lights have been installed at stops that have low visibility around
Bloomington-Normal. The lights are push activated and solar powered
Simmi-Seat allowing for bursts of light when riders need it to improve the safety and
comfort of riding transit. The guidelines for bus stops that will benefit
from the improvements such as Simme-Seat and solar lights are those that have between 5 and 15 daily
riders as stated in the Better Bus Stops campaign.
The Connect Transit Facility Guide approved in March 2018 lays out the guidelines and the criteria for bus
stop improvements.
3 Source: Connect Transit Fleet Management Plan, Revised July 2018
SRTP | CONNECT SYSTEM PROFILE DRAFT MAY 2019 23Downtown Bloomington Transfer Center Study
Connect Transit serves 1,500 passengers daily at the Front Street transfer point in Downtown
Bloomington. This is Connect’s second busiest transfer point after Uptown Normal. Several studies and
plans, including the most recent Transit Strategic Plan approved by the Connect Transit Board in 2018,
identified the need for a transfer center in Downtown Bloomington. Such a center would allow Connect
Transit to reduce inefficiencies, allow buses to enter two ways, maximize on-time performance in and out
of Downtown Bloomington, improving system performance across the entire system, and provide the
ability to communicate real-time information to customers.
Connect Transit is currently undertaking a site needs analysis for a new Downtown Transfer Center.
Fleet Management
Connect Transit completed a Fleet Management Plan, most recently revised in July of 2018, meant to
evaluate and plan for the next decade until FY2029. With 31.17% growth in Paratransit ridership and
17.35% growth in Fixed Route Ridership over the last 5 years, Connect began the careful evaluation and
planning for their fleet with this Fleet management Plan. It is meant to have regular updates throughout
its life in order to ensure proper management of the fleet as the demand continues to grow and
resources are becoming scarcer for Connect Transit.
The planning process for the Fleet Management Plan was done as follows:
■ Estimating passenger growth 12 years into the future,
■ Establishing productivity standards, hours per vehicle year, rides per vehicle year, and resulting
vehicles required of which the standards will be reevaluated by staff yearly
■ Determining spare vehicles as recommended by staff
■ Determining total vehicles needed measured by the sum of vehicles required to maintain current
productivity standards as well as those required to respond to future demand
■ Determining scheduled procurement and resulting fleet needs
This plan identifies Peak Vehicle Requirements (PVR) (as in the total number of vehicles needed in the peak
periods to satisfy both passenger demand and productivity standards) as a base for the needs of Connect
Transit. Fixed route PVR is 29 vehicles and paratransit PVR is 15 vehicles, which they currently exceed for both.
The excess vehicles are necessary as part of the spare ratio that Connect has identified as a need. Having
spare vehicles ensures system reliability and the spare vehicles are calculated by the difference between total
fleet and peak demand. The goal Connect set is 30% for fixed route and 20% for paratransit. With 10 spare
vehicles in fixed route and 2 for paratransit, they are currently at a 26% and 12% spare ratio respectively.
Connect believes the spare ratio for fixed route is nearly adequate as long as they are able to
replace buses over the next few years. This is prioritized in part by a policy set by the Federal Transit
Administration (FTA). The FTA issued a useful life policy for transit buses to establish a minimum number
of years that transit vehicles must remain in service to ensure a sufficient return. Replacing them once
they meet this goal becomes priority to ensure that breakdowns and unexpected repairs are avoided as
well as maintaining the spare ratio. Connect has replaced twelve fixed route buses throughout 2015 and
2016 as well as ten in 2018, but still have a backlog of twelve vehicles past their useful life which will grow
to seventeen in 2023. There are 13 paratransit vehicles that will need to be replaced from 2019–2021.
Connect Transit will continue this close and detailed overview of the fleet through the Fleet
Management Plan.
SRTP | CONNECT SYSTEM PROFILE DRAFT MAY 2019 24Funding
Connect Transit relies on various program sources to support the operation of transit service. These
transit programs are funded by the federal and state governments, funding support provided by the
City of Bloomington and the Town of Normal, fare revenue directly from passengers as well as through
universal access agreements, and a comparatively small amount of advertising revenue.
Figure 12: FY 2019 Projected Operating Revenue
0% Miscellaneous
1% Advertising
5% Contract Fares
6% Passenger Fares
8% Local Funding
65%
IDOT DOAP
Funding
15% Federal Operating Funding
With this funding, Connect Transit provides transit services which generate operating expenses.
To sustain the transit system and prepare it for future needs, Connect Transit also makes capital
expenditures, such as the purchase of vehicles and facilities construction. Changes in how both the
federal and state transit funding is allocated have posed challenges for this category of expenditures.
Should there be a state capital grant program, transportation funding is expected to be a major
component. Until the details of such a program become public, Connect and other transit systems in
Illinois will have to ration spending on capital projects to ensure that operating costs can be met.
Connect Transit’s profile of funding sourcing diverges somewhat from peer agency sourcing documented
on the Connect Transit Funding Dashboard found on their website. As percentages of total funding,
Connect’s use of some funds is consistent with other transit agencies, such as state funding and “other”
fund sources. However, in some instances, certain fund sources are stable across these agencies;
Connect Transit is an outlier as compared to these peer agencies.
Connect Transit is more reliant on federal funds, using up to three times as much federal money than
peer and regional transit agencies, expressed as a percentage of total funding. In contrast, Connect
Transit receives only 8 percent of its funding from local sources.
Some of these discrepancies, particular with regard to local funding, may result from the peer agencies
being established as mass transit district. There has been considerable discussion of this topic with
respect to Connect Transit; potentially unsustainable funding outcomes may be a reason to continue that
SRTP | CONNECT SYSTEM PROFILE DRAFT MAY 2019 25conversation. Operating revenue derives primarily from the following funding channels discussed below. IDOT Funding The Illinois Downstate Public Transportation Act (30 ILCS 740), usually referred to as the Downstate Operating Assistance Program (DOAP), reflects an effort to balance the transit investments made in northeastern Illinois with funding for urban and rural transit providers for the rest of the state. In FY 2015 through FY 2019, DOAP added more than $1.5 billion dollars to downstate transit budgets, an average of over $300 million annually. Most transit agencies take considerable advantage from the allocation of DOAP funds. Over the last several years Connect has not been able to use the full DOAP Funds allocation, due to the lack of local matching funds. With an additional $1,000,000 in local operating funds from the City of Bloomington and Town of Normal Connect could leverage $2,000,000 of DOAP funds for operations. Connect Transit staff should continue to monitor the status of the DOAP program as Illinois moves to discharge some of its considerable debt. The State of Illinois reimburses 65% of all eligible operating expenses to Connect through the IDOT DOAP, a substantial portion of the overall revenue received. Federal 5307 Funding Transit agencies in urbanized areas with populations under 200,000 persons may receive Section 5307 (49 U.S.C. 53, §5307) program funds for operating assistance, where federal dollars can be allocated to a federal share of 50 percent of operating expenses. There is no cap on the amount that can be used for capital assistance. Every year as expenses increase Connect uses more of this funding for operations, instead of using it for capital purchases. If additional operations funding cannot be found, by fiscal year 2024 Connect will be using nearly 100% of this funding on operations, lessening the ability to carry out capital projects. Under the provisions of the FAST Act, the current omnibus federal transportation law, the Federal Transit Administration oversees a number of grant programs which can provide funding for specific types of capital projects, as well as an overall Capital Projects Grant (49 U.S.C. 53, §5309). Appropriate grants should continue to be pursued vigorously. In the past Connect Transit has obtained grants for buses under Low or No Emissions grant §5339B, and funds under the Bus and Bus Facilities grant, §5339. However, these grants are increasingly competitive, and not all are usable for transit systems in smaller cities. Major U.S. DOT transportation grants, such as the BUILD program that replaced TIGER grants in the FAST Act, are more competitive still, and sometimes require matching funds or other commitments that are unrealistic for Connect’s use, but remain a potential funding source for specific capital projects. In the 5 year Connect Transit estimated Operating Budget the anticipated use of federal transit funding is outlined. When examining the operating and capital budget the ratio of operating expenditures to capital expenditures consistently favor operating funding, with one project-related exception occurring in FY 2022. Local Sales Tax Local funding provided by the City of Bloomington and the Town of Normal forms the backbone of the local funding for Connect Transit. The City of Bloomington provides $610,000 per year and the Town of SRTP | CONNECT SYSTEM PROFILE DRAFT MAY 2019 26
You can also read