Comprehensive Genomic Profiling of Neuroendocrine Carcinomas of the Gastrointestinal System
←
→
Page content transcription
If your browser does not render page correctly, please read the page content below
RESEARCH ARTICLE

Comprehensive Genomic Profiling of
Neuroendocrine Carcinomas of the
Gastrointestinal System
Shinichi Yachida1,2,3, Yasushi Totoki4, Michaël Noë5,6, Yoichiro Nakatani1, Masafumi Horie1, Kenta Kawasaki7,
Hiromi Nakamura4, Mihoko Saito-Adachi4, Masami Suzuki1, Erina Takai1, Natsuko Hama4, Ryota Higuchi8,
Seiko Hirono9, Satoshi Shiba4, Mamoru Kato10, Eisaku Furukawa10, Yasuhito Arai4, Hirofumi Rokutan4,
Taiki Hashimoto11, Shuichi Mitsunaga12, Mitsuro Kanda13, Hidenori Tanaka1, So Takata1, Ayaka Shimomura14,
Minoru Oshima14, Wenzel M. Hackeng15, Tomoyuki Okumura16, Keiichi Okano14, Masakazu Yamamoto8,
Hiroki Yamaue9, Chigusa Morizane17, Koji Arihiro18, Toru Furukawa19, Toshiro Sato7, Tohru Kiyono20,
Lodewijk A.A. Brosens15, Laura D. Wood5,6, Ralph H. Hruban5,6, and Tatsuhiro Shibata4,21

                                                                                                                                              Downloaded from http://aacrjournals.org/cancerdiscovery/article-pdf/12/3/692/3052812/692.pdf by guest on 11 May 2022
                                                                                                                Illustration by Bianca Dunn
ABSTRACT            The neuroendocrine carcinoma of the gastrointestinal system (GIS-NEC) is a rare
                                   but highly malignant neoplasm. We analyzed 115 cases using whole-genome/
               exome sequencing, transcriptome sequencing, DNA methylation assays, and/or ATAC-seq and found
               GIS-NECs to be genetically distinct from neuroendocrine tumors (GIS-NET) in the same location.
               Clear genomic differences were also evident between pancreatic NECs (Panc-NEC) and nonpancre-
               atic GIS-NECs (Nonpanc-NEC). Panc-NECs could be classified into two subgroups (i.e., “ductal-type”
               and “acinar-type”) based on genomic features. Alterations in TP53 and RB1 proved common in
               GIS-NECs, and most Nonpanc-NECs with intact RB1 demonstrated mutually exclusive amplification
               of CCNE1 or MYC. Alterations of the Notch gene family were characteristic of Nonpanc-NECs. Tran-
               scription factors for neuroendocrine differentiation, especially the SOX2 gene, appeared overex-
               pressed in most GIS-NECs due to hypermethylation of the promoter region. This first comprehensive
               study of genomic alterations in GIS-NECs uncovered several key biological processes underlying
               genesis of this very lethal form of cancer.

                                                                                                                                                             Downloaded from http://aacrjournals.org/cancerdiscovery/article-pdf/12/3/692/3052812/692.pdf by guest on 11 May 2022
               SIGNIFICANCE: GIS-NECs are genetically distinct from GIS-NETs. GIS-NECs arising in different organs
               show similar histopathologic features and share some genomic features, but considerable differences
               exist between Panc-NECs and Nonpanc-NECs. In addition, Panc-NECs could be classified into two sub-
               groups (i.e., “ductal-type” and “acinar-type”) based on genomic and epigenomic features.

                                                                              neuroendocrine carcinomas (NEC; Supplementary Fig. S1B
INTRODUCTION                                                                  and S1C). NETs have histologically low-grade nuclear fea-
   Neuroendocrine neoplasms (NEN), characterized by neu-                      tures, and are graded as G1, G2, or G3 on the basis of pro-
roendocrine differentiation, can arise in most epithelial                     liferation activity as assessed by the mitotic rate and the
organs of the body. The digestive system is the most com-                     Ki-67 proliferation index. NECs have high-grade, carcinoma-
mon location, accounting for two thirds of NENs, with the                     like nuclear features and characteristically exhibit aggressive
pancreas as a major primary site. These neoplasms include a                   clinical behavior, frequent metastases, and poor survival (2).
number of distinct entities with widely differing etiologies,                 NECs may be pure or mixed with variable amounts of adeno-
clinical features, and morphologic and genomic findings.                      carcinoma, squamous cell carcinoma, or other components
   The World Health Organization (WHO) Classification of                      (ref. 3; Supplementary Fig. S1D).
Digestive System Tumours was recently updated (1). The                           Somatic mutations in pancreatic NETs (Panc-NET) have
highlight of this updated classification is a new distinc-                    been well characterized (4, 5). In contrast, little is known about
tion between well-differentiated neuroendocrine tumors                        molecular drivers of the neuroendocrine carcinoma of the gas-
(NET; Supplementary Fig. S1A) and poorly differentiated                       trointestinal system (GIS-NEC), for which few specimens have

1
 Department of Cancer Genome Informatics, Graduate School of Medicine,        Hepatobiliary and Pancreatic Oncology, National Cancer Center Hospital,
Osaka University, Osaka, Japan. 2Integrated Frontier Research for Medical     Tokyo, Japan. 18Department of Anatomical Pathology, Hiroshima Univer-
Science Division, Institute for Open and Transdisciplinary Research Initia-   sity Hospital, Hiroshima, Japan. 19Department of Investigative Pathology,
tives (OTRI), Osaka University, Osaka, Japan. 3Division of Genomic Medi-      Tohoku University Graduate School of Medicine, Miyagi, Japan. 20Project
cine, National Cancer Center Research Institute, Tokyo, Japan. 4Division      for Prevention of HPV-Related Cancer, Exploratory Oncology Research
of Cancer Genomics, National Cancer Center Research Institute, Tokyo,         and Clinical Trial Center, National Cancer Center, Chiba, Japan. 21Labora-
Japan. 5Sol Goldman Pancreatic Cancer Research Center, Department of          tory of Molecular Medicine, Human Genome Center, Institute of Medical
Pathology, Johns Hopkins Medical Institutions, Baltimore, Maryland. 6Sol      Science, The University of Tokyo, Tokyo, Japan.
Goldman Pancreatic Cancer Research Center, Department of Oncology,            Note: Supplementary data for this article are available at Cancer Discovery
Johns Hopkins Medical Institutions, Baltimore, Maryland. 7Department          Online (http://cancerdiscovery.aacrjournals.org/).
of Organoid Medicine, Keio University School of Medicine, Tokyo, Japan.
8
  Department of Surgery, Institute of Gastroenterology, Tokyo Women’s         S. Yachida, Y. Totoki, M. Noë, Y. Nakatani, and M. Horie contributed equally
Medical University, Tokyo, Japan. 9Second Department of Surgery, Wakay-       to this work.
ama Medical University, Wakayama, Japan. 10Department of Bioinformat-         Corresponding Author: Shinichi Yachida, Department of Cancer Genome
ics, National Cancer Center Research Institute, Tokyo, Japan. 11Department    Informatics, Graduate School of Medicine, Osaka University, 2-2 Yama-
of Diagnostic Pathology, National Cancer Center Hospital, Tokyo, Japan.       daoka, Suita, Osaka 565-0871, Japan. Phone: 81(6)6879-3360; Fax:
12
   Department of Hepatobiliary and Pancreatic Oncology, National Cancer       81(6)6879-3369; E-mail: syachida@cgi.med.osaka-u.ac.jp
Center Hospital East, Chiba, Japan. 13Department of Gastroenterological       Cancer Discov 2022;12:692–711
Surgery (Surgery II), Nagoya University Graduate School of Medicine,
Aichi, Japan. 14Department of Gastroenterological Surgery, Faculty of         doi: 10.1158/2159-8290.CD-21-0669
Medicine, Kagawa University, Kagawa, Japan. 15Department of Pathol-           This open access article is distributed under Creative Commons Attribution-
ogy, University Medical Center Utrecht, Utrecht University, Utrecht, the      NonCommercial-NoDerivatives License 4.0 International (CC BY-NC-ND).
Netherlands. 16Department of Surgery and Science, Faculty of Medicine,        ©2021 The Authors; Published by the American Association for Cancer Research
Academic Assembly, University of Toyama, Toyama, Japan. 17Department of

                                                                                                    MARCH 2022         CANCER DISCOVERY | 693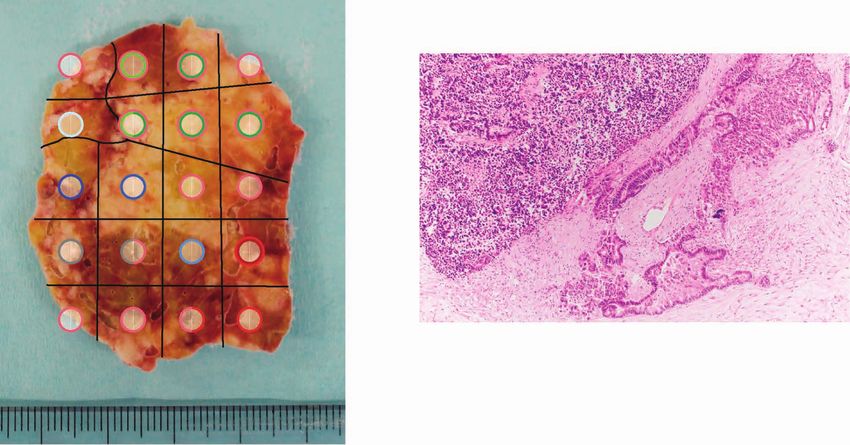
RESEARCH ARTICLE Yachida et al.
been available for analysis. We previously reported abnormal analysis, and/or Assay for Transposase Accessible Chromatin
immunolabeling of p53 and RB1 protein to be frequent in 19 sequencing (ATAC-seq) on 76 frozen samples including 4
pancreatic NECs (Panc-NEC; ref. 6). In the present study, tak- organoids (Supplementary Tables S4 and S5). Whole-exome
ing advantage of international collaboration, we conducted sequencing (WES) was also conducted on formalin-fixed and
a comprehensive genomic analysis of a relatively large series paraffin-embedded (FFPE) material from 56 cases (Supplemen-
of cases, the results implicating several previously unknown tary Table S6). We further examined the integration of virus
biological processes in the pathogenesis of neuroendocrine genomes previously reported to be associated with neuroen-
neoplasms of the gastrointestinal system (GIS-NEN). docrine carcinomas (Supplementary Table S7). To accurately
evaluate the frequency, distribution, and clonality of somatic
mutations, targeted gene sequencing was performed on 107
RESULTS
cases. This targeted sequencing provided deeper read coverage
Clinicopathologic Features of GIS-NENs for 78 genes with recurrent mutations identified in WGS/WES,
An international cohort of 114 clinically and pathologi- or for examples selected as being identified as driver genes in a
cally well-characterized GIS-NEN cases (115 independent previous report (ref. 5; Supplementary Tables S8–S10). An onco-
lesions), comprising 79 from Japan, 23 from the United plot based on targeted gene sequencing is shown in Supplemen-
States, and 12 from the Netherlands, underwent broad analy- tary Fig. S4. Significantly mutated genes (SMG) in GIS-NECs
ses. Included were 60 GIS-NECs (18 pancreatic, 14 gastric, 10 (Supplementary Table S11) and GIS-NETs (Supplementary
Downloaded from http://aacrjournals.org/cancerdiscovery/article-pdf/12/3/692/3052812/692.pdf by guest on 11 May 2022
biliary, 9 colorectal, 6 ampullary, and 3 esophageal) and 55 Table S12) were investigated by WGS and/or WES and validated
GIS-NETs (48 pancreatic, 6 colorectal, and 1 nonampullary by targeted gene sequencing. The median numbers of nonsyn-
duodenal). Of note, two (cases NE067 and NE115) of nine onymous mutations in GIS-NECs and GIS-NETs were 60 and
patients with colorectal NEC suffered from inflammatory 10.5, respectively. The SMGs in GIS-NECs are TP53, KRAS, RB1,
bowel disease (i.e., ulcerative colitis), one for 20 years and the CCNE1, CDKN2A, and MYC. KRAS gene alterations were mainly
other for 18 years (Supplementary Table S1). detected in Panc-NECs, APC in colorectal NECs, and ELF3 in
Pathologic diagnosis was based on criteria of the 2019 ampullary (7) and biliary tract NECs (8). Thus, driver mutations
WHO classification of digestive system tumors. A flow chart initially detected in conventional carcinomas in each body site
for the entire analysis is provided in Supplementary Fig. S2. were found to be to a large extent organ-specific. Recurrent
Clinicopathologic features are detailed in Supplementary mutations in noncoding DNA regions were not observed.
Tables S1–S3. The age of patients with Panc-NECs was sig-
nificantly greater than the age of patients with Panc-NETs Structural Variation in GIS-NECs
(Supplementary Table S3). Differences were noted at the genomic level between Panc-
Kaplan–Meier analyses and log-rank tests were performed NECs and Nonpanc-NECs (Fig. 1), the number of struc-
to determine relationships between clinicopathologic features tural variations (SV) being significantly larger in the latter
and five-year disease-specific survival rates (Supplementary (P = 3.82 × 10⁻⁹; Fig. 1; Supplementary Table S13). We iden-
Fig. S3A–S3D). Patients with GIS-NECs had significantly worse tified loci frequently affected by SVs by counting break-
outcomes than did patients with GIS-NETs (P = 4.32 × 10⁻¹⁵). points within 1 Mb windows genome-wide (Supplementary
In addition, patients with Panc-NECs had poorer five-year Fig. S5A and S5B). Loci characteristically affected contained
disease-specific survival than patients with nonpancreatic the PTPRD gene in Panc-NECs as with pancreatic ductal
GIS-NECs (Nonpanc-NEC; P = 0.0382). There was also a adenocarcinoma (PDAC; ref. 9) and Panc-NET (5). SMAD4
significant difference in survival between patients with GIS- and CDKN2A, which are frequently targeted for SV in PDAC,
NETG3 and patients with GIS-NETG1/G2 (P = 0.00309). were not found to be targeted in Panc-NECs. In Nonpanc-
NECs, recurrent SV-affected genes listed in the COSMIC
Significantly Mutated Genes in GIS-NECs Cancer Gene Census were CLTC, TCF, NOTCH1, CREBBP,
We performed whole-genome sequencing (WGS), transcrip and ZNFR3, in descending order of prevalence. We identi-
tome sequencing [RNA sequencing (RNA-seq)], DNA methylation fied whole-genome duplication (WGD) in 17 (33.4%) of 51
Figure 1. Genomic alterations of GIS-NECs. A, Landscape of genomic alterations in GIS-NEC cases. The left oncoplot indicates WGS data, and
representative gene expression data are obtained from frozen samples. The cases are arranged from left to right according to descending order of the
number of SVs in each primary organ. Asterisks, organoid samples. The right oncoplot shows WES data in patients differing from patients available on
the WGS data. B, Hematoxylin and eosin (H&E) staining and synaptophysin immunolabeling of TP53 and RB1 double knockout (TR-KO) organoids before
and after blocking Notch signaling with a γ-secretase inhibitor (DAPT). The synaptophysin-positive cells were increased by the Notch inhibitor. Scale
bar, 100 μm. C, Unsupervised hierarchical cluster analysis with 2,000 high variant probes for DNA methylation in GIS-NECs. D, Integration of RNA-seq
and DNA methylation array data comparing GIS-NECs with normal tissues. RNA-seq data were filtered using significant differentially expressed gene
(DEG; abs [log2FC] ≥ 1) with significant FDR values (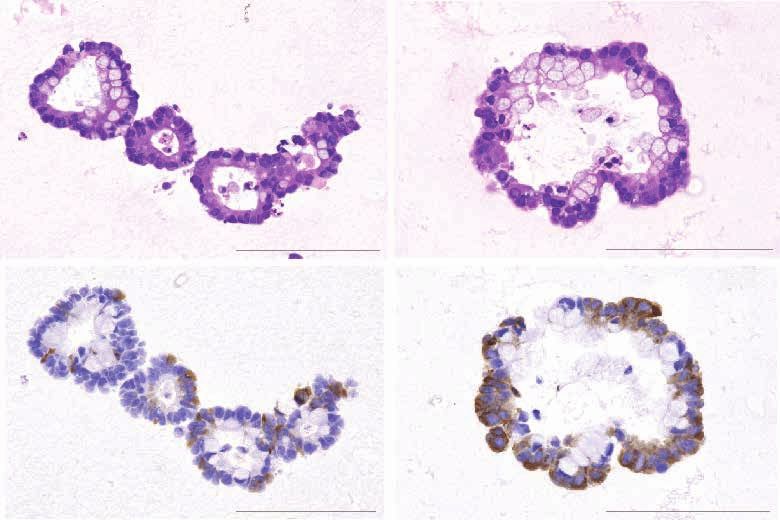
Comprehensive Genomic Profiling of NECs of the Gastrointestinal System RESEARCH ARTICLE
A WGS WES SV type
Deletion
No. of SV
800 Inversion
600 Panc-NEC Nonpanc-NEC Tandem duplication
Translocation
400 * *
200 * * Gender
0
Panc-NEC Nonpanc-NEC Female
Male
1
Ratio
0.5 Tumor purity Race
0 Asian
Gender African-American
Caucasian
Race
LN metastasis Lymph node metastasis
(LN metastasis)
Primary organ Yes
RB1 protein No
TP53
Primary organ
KRAS Pancreatic NEC
RB1 Gastric NEC
CDKN2A Esophageal NEC
Colorectal NEC
MYC Ampullary NEC
CCNE1 Biliary NEC
ARID1A RB1 protein
SMAD4 Loss
APC Partially positive
Intact
ELF3 N/A
PTEN
ERBB3 Alterations
Missense non-hotspot mutation
DCAF11 Missense hotspot mutation
Inframe indel
Downloaded from http://aacrjournals.org/cancerdiscovery/article-pdf/12/3/692/3052812/692.pdf by guest on 11 May 2022
N4BP2L2
Inactivating mutation
SERPINI1
Tandem duplication
NET1
Tandem duplication (inactivated)
NOTCH1
Deletion
NOTCH2 Translocation
NOTCH3 Inversion
SOX2 20 Homozygous deletion
Amplification
PTF1A
RNA−seq Alternative splicing
POU2F3 0 (TPM) Fusion
B D
OTX2
–DAPT +DAPT
ASCL1
10
SOX2
Log2FC (NEC/normal)
H&E
CHGA
PAX9
SHOX2
5
MYT1
TBX15
Synaptophysin
0
−5
TF
Non-TF
C −0.4 −0.2 0.0 0.2 0.4
Race
Race
value (NEC − normal)
LN metastasis Asian
Primary organ African-American
Methylation cluster Caucasian
Lymph node metastasis
(LN metastasis)
Yes
No
Primary organ
Pancreatic NEC
E F 1
Gastric NEC
AKR1C3 NET1 2
100
VP2
200
50
150
0
NLS
VP
Esophageal NEC PDZ
0
0
50
3
10
Colorectal NEC
0
VP
15
0
3
20
Ampullay NEC DH PH
1
V
0
50
y
0
Biliary NEC
CP
10
0
15
M
0
Methylation cluster
4
50
Larg 10
0
eT
Methyl-C1
0
NET1 Exon 1–3 3
AKR1C3 Exon 2–9 5
anti 15
gen
Methyl-C2 Smal
0
50
Methyl-C3
NET1–AKR1C3 (380 aa)
5
l T an 100
tigen
Large T 150
antigen
value 0
0
50
6
100
0 1
150
DNMT3A 0
DNMT1
50
50
Missense 100
7
Y
AKR1C4 NET1
0
TET3
150
NLS
150
Deletion PDZ 100
0
TET2 Inversion
50
50
X
10
0 0
TET1 N/A
8
DH PH 50
0 50
0
22
p16(CDKN2A) 0
50
10
0
21
9
0
0
MLH1
50
50
20
19
10
0
10
0
50
0
NET1 Exon 1–3 3
AKR1C4 Exon 6–9 5
50
0
18
10
50
0
0
11
0
50
17
50
100
0
100
0
50
50
Normal pancreas
100
50
0
100
0
NET1–AKR1C4 (218 aa) 16
15 14 13
12
MARCH 2022 CANCER DISCOVERY | 695
RESEARCH ARTICLE                                                                                                  Yachida et al.

GIS-NECs (Supplementary Table S14). To determine chro-            indicate that inactivation mechanisms of RB1 may be differ-
mothripsis presence, we applied ShatterSeek (10) to 57 GIS-       ent between small-cell and large-cell GIS-NECs.
NENs (35 GIS-NECs and 22 GIS-NETs), with positive results
in 14 of the 35 (40.0%) GIS-NECs (Supplementary Table S15).       DNA Methylation Status and Transcriptome
Of these 14, 12 (85.8%) harbored TP53 mutations statistically     Profiling of GIS-NECs
significantly (P = 0.0320) as compared with the prevalence           Unsupervised hierarchical cluster analysis of methylation
of only 10 of 21 GIS-NECs without chromothripsis. This            status divided GIS-NECs into three groups (Fig. 1C). The
result is in agreement with previous findings for other types     third group (Methyl-C3) consisted mainly of Panc-NECs
of neoplasm (11, 12). Recurrent chromothripsis involving          and the second group (Methyl-C2) mostly of Nonpanc-
chromosome 11 was detected in four GIS-NECs (Supplemen-           NECs. The remaining cluster (Methyl-C1) featured a CpG
tary Fig. S5C). In contrast, GIS-NETs were not found to har-      island methylator phenotype (CIMP) status due to alter-
bor regions of chromothripsis. Although chromothripsis has        ations of DNA methylation–related genes and/or MLH1
been associated with a poor prognosis, fusion genes created       promoter hypermethylation. The microsatellite instability
by chromosome shattering may have therapeutic potential           (MSI) scores using MSIsensor-pro (17) were significantly
for GIS-NECs with this feature (13).                              higher (P = 0.00794) in Methyl-C1 (median, 0.91) than in
                                                                  Methyl-C2 and Methyl-C3 (median, 0.09) cases.
Genomic Distinction between Panc-NECs and                            Transcriptome analysis confirmed overexpression of tran-
Nonpanc-NECs

                                                                                                                                   Downloaded from http://aacrjournals.org/cancerdiscovery/article-pdf/12/3/692/3052812/692.pdf by guest on 11 May 2022
                                                                  scription factors for neuroendocrine differentiation (NE-
   The number of nonsynonymous mutations was sig-                 TF), especially SOX2, in GIS-NECs (Fig. 1A; Supplementary
nificantly larger in Nonpanc-NECs than in Panc-NECs               Fig. S8A–S8C). Interestingly, overexpression of SOX2 and
(P = 0.00238). Loss of RB1 protein and TP53 mutations             other NE-TFs (e.g., ASCL1) was regulated by hypermethyla-
proved prevalent in both. In Nonpanc-NECs with intact             tion of the promoter regions of these genes, rather than by
RB1, CCNE1 and MYC amplification was a mutually exclu-            hypomethylation of the promoter (Fig. 1D; Supplementary
sive event. In addition, alterations of Notch family genes        Fig. S9A). Gene expression of SOX2 was strongly correlated
were frequently detected in Nonpanc-NECs (12/23, 52.1%;           (ρ = 0.620, P = 2.40 × 10⁻⁹) with DNA methylation sta-
Fig. 1A; Supplementary Fig. S5A), in contrast to their relative   tus of that gene’s promoter (Supplementary Fig. S9B and
paucity in conventional gastrointestinal adenocarcinomas          S9C). Furthermore, in GIS-NECs with increased expression
(14). Notch family genes are known to act as tumor suppres-       of SOX2, ATAC-seq demonstrated an open chromatin status
sors and master regulators of neuroendocrine differentia-         in the region surrounding the SOX2 gene (Supplementary
tion in pulmonary NEC, i.e., small-cell lung cancer (SCLC;        Fig. S9D).
ref. 15). In contrast to Nonpanc-NECs, Panc-NECs lacked
any SV of Notch family genes except for one organoid,             NET1–AKR1C3/4 Fusion
which demonstrated an unstable SV phenotype (>200 SVs;               A recurrent novel fusion gene, NET1–AKR1C3/4, was found
Fig. 1A). No significant differences in lymph node metasta-       in two gastric NECs [2/60 (3.3%) GIS-NECs; Fig. 1E]. The
sis, tumor purity, age, and race were evident between Panc-       neuroepithelioma transforming gene 1 (NET1) is a specific
NECs and Nonpanc-NECs.                                            guanine nucleotide exchange factor (GEF) for RhoA. Aldo-
   To determine the effect of dysregulation of Notch signal-      keto reductase family 1 members C3 (AKR1C3) and C4
ing in TP53- and RB1-deficient cells, we tested whether block-    (AKR1C4) are both reductase enzymes that play critical roles
age with a γ-secretase inhibitor would alter the expression of    in biotransformation of substrates such as steroids. The chi-
synaptophysin in TP53 and RB1 double knockout (TR-KO)             meric genes featured in-frame fusion of the NET1 amino ter-
organoids, generated from normal colon epithelium using           minus (exons 1–3) and the AKR1C3 carboxyl terminus (exons
CRISPR/Cas9 (16). These TR-KO cells had increased synap-          2–9) or the AKR1C4 carboxyl terminus (exons 8–11; Fig. 1E;
tophysin levels after administration of the γ-secretase inhibi-   Supplementary Fig. S10A). The same exons of the NET1 gene
tor (Fig. 1B and Supplementary Text). In TP53 KO gastric          were fused with AKR1C, which harbors nuclear localization
organoids, the same phenomenon was also observed (Sup-            signals without enzymatic activity of Rho GEFs. To assess the
plementary Fig. S6).                                              function of this fusion, an immortalized normal epithelial
                                                                  cell line of gastric fundus origin (HFundEC4N) expressing
Genomic Distinction between Small-Cell Type                       NET1–AKR fusion proteins was established, and RNA-seq of
GIS-NECs, Large-Cell Type GIS-NECs, and Mixed                     NET1–AKR1C3 and NET1–AKR1C4 fusion gene–expressing
Neuroendocrine–Nonneuroendocrine Neoplasms                        cells was performed (see Supplementary Text and Supple-
   Genetic differences based on morphologic subclassifica-        mentary Fig. S10B–S10D). Analysis of upregulated genes
tion of GIS-NECs were investigated. Regarding frequently          showed that pathways related to cell-cycle regulation were
altered genes, targeted deep sequence data, derived from both     top ranked in both NET1–AKR1C3 and NET1–AKR1C4–
frozen and FFPE samples, showed RB1 gene mutations to be          expressing cells, but neuroendocrine markers [e.g., SYP (syn-
significantly more prevalent in small-cell than in large-cell     aptophysin), CHGA (chromogranin A), and NCAM1] were
type GIS-NECs (P = 0.00513) and mixed neuroendocrine–             not increased (Supplementary Fig. S10B). Recently, the Pan-
nonneuroendocrine neoplasms (MiNEN; P = 0.0239; Supple-           Cancer Analysis of Whole Genomes (PCAWG) Consortium of
mentary Fig. S7A). However, WGS data, derived solely from         the International Cancer Genome Consortium (ICGC) and
frozen samples, demonstrated SVs in the RB1 gene in large-        The Cancer Genome Atlas (TCGA) identified AKR1C genes as
cell type GIS-NECs (Supplementary Fig. S7B). These findings       novel structural-variant driver candidates (18).

696 | CANCER DISCOVERY        MARCH 2022                                                                     AACRJournals.org
Comprehensive Genomic Profiling of NECs of the Gastrointestinal System RESEARCH ARTICLE
Nonpanc-NECs Caused by Virus Infection showed RB1 protein loss and TP53 mutations, and gener-
Case NE002, a gastric NEC with Merkel cell polyomavirus ally CIMP (Fig. 2B). In the second Panc-NEC group and one
(MCPyV), appeared to be caused by monoclonal integra- gastric NEC (NE020) lacking KRAS mutation, the PTF1A
tion of MCPyV (Supplementary Text and Supplementary gene, a marker of acinar cell differentiation (28), was mostly
Fig. S11A–S11H). Merkel cell carcinoma is a highly aggressive overexpressed. However, IHC staining for acinar cell mark-
neuroendocrine carcinoma of the skin whose main etiologic ers (trypsin, chymotrypsin, and BCL10) was negative except
agent is MCPyV, detected in 80% of cases (19). A complete for the case of one mixed acinar–neuroendocrine carcinoma
and accurate examination of the skin of the patient revealed (NE051), in which trypsin, chymotrypsin, and BCL10 were
no suspicious lesions. The MCPyV large T antigen directly found to be partially positive (Supplementary Table S16).
binds to and inactivates RB1 (20), and MCPyV integration The “acinar-type Panc-NEC” featured altered WNT sig
was found in an intron of the CNGB3 gene on chromosome naling (e.g., mutations of APC and CTNNB1 genes) and
8q21 (Fig. 1F). The patient had regularly taken steroids for characteristically alterations of CDKN2A (i.e., homozygous
polymyalgia rheumatica, suggesting a state of chronic drug- deletion, large deletion, or promoter hypermethylation;
induced immune suppression. Fig. 2A) and overexpression of transcription factors, such as
Recently, a significant subset of rectal and anal NEC was PTF1A, GATA4, NR5A2, and RBPJL (Fig. 2B). Of note, hot-
concluded to be driven by high-risk human papillomavi- spot mutations of DCAF11 [c.714G>T: NE016, tumor vari-
rus infection, without genomic alteration in RB1, TP53, or ant allele frequency (TVAF) = 0.511; NE051, TVAF = 0.400]
Downloaded from http://aacrjournals.org/cancerdiscovery/article-pdf/12/3/692/3052812/692.pdf by guest on 11 May 2022
CCNE1 (21). In the present study, case NE066 with a rectal and hemizygous loss of chromosomes 3 and 4 were observed
NEC showing intact RB1 and p53 and no amplification of in all cases in this group (Supplementary Tables S4 and
CCNE1/MYC proved positive for high-risk human papillo- S14). It was found that Panc-NEC patients whose tumors
mavirus (HPV-18). The patient had regularly taken Famci- were KRAS wild-type had a significantly (P = 0.00279) better
clovir for herpes simplex virus infection, which suggests an prognosis than their counterparts with tumors that har-
immunocompromised state. bored KRAS mutations (Supplementary Fig. S3D).
Deleterious germline variants in the PALB2 gene have
Nonpanc-NECs Expressing Tuft Cell been reported in 3% to 4% of familial PDAC cases (29). Here
Lineage Markers we identified a deleterious germline mutation (frameshift
Three GIS-NECs (colon, NE030; esophagus, NE055; stom- deletion) of PALB2 in one patient (NE103) with Panc-NEC
ach, NE023) exhibited high expression of POU2F3 (Fig. 1A; (small-cell type) at 30 years of age harboring somatic loss
Supplementary Fig. S8A), recently recognized as one of of heterozygosity (LOH) of the PALB2 wild-type allele (Sup-
four key transcriptional regulators (i.e., ASCL1, NEUROD1, plementary Table S17). In addition, a pathogenic germline
POU2F3, and YAP1) distinguishing biological subtypes of variant of MAD1L1 was identified in one Panc-NEC (NE071).
SCLC and a marker of the tuft cell lineage (22). Tuft cells have We also detected pathogenic germline variants in VHL (n = 2),
been identified in not only the lung (23) but also the gastroin- APC (n = 1), FANCG (n = 1), and EPHB2 (n = 1) in patients with
testinal tract (24), suggesting that they might act as a cell of GIS-NETs (Supplementary Table S17).
origin for a proportion of Nonpanc-NECs.
Genomic Features of Panc-NETs Based on RNA-seq
LINE1-MET Chimeric Transcript Two driver genes (i.e., MEN1 and DAXX) were significantly
In most GIS-NECs (74.3%, 26/35) but not present in GIS- (FDR-corrected P < 0.1) mutated in the 55 GIS-NETs (Supple-
NETs (0%, 0/30), LINE1-MET chimeric transcripts could be mentary Table S12). The MEN1 gene was frequently included
identified, presumably due to demethylation of the long in SV in Panc-NETs (Supplementary Fig. S5A). One patho-
interspersed nuclear element (LINE1) antisense promoter genic germline large deletion (NE042) resulted in a novel
(ref. 25; Supplementary Fig. S12A–S12C). LINE1-MET chi- ATG2A–MEN1 fusion transcript (Supplementary Fig. S13A
meric transcripts have been reported in some cancers, espe- and S13B). This patient (23-year-old female) with the germ
cially aggressive tumor subtypes (26). line large deletion had a family history (father, parathy-
roid tumor; brother, pituitary tumor) consistent with MEN1
“Ductal-Type Panc-NEC” and “Acinar-Type syndrome (Supplementary Table S1). Most Panc-NETG3s
Panc-NEC” harbored alterations of driver genes (e.g., TP53 mutation,
A focus on genomic distinction between Panc-NECs and CDKN2A hypermethylation) in addition to MEN1 mutations
Panc-NETs (Fig. 2) revealed significantly higher SV num- (Fig. 2A and C).
bers in the former (P = 3.82 × 10⁻⁹; Fig. 2A). Panc-NECs The Panc-NETs were roughly divided into three clusters
were classified into two groups based on multiomics data based on RNA-seq data. In RNA cluster 5 (C5 in Fig. 2B), ARX
(Fig. 2A and B), the first group featuring high expression of was overexpressed and the MEN1 gene was characteristically
pancreatic ductal lineage markers (e.g., SPP1 and CFTR) and inactivated (30). RNA cluster 3 (C3 in Fig. 2B) showed high
harboring KRAS mutations. In this “ductal-type Panc-NEC,” expression of PDX1. The remaining cluster (C4 in Fig. 2B)
transcription factors, such as SOX2, ASCL1, NKX2-1, EZH2, featured high expression of both ARX and PDX1. Of note,
and E2F1, were characteristically overexpressed (Fig. 2B; increased expression of immune checkpoint molecules was
Supplementary Fig. S8A). Unlike PDAC (27), loss of p16 and found in C4. All Panc-NETG3s belonged to the ARX-high
SMAD4 protein immunolabeling was rare (Supplementary groups (C4 or C5).
Table S16), indicating a pathway to progression different Clinically, the Panc-NETs analyzed in this study were
from PDAC development. Most “ductal-type Panc-NEC” diagnosed as nonfunctional tumors. We nevertheless
MARCH 2022 CANCER DISCOVERY | 697RESEARCH ARTICLE Yachida et al.
A
WGS WES SV type
Deletion
250 * Inversion
200 Tandem duplication
Panc-NEC Panc-NET
No. of SV
150
100
Translocation
50
0 Panc-NEC Panc-NET Gender
1 Female
** Male
Ratio
0.5
Tumor purity
0
Race
Gender
Race Asian
African-American
LN metastasis Caucasian
Histology
RB1 protein Lymph node metastasis
TP53 (LN metastasis)
KRAS Yes
No
RB1 N/A
ARID1A
Histology
CDKN2A
NEC
SMAD4 NETG3
DCAF11 NETG2
APC NETG1
BRAF
RB1 protein
CTNNB1 Loss
MET Intact
MEN1 N/A
DAXX Alterations
DEPDC5 Missense non-hotspot mutation
ATRX Missense hotspot mutation
KMT2D Inframe indel
TSC2 Inactivating mutation
VHL Tandem duplication
Downloaded from http://aacrjournals.org/cancerdiscovery/article-pdf/12/3/692/3052812/692.pdf by guest on 11 May 2022
KMT2A Deletion
KMT2C Translocation
RRBP1 Homozygous deletion
PIK3CA Alternative splicing
YY1 Fusion
B C
Race Race Race Race
LN metastasis Asian LN metastasis Asian
Histology African-American Histology African-American
KRAS Caucasian MEN1 Caucasian
MEN1 Lymph node metastasis RNA-Cluster
CIMP Lymph node metastasis
(LN metastasis) (LN metastasis)
Yes
PTF1A
No Yes
GATA4 No
NR5A2 N/A
RBPJL N/A
EZH2
SOX2 Histology
E2F1 Histology
NKX2−1
ASCL1
NEC NEC
NETG3 NETG3
NETG2 NETG2
NETG1 NETG1
FOS
FOSB
MEN1/KRAS status MEN1 status
Altered Altered
Intact Intact
PDX1
N/A N/A
ISL1
RFX6
RNA cluster
NEUROD1 CIMP RNA-C1
NKX2−2 RNA-C2
HNF1A
HNF4A 0 0.2 0.4 RNA-C3
ARX
RNA-C4
RNA-C5
SOX2
ASCL1
NKX2−1
PTF1A
PDX1 value
ARX
HNF4A
CFTR 0 1
SPP1
LAG3
CD274
CTLA4 p16 (CDKN2A)
PDCD1 RASSF1
TNFRSF9
BTLA DAXX
IDO1 TERT (promoter)
HAVCR2
TNFRSF4 TERT (gene body)
Z-score Normal
RNA-C1 RNA-C2 RNA-C3 RNA-C4 RNA-C5
Ductal NEC Acinar NEC MEN1 WT MEN1 WT MEN1 inactivated
Methyl-C1 Methyl-C2 Methyl-C3 pancreas
SOX2-high PTF1A-high PDX1-high ARX/PDX1-high ARX-high NET
−2 0 2
ICM low ICM high
D Pancreatic NET
NEC NET
Pancreatic NEC
NE042
0
NE032
32
(ductal-type)
1,000
0
NE045
N NE038
E NE004
N
SOX2
NE021
NE0
NE 021
NE024
N
ASCL1 10
0
PC2 (13.08%)
NE005
NEUROD1
NE052
5 5
NE029
2 POU2F3
−1,000 0
RBPJ
RARA −5
−2,000 −10
RFX3
Pancreatic NEC
PDX1 Pancreatic NEC (acinar-type)
(acinar-type) Pancreatic NEC (ductal-type)
−3,000 HNF4A
NE033
E Pancreatic NET
3
4
5
9
1
4
2
2
5
8
2
03
00
00
02
02
02
05
03
04
03
04
−4,000 −2,000 0 2,000
NE
NE
NE
NE
NE
NE
NE
NE
NE
NE
NE
PC1 (42.97%)
Figure 2. Genomic alterations of Panc-NECs and Panc-NETs. A, Landscape of genomic alterations in Panc-NECs and Panc-NETs. The left oncoplot
indicates WGS data obtained from frozen samples. The cases are arranged from left to right according to descending order in the number of SV in each
pancreatic neuroendocrine neoplasm based on WHO classification 2019. The right oncoplot shows WES data differing from patients available on the
WGS data. Asterisk, organoid sample; double asterisk, a case for which tumor purity was not calculated due to the limited number of mutations. B, Unsu-
pervised clustering analysis using gene expression of high variant 160 TFs. The expression of representative TFs specific to each cluster and immune
checkpoint molecules is shown at the bottom. C, Unsupervised clustering of the methylation levels with 2,000 high variant CpG probes in Panc-NECs
and Panc-NETs. D, Principal component analysis, based on reads of distal elements by ATAC-seq, could clearly discriminate between Panc-NETs (green),
acinar-type Panc-NECs (blue, NE033), and ductal-type Panc-NECs (red). Motif enrichment analysis could also clearly discriminate between Panc-NETs
(subgroups: PDX1-high and HNF4A-high), acinar-type Panc-NECs, and ductal-type Panc-NECs.
698 | CANCER DISCOVERY MARCH 2022 AACRJournals.orgComprehensive Genomic Profiling of NECs of the Gastrointestinal System RESEARCH ARTICLE
Tumor purity
N/A
Lymph node metastasis
LN metastasis (LN metastasis)
Race Yes
VHL
No
MEN1
N/A
WGD
22 Race
21 Asian
20 African American
19 Caucasian
18
17 Genomic status
16 Alterations in MEN1
15 WGD
14 Chromosome-scale LOH
13
12 Histology
11 Panc-NETG1
10 Panc-NETG2
9 Panc-NETG3
8 Panc-NEC
7
6 Group
5 Group 1 (LOH)
4 Group 2 (LOH followed by WGD)
3 Group 3 (LOH of chr11)
Downloaded from http://aacrjournals.org/cancerdiscovery/article-pdf/12/3/692/3052812/692.pdf by guest on 11 May 2022
2 Group 4 (LOH of chr3)
1 Group 5 (few LOH chromosomes)
Histology Group 6 (no LOH chromosomes)
Group Group 7 (NEC)
Figure 3. Landscape of DNA copy-number alterations in Panc-NETs and Panc-NECs. Examination of the chromosome-level copy number allowed strat-
ification into six groups in Panc-NETs. Group 1: recurrent pattern of whole chromosomal loss, affecting specific chromosomes (1, 2, 3, 6, 8, 10, 11, 15, 16,
21, and 22); group 2: recurrent pattern of whole chromosomal loss, affecting specific chromosomes and subsequent WGD; group 3, chromosome-scale
LOH to chromosome 11; group 4, chromosome-scale LOH to chromosome 3; group 5, chromosome-scale LOH to nonspecific one or two chromosome(s);
group 6, no chromosome-scale LOH. Chromosomes 1–22 are depicted from bottom to top, and individual samples are shown from left to right. Pink
indicates chromosome-scale LOH.
comprehensively investigated the expression of 94 neuro- TET3, methylation erasers, and UHRF1 and DNMT1, meth-
peptides listed in the neuropeptide database (http://www. ylation maintainers, was significantly higher in Methyl-C1
neuropeptides.nl/) and TPH1 and selected 27 high variant mostly consisting of NECs than that in Methyl-C2 and/or C3
neuropeptides and TPH1 [standard deviation of transcripts (Supplementary Fig. S15B).
per million (TPM) > 3.0 among Panc-NETs] for further analy-
sis (Supplementary Fig. S14). Unexpectedly, expressed neu- ATAC-seq in Panc-NECs and Panc-NETs
ropeptides included neuropeptides not normally produced We performed ATAC-seq for seven Panc-NECs and four
in the pancreas. In addition, we found that Panc-NETs with Panc-NETs (Fig. 2D; Supplementary Fig. S16). Principal com-
high-level expression of gamma cell–specific, delta cell–specific, ponent analysis (PCA) of chromatin accessibility at distal
and epsilon cell–specific hormones in addition to alpha and elements (n = 191,422) revealed distinct clusters (Fig. 2D).
beta cell–specific were present. Motif enrichment analysis of transcription factors showed
that the SOX2 and/or ASCL1 motif was enriched in “ductal-
DNA Methylation Status in Panc-NECs type Panc-NECs” and the RBPJ and RARA were enriched in
and Panc-NETs the “acinar-type Panc-NEC.” Regarding four Panc-NETs, the
Cluster analysis of DNA methylation results stratified pan- RFX3 motif was enriched in all, but the enrichment of two
creatic NENs into three subgroups (Fig. 2C). First, Panc- motifs, PDX1 (NE042 and NE038, Methyl-C3 in Fig. 2C)
NECs and Panc-NETs branched. Second, Panc-NETs were and HNF4A (NE032 and NE045, Methyl-C2 in Fig. 2C), were
classified into two clusters. The classification of Panc-NETs mutually exclusive.
based on epigenomes generally resembled that of transcrip-
tomes (Fig. 2B and C). DAXX hypermethylation was found Genome-Wide LOH and Subsequent
in almost all of Panc-NETs (Fig. 2C). Hypermethylation of WGD in Panc-NETs
CDKN2A was evident in 3 of 7 Panc-NETG3s, compared with Striking genome-wide LOH that affected nearly half their
2 of 23 Panc-NETG1/G2s (P = 0.0332; Fig. 2C). The two clus- chromosomes was observed in 17 of 43 (39.6%) Panc-NETs
ters of Panc-NETs were strongly linked with MEN1 findings. (13 NETG1s, 20 NETG2s, and 10 NETG3s) that underwent
Methylation cluster 2 (Methyl-C2) harboring MEN1 altera- WGS and/or WES (Fig. 3). The most common targets of hap-
tions showed greater hypermethylation of RASSF1, PDX1, and loidy were chromosomes 1, 2, 3, 6, 8, 10, 11, 15, 16, 21, and 22,
CDX2 and hypomethylation of HNF4A and 18 genes listed in generally in accord with the previous report (5, 31). In these
the COSMIC Cancer Gene Census (e.g., MGMT and TERT), patients, MEN1 alterations (mutations and/or SVs) were fre-
as compared with methylation cluster 3 (Methyl-C3; Supple- quently observed (11/17, 64.7%). Of interest, in nearly half
mentary Fig. S15A). A focus on DNA methylation modifiers of Panc-NETs (9/17, 53.0%) with genome-wide LOH, WGD
from RNA-seq data showed that the expression of IDH2 and occurred after the LOH (Fig. 3; Supplementary Table S14).
MARCH 2022 CANCER DISCOVERY | 699RESEARCH ARTICLE Yachida et al.
SBS1 (0.97)
SBS17a (0.79)
Spontaneous
Unknown
deamination of
5-methylcytosine
(clock-like)
SBS2 (0.90) SBS17 30 18 1 6 31 3 2 16 5
Activity of SBS17b (0.97)
024-Pan-NEC (platinum)
Unknown
016-Pan-NEC (acinar)
051-Pan-NEC (acinar)
033-Pan-NEC (acinar)
002-Sto-NEC (merkel)
029-Pan-NEC (ductal)
021-Pan-NEC (ductal)
005-Pan-NEC (ductal)
004-Pan-NEC (ductal)
007-Pan-NEC (ductal)
APOBEC
020-Sto-NEC (acinar)
family of
032-Pan-NETG3
013-Pan-NETG2
043-Pan-NETG1
038-Pan-NETG1
047-Pan-NETG2
040-Pan-NETG2
010-Pan-NETG2
044-Pan-NETG2
042-Pan-NETG2
046-Pan-NETG1
050-Pan-NETG3
034-Pan-NETG3
011-Pan-NETG1
025-Pan-NETG2
037-Pan-NETG3
048-Pan-NETG1
049-Pan-NETG2
039-Pan-NETG2
045-Pan-NETG2
012-Pan-NETG2
041-Pan-NETG2
036-Pan-NETG3
031-Pan-NETG3
cytidine
006-Amp-NEC
003-Amp-NEC
027-Eso-NEC
deaminases
028-Eso-NEC
018-Sto-NEC
026-Sto-NEC
015-Sto-NEC
023-Sto-NEC
022-Sto-NEC
019-Sto-NEC
014-Sto-NEC
035-Col-NEC
030-Col-NEC
009-Sto-NEC
001-Sto-NEC
017-Bil-NEC
SBS3 (0.85) SBS18 (0.95)
Defective homologous Damage by reactive oxygen species 0%
recombination DNA-damage repair
20%
40%
60%
SBS30 (0.84) 80%
SBS5 (0.86) Defective DNA
Unknown base excision 100%
(clock-like) repair due to 0
NTHL1 mutation
10,000
SBS31 (0.99)
Downloaded from http://aacrjournals.org/cancerdiscovery/article-pdf/12/3/692/3052812/692.pdf by guest on 11 May 2022
The number of mutations
SBS6 (0.86)
Platinum
Defective DNA mismatch repair
chemotherapy
20,000
treatment
30,000
SBS16 (0.87) SBS35 (0.84)
Unknown Platinum chemotherapy treatment
40,000
SBS1 SBS2 SBS3 SBS5
SBS6 SBS16 SBS17a SBS17b
SBS18 SBS30 SBS31 SBS35
50,000
Figure 4. Mutational signature analysis of GIS-NENs. Hierarchical clustering by de novo extraction of mutational signatures with nonnegative matrix
factorization of available WGS data. Stability plotting indicated 12 mutational signatures (>0.85; Supplementary Fig. S18). Their profiles and functions
were assigned based on COSMIC SBS Signatures (v3.1). Sto, stomach; Eso, esophagus, Col, colorectum; Pan, pancreas; Amp, ampullary; Bil, bile duct;
Platinum, platinum chemotherapy treatment; Merkel, gastric NEC with Merkel cell polyomavirus. The parentheses in the left figure indicate cosine simi-
larity to COSMIC signatures.
Sawicki and colleagues (32) recently reported that menin, knockdown of the SNRNP70 gene dramatically induced signif-
which is encoded by the MEN1 gene, during early mitosis is icant alternative splicing events in the HepG2 cell line (ref. 34;
localized to the mitotic spindle poles and to the mitotic spin- Supplementary Fig. S17E), suggesting that inactivation of
dle, and during cytokinesis to the intercellular bridge micro- RB1 in NE005 might be caused by such a novel splicing event.
tubules. Menin depletion has the following effects: during
early mitosis, defects in spindle assembly and chromosome Mutational Signatures in GIS-NENs
congression; during anaphase, lagging chromosomes; and De novo extraction of mutational signatures by nonnegative
defective cytokinesis. We discovered a novel group of Panc- matrix factorization (NMF) analysis using WGS data defined
NETs with loss of one copy in entire chromosome 3, in addi- 12 robust mutational signatures (Supplementary Fig. S18),
tion to a group with loss of one copy in entire chromosome in accord with any of the Cosmic Single Base Substitution
11 as previously reported (5), which were mutually exclusive (SBS) Signatures (v3.1; Fig. 4). SCLC is a representative
in nearly one third of the Panc-NETs (15/43, 34.9%). Presum- smoking-related disease, with a typical mutational signature
ably, MEN1 on chromosome 11 and VHL on chromosome (SBS4; ref. 35). However, smoking-related signatures were
3 could be targeted during tumorigenesis. In addition, the not detected in GIS-NECs in this series, suggesting distinct
frequency of lymph node metastasis in Panc-NETs in group 3 mutational processes. Clustering analysis showed that GIS-
(loss of one copy in entire chromosome 11) was significantly NECs derived from the same organ were generally grouped.
lower than Panc-NETs in other groups (P = 0.00293). Panc-NETs were divided into two clusters, namely dominant
contribution of SBS5 or SBS16. “Ductal-type Panc-NECs”
Novel Splicing Machinery by Large Deletion were clustered into the group that was characterized by
of SNRNP70 dominant contribution of SBS1, whereas “acinar-type Panc-
Among two neoplasms exhibiting RB1 exon skipping, NECs” were clustered in the group consisting of Panc-NETs
case NE005, with exon 15 skipping, had a large deletion of (dominant contribution of SBS5). Most gastric NECs were
SNRNP70, an RNA splicing factor (Supplementary Fig. S17A– clustered in the group exhibiting dominant contributions
S17D). This carcinoma had the most alternative splicing of SBS17a and SBS17b. The number of gastric NECs with
events among all neoplasms in the present study using the a dominant contribution of SBS17 is likely high (cases with
rMATS software (33). To the best of our knowledge, there has SBS17 accounted for >50% of total signatures: 6/10, 60%),
been no documentation of any relationship between aber- compared with the Chinese WGS cohort of 168 conventional
rant SNRNP70 and cancer, but it has been reported that gastric cancers (14). We also identified a rare signature [i.e.,
700 | CANCER DISCOVERY MARCH 2022 AACRJournals.orgComprehensive Genomic Profiling of NECs of the Gastrointestinal System RESEARCH ARTICLE
A H&E Synaptophysin RB1
NEC Ad NEC Ad NEC Ad
Pattern 1
Loss of RB1:
NEC only
NEC NEC NEC
Ad Ad Ad
Pattern 2
Loss of RB1:
NEC and Non-NEC (Ad)
NEC NEC NEC
Downloaded from http://aacrjournals.org/cancerdiscovery/article-pdf/12/3/692/3052812/692.pdf by guest on 11 May 2022
Pattern 3 Ad Ad Ad
Intact RB1
B
Pattern Pattern 1 (NE098) Pattern 2 (NE028) Pattern 3 (NE099)
Primary organ site Bile duct Esophagus Bile duct
Histology Ad NEC SCC NEC Ad NEC NEC (Liver met.)
Synaptophysin – + – + – + +
IHC
Rb + – – – + + +
Number of mutations 46 127 187 115 44 119 108
TP53 (0.217) TP53 (0.327)
TP53 (0.347) TP53 (0.997) RB1 (1.000) RB1 (0.916)
Common driver mutations (aVAF) TP53 (0.256) TP53 (0.993) TP53 (0.670)
STAT6 (0.270) STAT6 (0.514) MAP3K1 (0.994) MAP3K1 (0.991)
MLH3 (0.376) MLH3 (0.436)
CSMD3 (0.528)
MAP2K2 (0.432) PTPRT (0.396)
MSH6 (0.371) DNMT3A (0.334)
NEC–specific or Non-NEC–specific APC (0.337) NSD1 (0.182) KRAS (0.331) ARID1A (0.574) ARID1A (0.540)
driver mutations (aVAF) COL1A1 (0.326) CDH10 (0.127) FANCG (0.364) GLI1 (0.261) None TSHR (0.410) TSHR (0.461)
PDGFRA (0.297) NKX3-1 (0.942) PLXNA1 (0.376) ITGAV (0.187) ITGAV (0.205)
EP300 (0.259) DHX15 (0.170)
PTPRF (0.500) ABCB4 (0.151)
SMURF2 (0.149)
Figure 5. Bidirectional differentiation in GIS-NECs. A, Representative microscopic features of GIS-NECs with nonneuroendocrine carcinoma elements
(Non-NEC; adenocarcinoma or squamous cell carcinoma). Based on RB1 immunolabeling, these GIS-NECs are classified into three patterns. Pattern 1,
loss of RB1 only in the NEC component; pattern 2, loss of RB1 in both the NEC and Non-NEC components; pattern 3, intact RB1 in both the NEC and Non-
NEC components. The NEC components are positive for synaptophysin in all cases. NEC, NEC component; Ad, adenocarcinoma component. B, In three
cases of GIS-NECs with Non-NEC elements (adenocarcinoma or squamous cell carcinoma), NEC and Non-NEC components were separately macrodis-
sected from FFPE materials. WES was performed for each component. The table shows driver mutations (TVAF ≥ 0.1) identified by OncodriveMUT (39)
in the NEC and Non-NEC components in these cases. The genes in bold font are listed in the COSMIC Cancer Gene Census. SCC, squamous cell carcinoma
component; aVAF, variant allele frequency adjusted to tumor purity; Liver met., liver metastasis.
SBS31 in a Panc-NEC (NE024)] in the updated COSMIC Divergent Genetic Alterations
mutational signatures (v3.1). Although the number of cases in NEC and Non-NEC Components
with this mutational signature is relatively few (SBS31, Several of the neuroendocrine carcinomas had a nonneu-
six cases reported in the ICGC/TCGA PCAWG; ref. 36), it roendocrine component (MiNENs). The nonneuroendocrine
should be borne in mind that the signature may be due to components included adenocarcinoma or squamous cell car-
platinum drug treatment (37). Indeed, our case received cinoma. We observed three patterns of RB1 immunolabeling
platinum-based chemotherapy before the carcinoma was in these MiNENs: pattern 1, loss of RB1 only in the NEC
harvested. Findings of a mutational signature analysis of component; pattern 2, loss of RB1 in both NEC and Non-NEC
GIS-NECs by deconstructSigs (38) using WGS and WES data components; and pattern 3, intact RB1 in both components
are provided in Supplementary Fig. S19. (Fig. 5A). Most cases belonged to pattern 1 or 3, but given
MARCH 2022 CANCER DISCOVERY | 701RESEARCH ARTICLE Yachida et al.
the existence of NECs showing pattern 2, we conducted were shared with all 25 samples, while 45.3% (77/170) of the
WES using macrodissected FFPE materials of NEC and Non- cfDNA mutations were unique to cfDNA (Fig. 6D). We also
NEC components independently in the same patients (n = 3; observed that common mutations shared with many samples
Fig. 5B; Supplementary Table S18). In all three cases, the (e.g., KRAS, TP53, and RB1) tend to have higher TVAF in
phenotypically different cells had a common origin because cfDNA. Comparison of TVAFs in cfDNA to median aVAFs
they shared specific genomic aberrations. In case NE028 (variant allele frequencies adjusted to tumor purity) among
(esophageal NEC), RB1 protein was lost in both the NEC and the 25 samples showed a strong correlation (Spearman rank
Non-NEC components. The number of mutations was larger correlation: ρ = 0.850, P < 2.2 × 10⁻¹⁶), as shown in Supple-
in the Non-NEC component than in the NEC components. mentary Fig. S20F and S20G. The mutational signature of
Four driver mutations detected by OncodriveMUT (39) were cfDNA belonged to the different cluster than that for tissue
common in both components, and driver mutations of onco- samples (Supplementary Fig. S19).
genic genes including KRAS (p.G12A) had accumulated in the
Non-NEC component (Fig. 5B).
DISCUSSION
Multiregion Analysis Using Multiomics Data in an In the present study, we first verified that Panc-NECs are
Autopsied Patient with Panc-NEC genetically distinct from Panc-NETs. Most Panc-NETs har-
We also performed multiregion WES, whole-transcrip- bor MEN1, DAXX gene mutations, and hemizygous loss of
Downloaded from http://aacrjournals.org/cancerdiscovery/article-pdf/12/3/692/3052812/692.pdf by guest on 11 May 2022
tome sequencing, and methylation assay on 20 regions of specific chromosome(s). GIS-NECs harbor TP53 mutations
the primary and five separate metastases from an autop- and RB1 alterations and/or CCNE1/MYC amplification. Of
sied patient with Panc-NEC (case NE004). The number of interest, Panc-NECs and Nonpanc-NECs have moderately
nonsynonymous somatic mutations ranged from 30 to 47 different genomic characteristics, the latter exhibiting more
with an average of 38.5 (Supplementary Table S19). Because SVs and nonsynonymous mutations. Panc-NECs could be
somatic phylogenetics is complicated by sample heterogene- further divided into “ductal” or “acinar” types. A schematic
ity, we inferred the evolutional lineage tree based on vari- representation of genomic alterations of GIS-NENs during
ant allele frequency (VAF)–based clustering of each sample tumor progression is shown in Fig. 7.
to detect subclones, in this case using the method that In addition to prevalent TP53 mutations and RB1 alter-
automates the phylogenetic inference of cancer progression ations and/or CCNE1/MYC amplification in GIS-NECs,
from multiple somatic samples (LICHeE; ref. 40; Fig. 6A). we found that inactivation of Notch family genes was
We also inferred a phylogenic tree based on mutations characteristic in Nonpanc-NECs, and a Notch inhibitor
and LOH patterns using randomized axelerated maximum induced neuroendocrine features in genome-engineered
likelihood (RAxML; ref. 41), which showed widely spread- organoids. The Notch pathway is known to be involved
ing branches (Supplementary Fig. S20A and S20B). All 20 in the clinical behavior of SCLC through its action on a
regions and 5 liver metastases shared mutations in major number of biological processes such as neuroendocrine
driver genes (i.e., KRAS, RB1, and TP53). In Fig. 6B, sections differentiation (42).
are colored corresponding to the colors of the evolutional Our findings suggest that NE-TFs, especially the SOX2
lineage tree in Fig. 6A. Interestingly, ploidy levels and copy- gene, have crucial roles in GIS-NECs. Akiyama and col-
number analysis demonstrated that WGD occurred in only leagues reported five of seven Panc-NECs to be positive for
adjacent regions 12, 16, and 17 in the primary Panc-NEC SOX2 immunohistochemically (43). SOX2 is an embryonic
(Supplementary Table S20). In this case, WGD occurred in stem cell transcription factor that is essential both for the
the same subclone as a late event. Of note, histologic exami- pluripotency of embryonic stem cells and for the mainte-
nation showed adenocarcinoma elements only in region 12 nance of physiologically migratory neural progenitor cells
(WGD region; Fig. 6C), where synaptophysin was positive (44). Mu and colleagues (45) reported that lineage plasticity
in only NEC components, but RB1 protein was negative in is promoted by SOX2, in particular in neuroendocrine trans-
both immunohistochemically. differentiation in TP53- and RB1-deficient prostate cancers.
One liver metastasis (M29) was located in different Harold and colleagues (46) reported the SOX2-dependent
branches from four other liver metastases in both lineage conversion of an undifferentiated aggressive cancer cell
and phylogenic trees and diverged in the early stage of the to a differentiated neuron-like phenotype in Merkel cell
RAxML phylogenetic tree, indicating that this metastasis carcinomas. Unexpectedly, the high expression of SOX2 in
(M29) occurred at an earlier stage of disease compared with GIS-NECs observed here appeared to be regulated by hyper-
the others. We next performed hierarchical clustering based methylation of the promoter region of SOX2, so-called para-
on the methylation data (Supplementary Fig. S20C–S20E). doxical gene activation. Recently, growing evidence has been
The map based on methylation assay was similar to that presented that this association may not always hold true,
based on somatic mutations and LOH status, regions 12, 16, and promoter hypermethylation also appears to be associ-
and 17 (WGD regions) being clearly separated. ated with high transcriptional activity (47). In addition,
At autopsy, we obtained blood from inferior vena cava ATAC-seq showed open chromatin peaks in the region sur-
from this patient and performed WES using circulating cell- rounding the SOX2 gene. Thus, our comprehensive genomic
free DNA (cfDNA; Supplementary Table S21). The cfDNA profiling demonstrated that epigenetic aberrations play a
concentration was extremely high (5,000 ng/mL plasma). significant role in GIS-NECs.
We compared somatic mutations in cfDNA with the muta- Most GIS-NECs presumably arise from precursor lesions
tions in tissue samples: 29.4% (50/170) of cfDNA mutations that typically give rise to nonneuroendocrine carcinomas
702 | CANCER DISCOVERY MARCH 2022 AACRJournals.orgComprehensive Genomic Profiling of NECs of the Gastrointestinal System RESEARCH ARTICLE
A Germline
Parental clone
3 8 3 4 5
7 4 2 2 2 13 10 5 2
14 2 4 6 2 12 2
12 17 16 8 1 19 7-1 3 6 2 4 5 M10 M6 M22 M8 18 9 14 15 11 10 13 M29 7-2
12 17 16 8 1 19 7-1 3 6 2 4 5 M10 M6 M22 M8 18 9 14 15 11 10 13 M29 7-2
B C
Downloaded from http://aacrjournals.org/cancerdiscovery/article-pdf/12/3/692/3052812/692.pdf by guest on 11 May 2022
Region 12
7-1 3 2 1
NEC
7-2 6 5 4
11 10 9 8
15 14 13 12
Ad
19 18 16 17
D
cfDNA
M8
M29
M6
Common to cfDNA and all 25 samples
M10
Common to cfDNA and 20–24 samples
Common to cfDNA and 10–19 samples
M22
Common to cfDNA and 2–9 samples
Common to cfDNA and sample R18
Common to cfDNA and sample M10
Common to cfDNA and sample M6
Unique to cfDNA
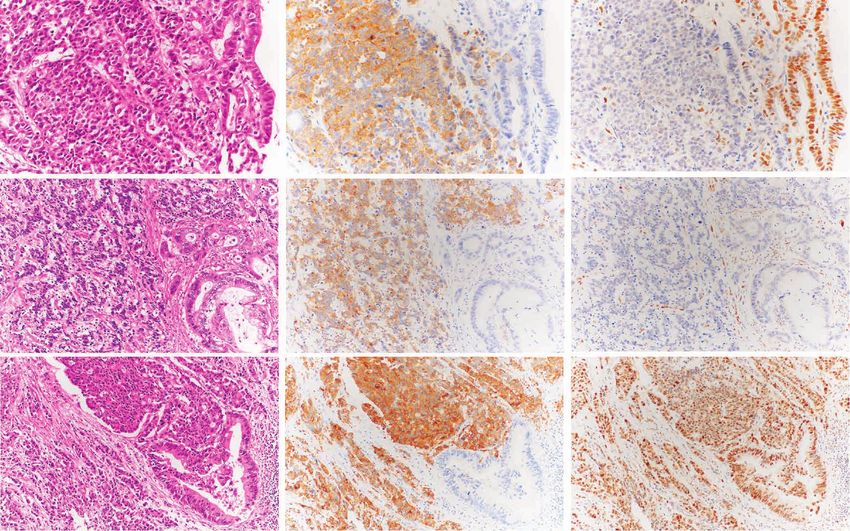
Figure 6. Geographic mapping of subclones based on multiregion WES and proposed clonal evolution of the Panc-NEC in the autopsied patient.
A, Proposal clonal evolution model drawn according to the evolutional lineage tree based on VAF of the mutations (LICHeE; ref. 40) in 20 primary regions
and 5 liver metastases. The numbers inside the circles are for mutations used by LICHeE to infer the subclonal structure. The colors in each subdivision
describe the mutation groups characterizing cells in this subpopulation. The numbers and colors inside the squares indicate the region numbers shown
in B and the composition of subpopulations, respectively. B, Macroscopic picture of the maximum section through the primary Panc-NEC. Sections are
marked, corresponding to the colors of the predicted subclones based on the evolutional lineage tree. C, Microscopic picture of region 12 in the primary
Panc-NEC (H&E staining). Copy-number analysis demonstrated that WGD occurred in only the adjacent regions 12, 16, and 17 (Supplementary Table S20).
Adenocarcinoma component observed together with NEC only in region 12. NEC, NEC component; Ad, adenocarcinoma component. D, Pie chart showing
the relationship between mutations detected in plasma cfDNA and in tissue samples (20 primary regions and 5 liver metastases).
MARCH 2022 CANCER DISCOVERY | 703RESEARCH ARTICLE Yachida et al.
Pancreatic NEC
Alterations of TP53
Progenitor cell Acinar-type
CDKN2A silencing Intact RB1
Alterations of WNT signaling
Inactivation of TP53 and RB1
Progenitor cell Ductal-type
NE-TF overexpression
KRAS mutation
(e.g., SOX2)
Inactivation of
CDKN2A Pancreatic ductal
TP53 adenocarcinoma
SMAD4
Pancreatic NET
Genome wide-LOH WGD
Alterations of MEN1
or loss of Chr11
Progenitor cell NETG1/2 NETG3
Alterations of CDKN2A, TP53
Downloaded from http://aacrjournals.org/cancerdiscovery/article-pdf/12/3/692/3052812/692.pdf by guest on 11 May 2022
Alterations of VHL
or loss of Chr3
Nonpancreatic GIS-NEC
Alterations of TP53 and
Progenitor cell Precancerous RB1 or CCNE1/MYC
Including tuft cell Mutation(s) in cells Inactivation of Notch and
APC, ELF3... NE-TF overexpression
(e.g., SOX2)
Figure 7. Schematic diagram of genomic alterations involved in the genesis of pancreatic NEC, pancreatic NET, and nonpancreatic NEC of the
gastrointestinal system (GIS). NE-TF, transcription factor for neuroendocrine differentiation.
of the respective organ, since organ-specific initial genetic (e.g., AKT inhibitors) showed selective and potent activity
events were detected (e.g., KRAS in ductal-type Panc-NECs in CCNE1-amplified carcinomas (51). In addition, early-
and APC in colorectal NECs). In addition, the observation phase trials of CHK1 and WEE1 inhibitors identified
that tubulovillous adenomas were located adjacent to the high frequencies of CCNE1 amplification among respond-
colorectal NEC in two cases (NE035 and NE084) supports ers, though the sample sizes were limited (52). These
this hypothesis. drugs might offer promising therapeutic strategies for
There is a possibility that NEC and Non-NEC components CCNE1-amplified GIS-NECs.
develop bidirectionally. In case NE028, RB1 protein was lost In conclusion, Panc-NECs are genetically distinct from
in both the NEC and Non-NEC components. Four driver Panc-NETs and may not be etiologically related. GIS-NECs
mutations were common in both components, and driver arising in different organs show similar histopathologic fea-
mutations of oncogenic genes including KRAS (p.G12A) had tures and share some genomic features, but considerable dif-
accumulated in the Non-NEC component (Fig. 5B). In addi- ferences exist between Panc-NECs and Nonpanc-NECs.
tion, the evolutional lineage tree of our autopsied case indi-
cated that the Non-NEC component (adenocarcinoma) was
linked to a unique WGD-positive subclone. Although sponta- METHODS
neous transformation from conventional adenocarcinoma or Patients and Tissue Samples
squamous cell carcinoma to NEC has been reported (48), the This study included 115 GIS-NENs from patients evaluated and
possibility of the reverse occurring was recently postulated treated at the National Cancer Center Hospital (Tokyo, Japan), the
from a case study of SCLC (49). In addition, Calbo and col- National Cancer Center Hospital East (Chiba, Japan), Tokyo Wom-
leagues (50) reported that RasV12 promoted transition from a en’s Medical University Hospital (Tokyo, Japan), Osaka University
neuroendocrine to a nonneuroendocrine phenotype in Rb1- Hospital (Osaka, Japan), Wakayama Medical University Hospital
and Trp53-deficient mouse SCLC cells. (Wakayama, Japan), Hiroshima University Hospital (Hiroshima,
Japan), Kagawa University Hospital (Kagawa, Japan), the Johns
We here observed that two GIS-NECs were etiologically
Hopkins Hospital (Baltimore, MD), and the University Medical
linked to viruses (MCPyV for a gastric NEC and HPV for Center Utrecht (Utrecht, the Netherlands). Tumors and corre-
a colorectal NEC), indicating that more attention should sponding nontumor tissues were frozen or FFPE after surgical
be devoted to this possibility in future analyses in clini- resection (Supplementary Table S1). In addition, two frozen sam-
cal practice. It has been reported that the combination ples were taken at autopsy, four organoid samples were derived
of dinaciclib, a CDK1/2/5/9 inhibitor, with other drugs from biopsied materials following upper or lower gastrointestinal
704 | CANCER DISCOVERY MARCH 2022 AACRJournals.orgYou can also read