Complete Chloroplast Genome Sequences of Three Aroideae Species (Araceae): Lights into Selective Pressure, Marker Development and Phylogenetic ...
←
→
Page content transcription
If your browser does not render page correctly, please read the page content below
Complete Chloroplast Genome Sequences of Three
Aroideae Species (Araceae): Lights into Selective
Pressure, Marker Development and Phylogenetic
Relationships
Bicong Li
Jiangxi Agricultural University
Tao Liu
Jiangxi Agricultural University
Asjad Ali
Department of Agriculture and Fisheries
Yao Xiao
Jiangxi Agricultural University
Nan Shan
Jiangxi Agricultural University
Jingyu Sun
Jiangxi Agricultural University
Yingjin Huang
Jiangxi Agricultural University
Qinghong Zhou
Jiangxi Agricultural University
Qianglong zhu ( longzhu2011@126.com )
Jiangxi Agricultural University
Research Article
Keywords: Aroideae, chloroplast genome, structural comparison, selective pressures,phylogenetic
relationships
Posted Date: July 1st, 2021
DOI: https://doi.org/10.21203/rs.3.rs-602156/v1
License: This work is licensed under a Creative Commons Attribution 4.0 International License.
Read Full License
Page 1/27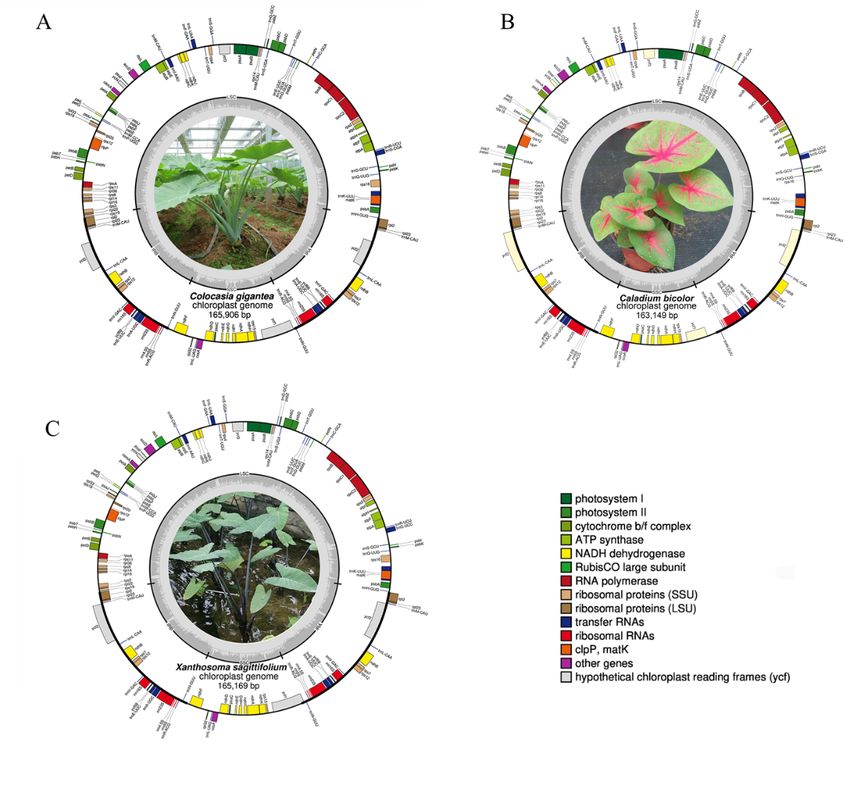
Abstract
Background : Colocasia gigantea, Caladium bicolor and Xanthosoma sagittifolium are three worldwide
famous ornamental and/or vegetable plants in the Araceae family, these species in the subfamily
Aroideae are taxonomically perplexing due to shared interspecific morphological traits and variation.

Result : This study, for the first time ever, assembled and analyzed complete chloroplast genomes of C.
gigantea, C. bicolor and X. sagittifolium with genome sizes of 165,906 bp, 153,149 bp and 165,169 bp in
length, respectively. The genomes were composed of conserved quadripartite circular structures with a
total of 131 annotated genes, including 8 rRNA, 37 tRNA and 86 protein-coding genes. A comparison
within Aroideae showed seven protein-coding genes (accD, ndhF, ndhK, rbcL, rpoC1, rpoC2 and matK)
linked to environmental adaptation. Phylogenetic analysis confirmed a close relationship of C. gigantea
with C. esculenta and S. colocasiifolia, and the C. bicolor with X. sagittifolium. Furthermore, three DNA
barcodes (atpH-atpI + psaC-ndhE, atpH-atpI + trnS-trnG, atpH-atpI + psaC-ndhE + trnS-trnG) harbored
highly variable regions to distinguish species in Aroideae subfamily.

Conclusion : These results would be beneficial for species identification, phylogenetic relationship,
genetic diversity, and potential of germplasm resources in Aroideae.

Background
The subfamily Aroideae is the largest and most diverse group of the family Araceae [1], which consists of
approximately 75 genera and over 1573 species with large foliage and a type of inflorescence called a
spadix [2]. The subfamily Aroideae is found mostly in the tropics and widely distributed in temperate
zones [3] such as south and central America, New Zealand, southern China, South-east Asia, and west
African, where various members of Aroideae have proved their importance in horticultural industry.

C. gigantea, commonly known as Giant Elephant Ears, is a 150–300 cm tall perennial herbal plant with
frost-tender boasting huge and heart-shaped green leaves up to 120–180 cm long and 90–150 cm wide.
C. gigantea is an important horticultural plant in the humid tropics and subtropics and used as a
vegetable in many parts of South East Asia [4]. High dietary fiber and low sugar contents in its petioles
make it attractive for diabetes and hypertensive patients. [5].

C. bicolor is also known as caladiums, elephant ears, or angel wings. C. bicolor is native to the open
forests of tropical south America and typically grown for the bold and colorful foliage, the plant has a
great ornamental value due to its multicolor foliage and has been cultivated in pots for indoor as well as
lawn decoration[6]. All parts of the plant cannot be edible because of containing a mass of calcium
oxalate and other toxic substances [7], but the leaf extracts possess antidiarrheal, anticonvulsant,
anxiolytic and antidepressant properties [8]. X. sagittifolium is known by various names such as
malanga, cocoyam, tannia, arrowleaf elephant ears, and American taro [9]. X. sagittifolium is native to
tropical America but widely cultivated and naturalized in other tropical regions. X. sagittifolium have

                                                  Page 2/27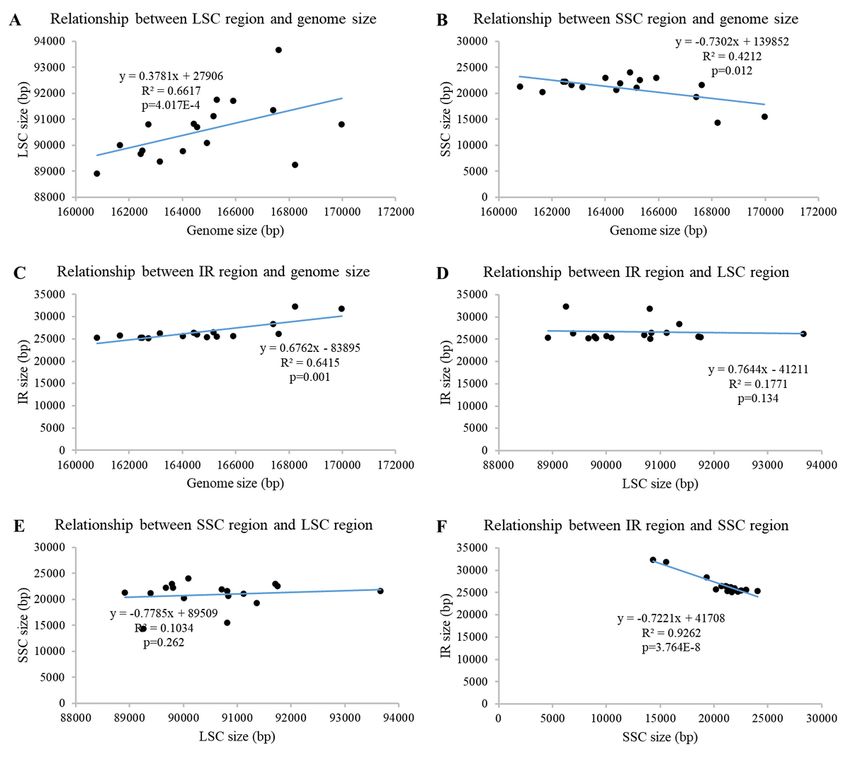
sagittate leaves and commonly used as ornamental plants. It is also grown for the starchy corms and
cooked as a popular regional dish (such as fufu) in west African tropical regions [10, 11].

Most of these herbaceous species in the Aroideae family (Araceae) that are used as foods and/or
ornamentals belong to the genera Colocasia, Caladium, Xanthosoma, and Alocasia. However, similar
phenotypic appearance and growth habits impede the identification, phylogenetic relationship, genetic
diversity, and utilization of germplasm resources in Aroideae [1, 3, 12].

The chloroplasts play an important role in plant growth and development by conducting photosynthesis.
The Chloroplasts possess their own genetic material, a circular double-stranded DNA molecule,
comprising of 110–130 genes (encoding ribosomal RNA, transfer RNA and proteins) ranging 107–218 kb
in size [13]. Complete chloroplast genome (CPG) usually present a highly conserved quadripartite
structure consisting of a large (LSC) and a small single (SSC) copy regions separated by two inverted
repeats (IRa and IRb). Comparing to nuclear genomes, chloroplast genome have a unique inherited
model, a dense gene content and a slower mutation rate in evolution [14]. The CPG is present in cells with
higher number of copies that makes it favorable to use in terms of DNA extraction even from a small
amount of sample including degraded ones [15]. Therefore, the CPG have been recommended by the
Barcode of Life Consortia as a molecular resource for developing molecular markers to genetically
differentiate plant species [16]. Chloroplast-derived molecular markers have been widely used in
taxonomic and phylogenetic researches, and provide many valuable information to resolve complex
evolutionary relationships at multiple taxonomic levels [13–15]. With the development and application of
high-throughput sequencing technologies in genome sequence, the high abundance of chloroplast DNA
compared to nuclear DNA have made it relatively easy to obtain complete chloroplast genome sequence
without prior purification of chloroplasts or its DNA [17]. Over 5000 complete chloroplast genomes
sequences have been published from crop and other land plant genomes [18–20] that lead to the
development of comprehensive and accurate molecular markers for taxonomic, phylogenetic purposes
and conservation of many valuable traits.

Comparing to the complex and huge nuclear genomes of Aroideae species [21], CPGs are smaller and
easy to obtain, however, very limited genomic resources are available for subfamily Aroideae. Although
the CPG of several genera have been published [1, 22, 23], the phylogenetic relationship of Aroideae
subfamily still needs attention specifically in areas of marker development and protein-coding gene
selection. Therefore, further comprehensive studies on chloroplast genome resources with comparative
analysis are necessary to solve these problems.

In the present study, we sequenced, de novo assembled and annotated the complete chloroplast genomes
of C. gigantea, C. bicolor and X. sagittifolium. Furthermore, we compared the new chloroplast genome
sequences of these three species with the published complete chloroplast genome sequences of 14 other
Aroideae species. Our objectives were to: (1) to uncover Aroideae chloroplast genome and highly variable
regions (hotspots) for developing molecular markers with high credibility; (2) to identify the protein-
coding genes under selection that would play an important role in the adaptive evolution for Aroideae

                                                  Page 3/27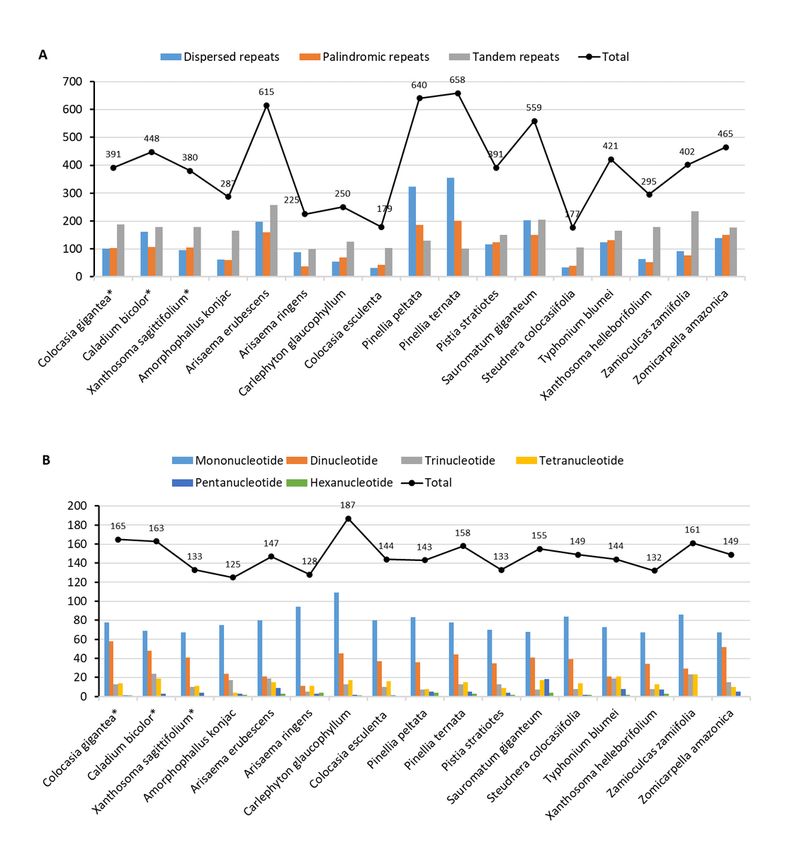
plants in ecosystems; (3) to construct a phylogenetic tree for locating the phylogenetic position of C.
gigantea, C. bicolor and X. sagittifolium.

Results
General characteristics of three chloroplast genomes
The de novo assembly for the complete chloroplast genomes of C. gigantea, C. bicolor and X.
sagittifolium produced 1,227,229, 792,949, and 1,109,410 clean reads with an average length of 150bp
with Illumina sequencing and filtering low-quality bases. The mean coverage of these reads on the
chloroplast genomes of C. gigantea and C. bicolor was 1159 ×, 629 ×, and 927 ×, respectively, indicating
the standard coverage of the reads enough to construct the complete chloroplast genome. The
chloroplast genome lengths of C. gigantea, C. bicolor and X. sagittifolium were recorded as 165,906 bp,
163,149 bp, and 165,169 bp, respectively, followed by genome assembly and annotation steps (Fig. 1). All
the CPGs displayed a typical quadripartite structure: one LSC region and one SSC region separated by
two IR regions. The overall GC content percentages of C. gigantea (35.7%), C. bicolor (35.8%) and X.
sagittifolium (35.7%) were similar among three genomes. The GC content of IR region (41.4–42.3%) of
the four structural regions was significantly higher than that of the LSC (33.8–34.1%) region and SSC
(28.6–29.4%) region for each CPG (Table 1). The three cp genomes encoded an identical set of 131
functional genes including 86 protein-coding genes, 8 rRNA genes, 37 tRNA genes. Out of 131 genes, 17
were duplicated in the IR region, including 7 protein-coding genes, 6 tRNA genes, and 4 rRNA genes.
Twenty-three genes had introns, including four genes (two rps12, one clpP and one ycf3) with two introns.
The sequencing data of C. gigantea, C. bicolor and X. sagittifolium were deposited in GenBank under the
accession numbers MN972442, MN972441, and MW628970, respectively.

                                                  Page 4/27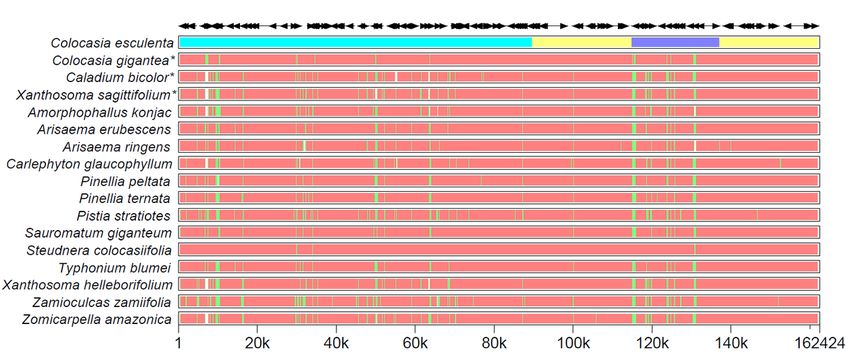
Table 1
 Whole genome sequence data and chloroplast genomes comparison of Colocasia gigantea, Caladium.
                             Bicolor and Xanthosoma sagittifolium.
   species                   Colocasia gigantea*     Caladium. bicolor*    Xanthosoma sagittifolium*

   Locations                 Jiangxi                 Hainan                Guangxi

   Whole genome reads        19,362,830              17,475,516            27,498,048

   Chloroplast reads         1,227,229               792,949               1,109,410

   Mean coverage             1159                    629                   972

   Size (bp)                 165906                  163149                165169

   LSC (bp)                  91710                   89383                 91121

   SSC (bp)                  22994                   21210                 21078

   IR (bp)                   25601                   26278                 26485

   Number of total genes     131                     131                   131

   Number of CDS             86                      86                    86

   Number of tRNAs           37                      37                    37

   Number of rRNAs           8                       8                     8

   IR duplication gene       17                      17                    17

   Overall GC content (%)    35.7                    35.8                  35.7

   GC content in LSC (%)     33.8                    34.1                  33.8

   GC content in SSC (%)     28.6                    29                    29.4

   GC content in IR (%)      42.3                    41.5                  41.4

   GenBank number            MN972442                MN972441              MW628970

Chloroplast genome size variation in Aroideae
Based on the complete chloroplast genome of C. gigantea, C. bicolor and X._sagittifolium, and 14
published CPGs, we conducted a comparative analysis on 17 CPGs in total. The CPG sizes in Aroideae
ranged from 160,792 bp (Arisaema ringens) to 169,977 bp (Typhonium blumei), with an average CPG
sequence length of 164,748 bp. All the CPGs displayed a typical quadripartite structure, the LSC length
ranged from 88,915 bp (Arisaema ringens) to 93,660 bp (Arisaema erubescens) with an average length of
90,568 bp, and SSC length ranged from 143,38 bp (Carlephyton glaucophyllum) to 24,044 bp (Pinellia
peltata) with an average length of 20,925 bp. Two IR regions ranged from 25,131 bp (Zomicarpella
amazonica) to 32,313 bp (Carlephyton glaucophyllum) with an average length of 26,627 bp (Table S1,
Fig. S1). The overall chloroplast genome sizes showed a significant positive correlation with the LSC

                                                Page 5/27
region (R2 = 0.662, P = 4.017E-4) and IR region (0.642, 0.001) (Fig. 2A, C), however, the SSC region was
significantly negative in correlation with the overall genome sizes (0.421, 0.012) (Fig. 2B). It indicated the
expansion of LSC and IR, and the contraction of SSC would promote the CPG size in Aroideae. In
addition, the SSC was the only observed region with a significant negative correlation with IR region
(0.9262, 3.764E-8) (Fig. 2F, D, E), suggesting a markable conflict between SSC and IR regions in Aroideae.
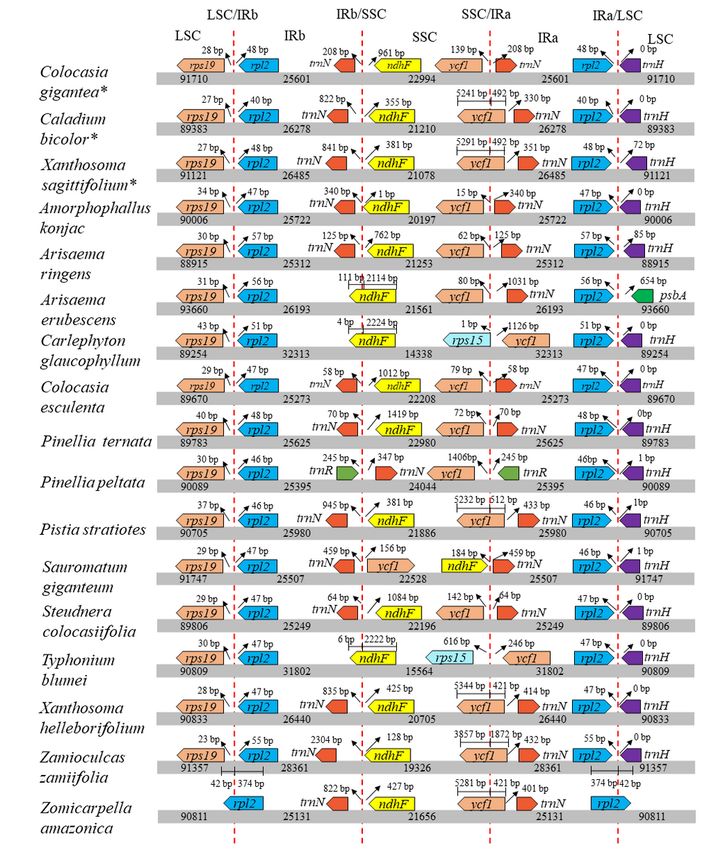
IR/SC boundary and genome rearrangement
The expansion and contraction of the IR and SC regions are the major causes of differentiation in
chloroplast genome size and account for common evolutionary events in some families. To survey the
variation of IR/SC boundary, a detailed comparison of the IR/SC boundary regions of C. gigantea, C.
bicolor and X. sagittifolium with other 14 Aroideae species was conducted (Fig. 3). The LSC/IRb
boundary was between or within rps19 and rpl2 with varying distances from the border in three types,
while the IRa/LSC boundary was between rpl2 and trnH in all genera. However, based on the IRb/SSC and
SSC/Ira differences, these chloroplast genomes could be divided into four types depending on the gene
location in the IR/SC boundaries; type I contains the most species such as C. gigantea, C. bicolor, X.
sagittifolium, Amorphophallus konjac, A. ringens, A. erubescens, C. esculenta, P. ternate, Pistia stratiotes,
Steudnera colocasiifolia, Xanthosoma helleborifolium, Zamioculcas zamiifolia and Z. amazonica; type II
occurred in C. glaucophyllum, T. blumei; type III and IV were present in only Pinellia peltate and
Sauromatum giganteum, respectively. The IRb/SSC border in the type I was located within trnN and ndhF,
the SSC/IRa in the type I were located within ycf1 and trnN, but the IRb/SSC border in the type II was
located within ndhF, the SSC/IRa in type II was located between rps15 and ycf1. Our study showed the
length of IRs in type I ranged from 25,131 bp to 28,361 bp, while the lengths of IRs in type II were 32,313
bp (C. glaucophyllum) and 31,802 bp (T. blumei), indicating the significant expansion of IR regions to
merge more genes happened in type II and lead to duplication of ycf1. The IRb/SSC borders in type III
were located between trnR and trnN, the SSC/IRa were located between ycf1 and trnN. Our results showed
that the SSC length of P. peltate in type III was maximum in Aroideae, and the expansion of SSC regions
included trnN, which lead to change the SC/IR boundary. However, the IRb/SSC borders in type IV were
located between trnN and ycf1, the SSC/IRa in type III were located between ndhF and trnN. These results
suggested that the SSC of S. giganteum chloroplast genome has been reverse complemented, which help
in reverse the positions of genes at SSC region. All these events in the CPGs prove the
expansion/contraction of two IR regions and the genome rearrangement.
Sequence divergence analysis and nucleotide diversity
The cp genomes of C. gigantea, C. bicolor, and X. sagittifolium were compared with other 14 species in
Aroideae using MultiPipMaker software using C. esculenta as a reference. Two single-copy regions (LSC
and SSC) were more divergent than two IR regions (Fig. 4), which might be the result of the four highly
conserved rRNAs located in the IR region. Moreover, the data plot revealed that the noncoding region was
more divergent than its coding counterparts (Fig. 5).
Page 6/27In order to confirm the sequence divergence and nucleotide diversity of different genome regions, the
nucleotide diversity of 261 regions, including 130 protein-coding genes and 131 intergenic regions among
the thirteen chloroplast genomes in Aroideae was analyzed using DnaSP software [24]. The results
revealed that intergenic regions were more divergent than coding region (Fig. 5). The average nucleotide
variability (Pi) in the noncoding regions was higher (0.099) compared to coding regions (0.038). The trnN-
ndhF (0.295), trnS-trnG (0.269), and rpl32-trnL (0.228) intergenic regions were three top highest variables
among the noncoding regions, while the genes ccsA (0.141), ndhF (0.140), and ndhD (0.121) were most
variables among the coding regions. Several other highest-level divergences (Pi > 0.17) were found in the
intergenic regions (psaC-ndhE, ndhG-ndhI, accD-psaI, ccsA-ndhD, rps15-ycf1, trnL-ccsA, psbI-trnS, petD-
rpoA, rps19-rpl2, and atpH-atpI), and could be developed as specific molecular markers for species
identification.
Repeat Analysis and Simple Sequence Repeats (SSR)
identification
Repeat units, distributed in the chloroplast genomes with high frequency, play an important role in
genome evolution. The dispersed and palindromic repeat structures with length greater than 30 bp, and
the tandem repeats greater than 7 bp in the seventeen species have been represented in the Fig. 6A. The
repeats of the C. bicolor chloroplast genome consist of 448 total repeats, including 101 dispersed, 103
palindromic, and 187 tandems. However, C, gigantea and X. sagittifolium have smaller number of repeats,
391 and 380, respectively. Among the 17 Aroideae species, C. esculenta (179) had the lowest and P.
ternata (658) had the highest number of repeats. Furthermore, we identified a total of 165, 163 and 133
SSRs by using MISA software within the chloroplast genomes of C. gigantea, C. bicolor and X.
sagittifolium, respectively. The SSR number in the Aroideae species ranged from 125 (Amorphophallus
konjac) to 187 (C. glaucophyllum) with an average number of 148 (Fig. 6B). The three focused species
also had the SSRs near to the average value not the extreme value. The mononucleotide repeats in the
chloroplast genomes of Aroideae species were most common (53%), followed by the dinucleotide repeats
(25%), while the hexanucleotide repeats (1%) were the least. Most of the SSRs were located in the
intergenic region of LSC, and the least amount of SSRs were in IR regions (Table S2). The 18 regions
(rps16-trnQ, trnS-trnG, atpH-atpI, rpoB-trnC, ycf3-trnS, trnT-trnL, trnF-ndhJ, rbcL-psaI, clpP-intron, rpl16-rps3,
trnL-ndhB, trnN-ndhF, ndhF-rpl32, psaC-ndhE, ndhE-ndhG, ndhG-ndhI, rps15-ycf1, and ycf1) contained
more than three SSRs in at least one of the three species. Based on our results, there were only six regions
(atpH-atpI, psaC-ndhE, trnN-trnF, trnS-trnG, ndhG-ndhI, rps15-ycf1) with high sequence divergence (Pi >
0.17) to be considered as the highly variable regions (HVR) for marker development and DNA barcode
studies in Aroideae. Moreover, correlation analysis showed us that the dispersed, palindromic, tandem
repeats, and SSRs have no contribution to the chloroplast genome size (Table S3).
Selective pressure events
The ratio (ω) of 79 consensus protein-coding genes from 17 closely related species in Aroideae were
calculated to estimate the selective pressure. Seven genes (accD, matK, rbcL, rpoC1, rpoC2, ndhF, ndhK)
were found to experience positive selection by EasyCodeML software. The ω2 values (ω in M2a) ranged
Page 7/27from 2.97 to 78.21, where rpoC1 with the highest ω2 value (78.21) in the M2a model. It suggested that
rpoC1 could be subjected to a significant positive selection. The consistent selective sites in these six
genes were determined under naive empirical Bayes (NEB) and Bayes empirical Bayes (BEB) methods in
M7 vs. M8 model. The results revealed that the gene rpoC2 possesses 8 significantly positive selective
sites, followed by rbcL (4) rpoC1 (3), matK (2), ndhK (2) and accD (1), whereas no significantly positive
selective site was observed in the ndhF (Table 2).
Table 2
The results of positive selective pressure analysis in M2a, M7 vs. M8 model.
Gene Model np LnL ω2(M2a) LRTs(2ΔLnL) LRT Positive sites
name p-
value
accD M8 36 -3560.21 4.58 7.44 2.42E- 190 C*
2
M7 34 -3563.93
matK M8 36 -3912.79 2.97 18.03 2.76E- 314 Y *, 329 I*
4
M7 34 -3921.81
rbcL M8 36 -3096.54 17.49 54.37 0 219 C**, 225 I*, 262 V**,
328 A**
M7 34 -3123.73
rpoC1 M8 36 -4177.33 78.21 96.64 0 91 Q**,150 C**, 436 K*
M7 34 -4225.65
rpoC2 M8 36 -9048.76 4.59 29.53 3.86E- 80 L**, 533 K* 553 L*,
7 564 D*, 876 P*, 1025
S**, 1035 L*, 1356 L*
M7 34 -9063.53
ndhK M8 36 -1464.89 5.06 15.38 4.57E- 37 Q 0.963*,45 S 0.988*
4
M7 34 -1472.58
ndhF M8 36 -5328.43 7.74 8.69 1.29E-
2
M7 34 -5332.78
*: means P < 0.05, **: means P < 0.01
Phylogenetic analysis
Page 8/27In order to identify the phylogenetic positions of the C. gigantea, C. bicolor and X. sagittifolium within the
subfamily Aroideae, we utilized different regions, including the complete chloroplast genome, LSC, SSC,
IR, and 79 consensus protein-coding sequences of 18 species to construct the phylogenetic tree using
Alisma plantago-aquatica as an outgroup with maximum likelihood method (Fig. 7, Fig. S2). We found
that the phylogenetic tree based on the CDS have high bootstrap values (> 75), whereas the phylogenetic
trees constructed from CPG, LSC and IR have different topology with relatively lower bootstrap values,
suggesting that the phylogenetic tree constructed from CDS and SSC regions have higher credibility than
the phylogenetic trees constructed from CPG and IR. Furthermore, the CDS phylogenetic tree confirmed
that the three species belong to the subfamily Aroideae. The C. gigantea was closer to C. esculenta and S.
colocasiifolia. Similarly, the species Z. amazonica and X. sagittifolium clustered into a clade with the C.
bicolor and X. helleborifolium, respectively. Furthermore, S. colocasiifolia was observed near genus
Colocasia in our various phylogenetic trees.
Molecular marker development
A comprehensively comparative analysis on nucleotide diversity and SSRs resulted in the six regions
(atpH-atpI, psaC-ndhE, trnN-trnF, trnS-trnG, ndhG-ndhI, rps15-ycf1) with high nucleotide diversity and
possibility of developing more than three SSRs as candidate DNA barcode for molecular markers. The
comparative analysis of these new markers (Table 3) showed that the atpH-atpI have highest
discrimination success (94%) within the six candidate DNA barcode followed by trnS-trnG (83%) and
psaC-ndhE (77%) compared to low discrimination success of ndhG-ndhI, ps15-ycf1, and trnN-ndhF. We
didn’t observe any single candidate DNA barcode with 100% discrimination success. Three regions (atpH-
atpI, psaC-ndhE, trnS-trnG) with discrimination success ratios > 75% were combined as new candidate
DNA barcode. These three combined markers (atpH-atpI + psaC-ndhE, atpH-atpI + trnS-trnG, atpH-atpI +
psaC-ndhE + trnS-trnG) showed 100% discrimination success, especially, the phylogenetic tree
constructed from atpH-atpI + psaC-ndhE + trnS-trnG with high credibility (bootstrap value > 60), could be
developed as an accurate molecular marker in Ariodeae (Fig. 8).
Page 9/27Table 3
Comparative analysis of the new markers in Aroideae.
Makers Alignment Variable Information Number of Discrimination
length (bp) sites (%) sites (%) bootstrap success ratio
values > 75 (%)
atpH-atpI 1330 398 (29.9) 102 (7.7) 11 94
trnS-trnG 3475 1563 734 (21.1) 6 83
(45.0)
psaC-ndhE 1773 844 (47.6) 343 (19.3) 6 77
ndhG-ndhI 1350 560(41.5) 220(16.3) 0 66
rps15-ycf1 2160 944(43.7) 439(20.3) 0 55
trnN-ndhF 9621 2955(30.7) 1015(10.5) 3 38
atpH-atpI + psaC- 3103 1242 445 (14.3) 9 100
ndhE (40.0)
atpH-atpI + trnS- 4805 1961 836 (17.4) 11 100
trnG (40.8)
psaC-ndhE + trnS- 5248 2407 1077 (20.5) 9 94
trnG (45.9)
atpH-atpI + psaC- 6578 2805 1179 (17.9) 12 100
ndhE + trnS-trnG (42.6)
Discussion
In this study, the complete chloroplast genomes of three species of subfamily Aroideae were assembled
using Illumina sequencing technology followed by a comparative analysis, all methods were carried out
in accordance with relevant guidelines and regulations. A good level of similarity was observed among
three genomes in terms of genome structure, gene content and gene arrangements, however the
chloroplast genome of C. gigantea showed differences with C. bicolor and X. sagittifolium in SSC/IR
boundary, and C. bicolor and X. sagittifolium in terms of the expansion of IRs to merge part of ycf1
(Fig. 3). Similar structural variation was found in 14 species of Aroideae, including Pistia stratiotes,
Xanthosoma helleborifolium, Zamioculcas zamiifolia and Zomicarpella amazonica. Notably, the
complete ycf1 region was included in the IR of Carlephyton glaucophyllum and Typhonium blumei, and a
significant correlation between CPG size and IR size was observed. These results indicated that most of
the variations in chloroplast genome structure occur due to the contraction and expansion of IR region
[25].
The comparison of the chloroplast genome sequences obtained from sequence divergence analysis
showed us clear differences between species at the molecular level. The intron region showed the highest
variable rate, followed by the SSC, LSC, protein-coding regions, and IR region with the having the smallest
Page 10/27rate. Our results are consistent with the previous studies on the chloroplast genomes of many land plants
[13, 19, 26]. The nucleotide diversity of noncoding regions was higher than that in coding regions,
suggesting suitability of the noncoding regions in Aroideae for the molecular marker identification, this is
consistent with previous research in angiosperm chloroplast genomes[26], Thirteen intergenic regions
(specifically trnS-trnG) with highest-level of divergences (Pi > 0.17) could be developed as specific
molecular markers for species identification [27]. Similarly, psaC-ndhE, trnN-ndhF, ccsA-ndhD, rps15-ycf1,
petD-rpoA, atpH-atpI, rpl32-trnL, rps19-rpl2, trnL-ccsA have been reported for the discrimination of
potential molecular markers and DNA barcodes [13, 26, 28]. The six highly variable regions (atpH-atpI,
psaC-ndhE, trnN-trnF, trnS-trnG, ndhG-ndhI, rps15-ycf1) contained at least three SSRs in C. gigantea, C.
bicolor or X. sagittifolium (Table S2). Previously, highly variable regions have been compared for whole-
genome sequences in Rosaceae and indicated as hotspots in positive correlation with the distribution of
SSRs [13]. These results would improve our understanding of cp genome of Aroideae by the repeats
identification and nucleotide diversity analysis.
Analysis of the adaptive evolution of genes has an important reference value in examining the change of
gene structure and functional mutations. The KA/KS ratio may reveal the constraints of natural selection
on organisms, and the estimation of these mutations contribute greatly in understanding the dynamics of
molecular evolution [25, 26, 29]. In the present study, there were seven genes (accD, ndhF, ndhK, rbcL,
rpoC1, rpoC2, matK) under positive selection with significant selective sites. Among these, the accD gene
encodes the β-carboxyl transferase subunit of acetyl-CoA carboxylase [30], which is an important
regulatory enzyme for fatty acid synthesis. The accD has been reported as an essential gene required for
leaf development [31], and as a contributor in leaf longevity [32]. Considering the fact that Aroideae
species commonly have large leaf area, the finding of the accD under positive selection might indicate
that it is an essential factor for leaf development. Similarly, rpoC1 and rpoC2 encodes the RNA
polymerase β, which might play an important role in the regulation of pollination and sex differentiation
[26]. The matK encodes an intron maturase (maturase K) which is involved in the cutting/splicing of
Group II RNA transcriptional introns [33]. Furthermore, three other genes (ndhF, ndhK, and rbcL) under
positive selection showed photosynthesis linked roles, indicating their role in photosynthesis and carbon
fixation in Ariodeae. These genes (accD, rbcL, ndhK) to have been reported to undergo positive selection
in the Monsteroideae (Araceae) [29]. Most of the species in Aroideae family are distributed in creeks,
streamside, wetlands, and moist mountains. Therefore, chloroplast functional genes, involved in energy
metabolism and plant development, might play key roles during the adaptation and development of the
Aroideae species to their respective ecological niches.
Based on similar morphological characteristics and the size of nuclear genome, defining the phylogenetic
relationships in Aroideae is an important and difficult goal to reach [21]. Complete chloroplast genome
sequence is a great molecular resource for exploring phylogenetic relationships compared to whole
nuclear genome in Aroideae [1, 15]. Phylogenetic analysis using the chloroplast genome sequence has
been applied to evaluate evolutionary relationships of species [13, 26, 34]. Phylogenetic tree constructed
in this study based on complete chloroplast genome, CDS, LSC, SSC, IR, and intergenic regions, showed
results in consistence with the traditional classification system [2, 3], indicating the rational of the
Page 11/27classification of Aroideae. Furthermore, our phylogenetic analysis improves traditional classification by
differentiating Colocasia and Xanthosoma with a remote molecular level link, even the shape and size of
leaf and petiole of C. gigantea are very similar to X. sagittifolium (Fig. 1). Despite the markable
differences of C. bicolor with X. sagittifolium, a closer relationship was observed in the phylogenetic tree.
Moreover, presence of the S. colocasiifolia in the Colocasia’s clade, indicates the reliability of genetic
information to better understand the phylogenetic relationships in Aroideae.
Accurate discrimination of germplasm is very important for its utility, breeding new cultivars and
evolutionary relationships [35]. Discrimination based on only morphological traits in Aroideae would not
provide the complete picture of the family unless combined with the DNA markers. Previously, researchers
focused on mutational and evolutionary dynamics in chloroplast genome of Aroideae [1, 22, 23], however,
development and application of DNA barcodes have been rarely reported. DNA barcodes are defined as
the DNA sequences with a high mutation rate to identify a species within a family [36]. Plastid
(chloroplast) genome have such hotspot regions to be used as DNA barcodes for identification purposes
in closely related species [16, 36]. Here, three candidate DNA (highly variable regions) barcodes such as
atpH-atpI, psaC-ndhE, trnS-trnG were detected (Fig. 8, Table 3), in order to validate the discrimination
effect of these molecular markers, the combined DNA barcodes of atpH-atpI + psaC-ndhE + trnS-trnG were
manually extracted from other 13 published chloroplast genomes of Ariodeae spesies [1], the
phylogenetic tree contained 30 Aroideae species and Alisma plantago-aquatica was analysed (Fig. S3),
and the relationships among these species in the phylogenetic tree were almost consistent with the
previous taxonomic structure [1]. As our results showed, most of the candidate DNA regions are in LSC
region and these regions can discriminate Ariodeae species successfully when used in combination
forms. Similar results were reported for chloroplast genomes of Oryza [14], Cucurbitaceae [28] and
Rosaceae [13]. Therefore, these variable regions could be employed as specific DNA barcodes for
identification purposes and genetic diversity studies in subfamily Aroideae.
Conclusion
Present study reported the complete chloroplast genomes of Colocasia gigantea, Caladium bicolor and
Xanthosoma sagittifolium, which provided valuable resources to understand subfamily Aroideae. Seven
protein-coding genes (accD, ndhF, ndhK, rbcL, rpoC1, rpoC2, matK) were found to undergo selection, which
might be the result of adaptation to the environment. Phylogenetic relationship analysis revealed that the
C. gigantea was the base clade for C. esculenta and S. colocasiifolia, the C. bicolor was closer to X.
sagittifolium compared to C. gigantea, and S. colocasiifolia should be classed to the genus Colocasia.
Furthermore, several highly divergent noncoding regions were identified that would be beneficial for
developing high-resolution molecular markers. And newly developed DNA barcodes presented a solid
resource to distinguish the Aroideae species and study phylogenetic relationships.
Methods
Plant materials and DNA extraction
Page 12/27The fresh and healthy leaves of C. gigantea, C. bicolor and X. sagittifolium were collected from adult
plants growing for three months in the Araceae resource nursery of Jiangxi Agricultural University
(Jiangxi, China) and frozen at -80℃ until further use. Three voucher specimens were collected from
Jiangxi (C. gigantea, T2-31), Hainan (C. bicolor, T3-37) and Guangxi (X. sagittifolium, T5-34) province of
China with permission and deposited in the Tuber Crop Genetic Research Laboratory of Jiangxi
Agricultural University. Total genomic DNA was extracted from ~ 200 mg sample using modified CTAB
protocol. DNA quality and integrity were assessed in a Nanodrop 2000 spectrophotometer and evaluated
using a 0.8 % (w/v) agarose gel. The other eleven published complete chloroplast genomes were retrieved
from the National Center of Biotechnology Information (NCBI) for conducting the follow-up analyses.
Illumina Sequencing, assembly, and annotation
DNA sample of three species were used to build paired-end libraries with average insert size of 500bp and
sequenced using an Illumina Hiseq 2500 platform (BGI, Tianjing, China) followed by filtering of poor-
quality raw reads using Trimmomatic software. It resulted in the form of 1–2 Gb of sequence data after
base quality control, which was deposited in the China National GeneBank (CNGB) under project
CNP0001850. The chloroplast genome of C. gigantea and C. bicolor was assembled by using SPAdes (v
3.12.0) [37], BlastN (v2.7.1), and Gapcloser (v1.12-r6). Firstly, these reads were assembled by using the
Plasmidspades.py in SPAdes. Secondly, Contigs representing the chloroplast genome were retrieved,
ordered, and incorporated into a single draft sequence by comparing with the chloroplast genome of
Colocasia esculenta (NC_016753.1) using BlastN. Thirdly, the gaps in the chloroplast single draft
sequence were removed by using GapCloser. Finally, the complete genome sequence was annotated by
the combined results from CPGAVAS2 [38] and GeSeq [39] followed by manual corrections of the
positions of the start and stop codons and the intron/exon boundaries by Blastp against the GenBank
database. The circular chloroplast genome maps were drawn using the online program OGDRAW[40]. The
three newly generated complete chloroplast genome sequences were validated and submitted to
GenBank by using Sequin.
Whole chloroplast genomes comparison
In order to better discover the intergeneric variation among the complete chloroplast genome sequences
by genomes comparison in the subfamily Aroideae, 14 published complete chloroplast genomes were
compared. The details of the species are provided in Table S1. We used MultiPipMaker program with
default parameters to compare and visualize the alignments [41] by using reference CPG of C. esculenta.
The IR region borders and gene rearrangements were surveyed by manual inspection to analyze the
expansions, contractions, and variation in junction regions among 17 Aroideae species. The bivariate
correlational relationship between the overall CPG sizes and each of the structural regions of CPGs (LSC,
SSC and IR) were analyzed by SPSS v19.
Repeated sequences identification
A sequence search for four types (dispersed, palindromic, tandem, and microsatellite repeats) of repeated
sequences was conducted in all 17 species. An online program Vmatch was used to search out the size
Page 13/27and location of dispersed and palindromic repeats with parameters of 30 bp minimal repeat size, the
similarity percentage (at least 90%) of two repeat copies followed by manually filtering the redundant
output of Vmatch by merging overlapping repeats into one repeat motif whenever possible. The tandem
repeat sequences at least 7 bp in length was detected by the online program Tandem Repeats Finder with
the alignment parameters for match, mismatch, and indels set at 2, 7, and 7, respectively. Microsatellites
(SSRs) were searched by MISA with the parameters set as the thresholds of 10, 5, 4, 3, 3, and 3 for mono-,
di-, tri-, tetra-, penta-, and hexa-nucleotide, respectively.
Sequence divergence and selective pressure analysis
To analyse the sequence divergence of the chloroplast genomes in Aroideae family, the nucleotide
variability (Pi) of the gene-coding regions and intergenic regions was analyzed using DnaSP (v 6.12.03)
based on the method of Shi et al. (2019). Selective pressure was analyzed for consensus protein-coding
genes among 17 genomes from Aroideae species. Easy-CodeML software with the site model with four
comparison models (M0 vs. M3, M1a vs. M2a, M7 vs. M8 and M7a vs. M8a, LRT threshold p < 0.05) was
used to calculate the nonsynonymous (Ka) and synonymous (Ks) substitution ratios and likelihood ratio
tests (LRTs). The values of both Ka/Ks (ω) and the LRTs were coupled to evaluate the selection on amino
acid sites [42].
Phylogenetic relationships
To reconstruct the phylogenetic relationships and confirm the phylogenetic position of the C. gigantea, C.
bicolor and X. sagittifolium, 17 CPGs including 14 published CPG sequences from Aroideae were aligned
using the software MAFFT v7.017. Because the different CPG regions have the differentiation of the
molecular evolutionary rate, phylogenetic relationship analyses were performed using the following five
datasets: (1) the overall CPG sequences; (2) LSC; (3) SSC; (4) one inverted repeats region; and (5)
consensus protein coding genes (CDS). The phylogenetic trees were constructed using MEGA-X [43], and
a bootstrap test was performed with 1000 repetitions to calculate the maximum likelihood (ML)
bootstrap value with Tamura-Nei model using a heuristic search for the best fit initial trees by Modeltest
3.7. The phylogenetic trees were visualized using Figtree (v1.4.3).
Molecular marker development
The sequence regions on the CPG with high nucleotide diversity and over three SSRs were selected as the
candidate DNA barcode. Each candidate DNA barcode was used to construct phylogenetic tree for
validating its efficiency, the alignment length, variable sites, information sites and bootstrap values using
MEGA software. The discrimination success resulted from the comparation with the phylogenetic tree
construct from candidate DNA barcode and all protein-coding gene sequences with the most credibility in
this study.
Declarations
Ethics approval and consent to participate
Page 14/27Not applicable.
Consent for publication
Not applicable.
Competing interests
All authors declare no competing interests.
Funding
This work was supported by the earmarked fund for Jiangxi Agriculture Research System (JXARS-19)
and the National Science Foundation of China project (32060683), the Science Foundation of Jiangxi
Province project (20202ACBL215006), and the Science and Technology Foundation of Jiangxi Provincial
Department of Education (GJJ180218).
Authors’ contributions
Qianglong Zhu: Investigation, Writing - original draft. Bicong Li: Data curation. Tao Liu: Resources. Asjad
Ali, Nan Shan, Jingyu Sun: Writing - review & editing. Qinghong Zhou, Yao Xiao: Conceptualization.
Qianglong Zhu: Supervision. Qianglong Zhu: Project administration, Qianglong Zhu, Yingjin Huan,
Qinghong Zhou: Funding acquisition.
Acknowledgments
Not applicable.
Authors’ information
1 College of Agronomy, Jiangxi Agricultural University, Nanchang, 330045, P.R. China,
2 Queensland Department of Agriculture and Fisheries, PO Box 1054, Mareeba, QLD 4880, Australia.
Availability of data and materials
The genome raw reads have been deposited in the China National GeneBank (CNGB) under a Project
accession: CNP0001850. The three complete chloroplast genomes (MN972441, MN972442, MW628970)
Page 15/27have been deposited and available in National Center for Biotechnology Information (NCBI). The
materials are available from the corresponding author on reasonable request after the publication of the
work.
References
1. Henriquez C, Abdullah, Ahmed I, Carlsen M, Zuluaga A, Croat T, McKain M. Evolutionary dynamics of
chloroplast genomes in subfamily Aroideae (Araceae). Genomics. 2020;
doi:10.1016/j.ygeno.2020.01.006.
2. Choi K, Park K, Park SJ. The Chloroplast Genome ofSymplocarpus renifolius: A Comparison of
Chloroplast Genome Structure in Araceae. Gene. 2017; 8(11):324. doi:10.3390/genes8110324.
3. Henriquez CL, Arias T, Pires JC, Croat TB, Schaal BA. Phylogenomics of the plant family Araceae.
Molecular Phylogenetics and Evolution. 2014; 75:91–102. doi:10.1016/j.ympev.2014.02.017.
4. Chair H, Traore RE, Duval MF, Rivallan R, Mukherjee A, Aboagye LM, Van Rensburg WJ,
Andrianavalona V, Pinheiro de Carvalho MA, Saborio F et al. Genetic Diversification and Dispersal of
Taro (Colocasia esculenta (L.) Schott). PloS one. 2016; 11(6):e0157712.
doi:10.1371/journal.pone.0157712.
5. Liu Y, Fu W, Cai Z, Long C. Analysis of nutritive components and heavy metals in Colocasia gigantea.
Food research and development. 2016;37(21):119–122.
6. Isah T. Changes in the biochemical parameters of albino, hyperhydric and normal green leaves of
Caladium bicolor cv. “Bleeding hearts” in vitro long-term cultures. Journal of Photochemistry and
Photobiology B: Biology. 2019; 191:88–98. doi:10.1016/j.jphotobiol.2018.12.017.
7. Akhigbemen A, Ozolua R, Bafor E, Okwuofu E: Subacute toxicological profile of Caladium bicolor
Aiton (Araceae) methanolic leaf extract in rat. Journal of Pharmacy & Pharmacognosy Research
2018, 6:503–516.
8. Akhigbemen AM, Ozolua RI, Bafor EE, Okwuofu EO. Evaluation of some neuropharmacological
effects of Caladium bicolor aiton (araceae) leaf extracts in mice. Metabolic Brain Disease. 2019;
34(2):537–544. doi:10.1007/s11011-019-0390-z.
9. Lim T. Edible Medicinal And Non-Medicinal Plants. In., vol. 5. 2013; 6–18. doi:10.1007/978-94-007-
5653-3_2.
10. Vela-Gutiérrez G, Velázquez López AA, Tacias Pascacio VG, Vidal López DG, León García E, De La
Cruz Medina J. Effect of heat treatment on oxalate and hydrocyanic acid levels of malanga corms of
two cultivars (Xanthosoma sagittifolium and Colocasia esculenta) in a murine model. Journal of
Food Science and Technology. 2021; doi:10.1007/s13197-021-05004-9.
11. Boakye AA, Gudjónsdóttir M, Skytte JL, Chronakis IS, Wireko-Manu FD, Oduro I. Characteristics of
Xanthosoma sagittifolium roots during cooking, using physicochemical analysis, uniaxial
compression, multispectral imaging and low field NMR spectroscopy. Journal of Food Science and
Technology. 2017; 54(9):2670–2683. doi:10.1007/s13197-017-2704-7.
Page 16/2712. Offei SK, Asante IK, Danquah EY. Genetic structure of seventy cocoyam (Xanthosoma sagittifolium,
Linn, Schott) accessions in Ghana based on RAPD. Hereditas. 2004; 140(2):123–128.
doi:10.1111/j.1601-5223.2004.01725.x.
13. Xue S, Shi T, Luo W, Ni X, Iqbal S, Ni Z, Huang X, Yao D, Shen Z, Gao Z. Comparative analysis of the
complete chloroplast genome among Prunus mume, P. armeniaca, and P. salicina. Horticulture
research. 2019; 6(1):89. doi:10.1038/s41438-019-0171-1.
14. Song Y, Chen Y, Lv J, Xu J, Zhu S, Li M, Chen N. Development of chloroplast genomic resources for
Oryza species discrimination. Frontiers in plant science. 2017; 8(1854).
doi:10.3389/fpls.2017.01854.
15. Mader M, Pakull B, Blanc-Jolivet C, Paulini-Drewes M, Bouda ZH, Degen B, Small I, Kersten B.
Complete chloroplast genome sequences of four Meliaceae species and comparative analyses.
International journal of molecular sciences. 2018; 19(3). doi:10.3390/ijms19030701.
16. Hollingsworth PM. Refining the DNA barcode for land plants. Proceedings of the National Academy
of Sciences of the United States of America. 2011; 108(49):19451–19452.
doi:10.1073/pnas.1116812108.
17. Cui H, Ding Z, Zhu Q, Wu Y, Qiu B, Gao P. Comparative analysis of nuclear, chloroplast, and
mitochondrial genomes of watermelon and melon provides evidence of gene transfer. Scientific
Reports. 2021; 11(1):1595. doi:10.1038/s41598-020-80149-9.
18. Cao T, Ma X, Zhang Y, Su W, Li B, Zhou Q, Zhu Q. The complete chloroplast genome sequence of the
Pueraria lobata (Willd.) Ohwi (Leguminosae). Mitochondrial DNA Part B. 2020; 5(3):3772–3774.
doi:10.1080/23802359.2020.1835576.
19. Sun J, Sun R, Liu H, Chang L, Li S, Zhao M, Shennan C, Lei J, Dong J, Zhong C et al. Complete
chloroplast genome sequencing of ten wild Fragaria species in China provides evidence for
phylogenetic evolution of Fragaria. Genomics. 2021; 113(3):1170–1179.
doi:10.1016/j.ygeno.2021.01.027.
20. Kang SH, Lee HO, Shin MJ, Kim NH, Choi BS, Kumar M, Ali A, Lee SC, Kim CK. The complete
chloroplast genome sequence of Coix lacryma-jobi L. (Poaceae), a cereal and medicinal crop.
Mitochondrial DNA Part B. 2018; 3(2):980–981. doi:10.1080/23802359.2018.1507653.
21. Yin J, Jiang L, Wang L, Han X, Guo W, Li C, Zhou Y, Denton M, Zhang P. A high-quality genome of taro
(Colocasia esculenta (L.) Schott), one of the world's oldest crops. Molecular ecology resources. 2020;
21 (1): 68–77. doi:10.1111/1755-0998.13239.
22. Ahmed I, Biggs PJ, Matthews PJ, Collins LJ, Hendy MD, Lockhart PJ. Mutational dynamics of aroid
chloroplast genomes. Genome Biol Evol. 2012; 4(12):1316–1323. doi:10.1093/gbe/evs110.
23. Abdullah, Henriquez CL, Croat TB, Poczai P, Ahmed I. Mutational Dynamics of Aroid Chloroplast
Genomes II. Frontiers in genetics. 2020; 11:610838. doi:10.3389/fgene.2020.610838.
24. Rozas J, Ferrer-Mata A, SÃ nchez-DelBarrio JC, Guirao-Rico S, Librado P, Ramos-Onsins SE, Sã n-GA.
DnaSP 6: DNA Sequence Polymorphism Analysis of Large Datasets. Molecular Biology & Evolution.
2017; 34(12). doi:10.1093/molbev/msx248.
Page 17/2725. Zhang X, Zhou T, Yang J, Sun J, Ju M, Zhao Y, Zhao G. Comparative Analyses of Chloroplast
Genomes of Cucurbitaceae Species: Lights into Selective Pressures and Phylogenetic Relationships.
Molecules. 2018; 23:2165. doi:10.3390/molecules23092165.
26. Shi H, Yang M, Mo C, Xie W, Liu C, Wu B, Ma X. Complete chloroplast genomes of two Siraitia Merrill
species: Comparative analysis, positive selection and novel molecular marker development. PloS
one. 2019; 14(12):e0226865.doi:10.1371/journal.pone.0226865.
27. Sebastian P, Schaefer H, Telford IR, Renner SS. Cucumber (Cucumis sativus) and melon (C. melo)
have numerous wild relatives in Asia and Australia, and the sister species of melon is from Australia.
Proceedings of the National Academy of Sciences of the United States of America. 2010;
107(32):14269–14273. doi:10.1073/pnas.1005338107.
28. Zhang X, Zhou T, Kanwal N, Zhao Y, Bai G, Zhao G. Completion of Eight Gynostemma BL.
(Cucurbitaceae) Chloroplast Genomes: Characterization, Comparative Analysis, and Phylogenetic
Relationships. Frontiers in plant science. 2017; 8:1583. doi:10.3389/fpls.2017.01583.
29. Henriquez CL, Abdullah, Ahmed I, Carlsen MM, Zuluaga A, Croat TB, McKain MR. Molecular evolution
of chloroplast genomes in Monsteroideae (Araceae). Planta. 2020; 251(3):72. doi:10.1007/s00425-
020-03365-7.
30. Rousseau-Gueutin M, Huang X, Higginson E, Ayliffe M, Day A, Timmis JN. Potential functional
replacement of the plastidic acetyl-CoA carboxylase subunit (accD) gene by recent transfers to the
nucleus in some angiosperm lineages. Plant physiology. 2013; 161(4):1918–1929.
doi:10.1104/pp.113.214528.
31. Kode V, Mudd EA, Iamtham S, Day A. The tobacco plastid accD gene is essential and is required for
leaf development. The Plant journal: for cell and molecular biology. 2005; 44(2):237–244.
doi:10.1111/j.1365-313X.2005.02533.x.
32. Madoka Y, Tomizawa K, Mizoi J, Nishida I, Nagano Y, Sasaki Y. Chloroplast transformation with
modified accD operon increases acetyl-CoA carboxylase and causes extension of leaf longevity and
increase in seed yield in tobacco. Plant & cell physiology. 2002; 43(12):1518–1525.
doi:10.1093/pcp/pcf172.
33. Hertel S, Zoschke R, Neumann L, Qu Y, Axmann IM, Schmitz-Linneweber C. Multiple checkpoints for
the expression of the chloroplast-encoded splicing factor MatK. Plant physiology. 2013;
163(4):1686–1698. doi:10.1104/pp.113.227579.
34. Wang X, Cheng F, Rohlsen D, Bi C, Wang C, Xu Y, Wei S, Ye Q, Yin T, Ye N. Organellar genome
assembly methods and comparative analysis of horticultural plants. Horticulture research. 2018;
5(1):3. doi:10.1038/s41438-017-0002-1.
35. Agrama HA, McClung AM, Yan W. Using minimum DNA marker loci for accurate population
classification in rice (Oryza sativa L.). Molecular Breeding. 2012; 29(2):413–425.
doi:10.1007/s11032-011-9558-x.
36. Group CPW. A DNA barcode for land plants. Proceedings of the National Academy of Sciences of the
United States of America. 2009; 106(31):12794. doi:10.1073/pnas.0905845106.
Page 18/2737. Bankevich A, Nurk S, Antipov D, Gurevich AA, Dvorkin M, Kulikov AS, Lesin VM, Nikolenko SI, Pham S,
Prjibelski AD et al. SPAdes: a new genome assembly algorithm and its applications to single-cell
sequencing. Journal of Computational Biology. 2012; 19(5):455–477. doi:10.1089/cmb.2012.0021.
38. Shi L, Chen H, Jiang M, Wang L, Wu X, Huang L, Liu C. CPGAVAS2, an integrated plastome sequence
annotator and analyzer. Nucleic acids research. 2019; 47(W1):W65-W73. doi:10.1093/nar/gkz345.
39. Tillich M, Lehwark P, Pellizzer T, Ulbricht-Jones ES, Fischer A, Bock R, Greiner S. GeSeq - versatile and
accurate annotation of organelle genomes. Nucleic acids research. 2017;45 (W1):W6-W11.
doi:10.1093/nar/gkx391.
40. Stephan, Greiner, Pascal, Lehwark, Ralph, Bock. OrganellarGenomeDRAW (OGDRAW) version 1.3.1:
expanded toolkit for the graphical visualization of organellar genomes. Nucleic acids research. 2019;
47(W1):W59–W64. doi:10.1093/nar/gkz238.
41. Schwartz S, Zhang Z, Frazer KA, Smit A, Riemer C, Bouck J, Gibbs R, Hardison R, Miller W. PipMaker–
a web server for aligning two genomic DNA sequences. Genome research. 2000; 10(4):577.
doi:10.1101/gr.10.4.577.
42. Gao F, Chen C, Arab DA, Du Z, He Y, Ho SYW. EasyCodeML: A visual tool for analysis of selection
using CodeML. Ecology and Evolution. 2019;3891–3898. doi:10.1002/ece3.5015.
43. Kumar S, Stecher G, Li M, Knyaz C, Tamura K: MEGA X. Molecular Evolutionary Genetics Analysis
across computing platforms. Molecular Biology & Evolution. 2018; 35(6):1547–1549. doi:
10.1093/molbev/msy096.
Figures
Page 19/27Figure 1
Chloroplast genome maps of C. gigantea (A), C. bicolor (B) and X. sagittifolium (C) with annotated genes.
Genes inside the circle are transcribed clockwise, while those outsides are counterclockwise. Genes are
color coded according to functional groups. Boundaries of the small single copy (SSC) and large single
copy (LSC) regions and inverted repeat (IRa and IRb) regions are denoted in the inner circle for each
species.
Page 20/27Figure 2
The correlational relationship among chloroplast genome size, LSC, SSC and IR regions (A-F).
Page 21/27Figure 3
Comparison of border distances between adjacent genes and junction of the LSC, IR, and SSC regions
among the 17 Aroideae chloroplast genomes. Number above the gene shows the distance between the
ends of genes and the border sites. The figure is not to scale with respect to sequence length.
Page 22/27Figure 4
Structure comparison of seventeen chloroplast genomes using MultiPipMaker program. Black arrows and
thick black lines above the alignment indicate genes with their orientation such as the cyan strip: LSC,
yellow strip: IRs, blue strip: SSC, respectively. Pink strips represent different chloroplast genomes, green
bars: mismatch and white bars: indel.
Page 23/27Figure 5
Comparison of nucleotide diversity (Pi) value for 130 coding regions and 131 intergenic regions among
thirteen species in Aroideae.
Page 24/27Figure 6
The type and presence of repeated units and SSRs in the chloroplast genomes of seventeen Aroideae
species. (A) Number of three‐types of repeats; (B) Number of SSRs and their types.
Page 25/27Figure 7
Phylogenetic relationship of the 17 species inferred from ML analyses based on the 79-consensus
protein-coding sequences. The bootstrap values of ML analyses are shown beside the node of clades.
Alisma plantago-aquatica was used as the outgroups. C. gigantea, C. bicolor and X. sagittifolium were
marked in bold characters and red branches.
Page 26/27Figure 8
Phylogenetic tree for 17 Aroideae species using the CDS of 79 protein-coding genes and atpH-atpI +
psaC-ndhE + trnS-trnG DNA barcode combinations.
Supplementary Files
This is a list of supplementary files associated with this preprint. Click to download.
AdditionalfileFigures.docx
AdditionalfileTables.xlsx
Page 27/27You can also read