Comparison of camera equipment for photogrammetric digitization of hard rock tunnel faces - Markus Prittinen
←
→
Page content transcription
If your browser does not render page correctly, please read the page content below
Master’s Programme in Geoengineering

Comparison of camera equipment for
photogrammetric digitization of hard rock
tunnel faces
Markus Prittinen

 26.04.2021                            Master’s Thesis
                                       2021
Copyright ©2021 Markus Prittinen

                                   ii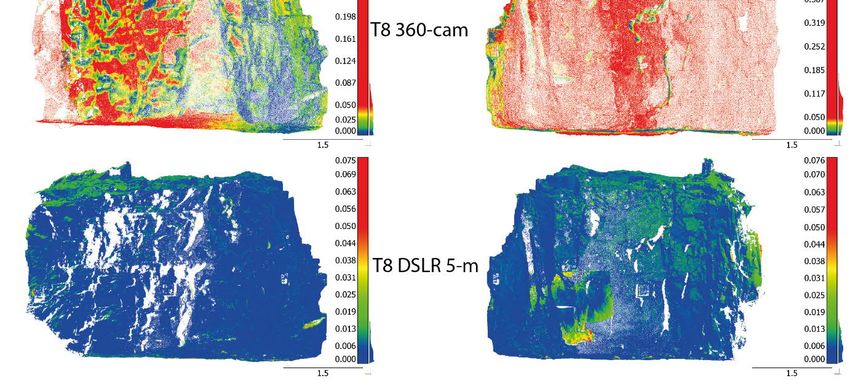
Author Markus Prittinen

Title of thesis Comparison of camera equipment for photogrammetric digitization of
hard rock tunnel faces
Programme Geoengineering

Major Rock engineering

Thesis supervisor Prof. Jussi Leveinen
Thesis advisor Dr Mateusz Janiszewski

Date 26.04.2021          Number of pages 62 + 16                Language English

Abstract

It is important to have good data for making safe tunnel designs. An understanding of the
prevailing discontinuities is crucial to evaluate the quality of the rock mass and reinforce-
ment needs. Photogrammetry using Structure-from-Motion is a 3D-scanning technique
from which one can make 3D representations of real-life objects using 2D-photos. The 3D-
models allows for more automated and faster discontinuities mapping than traditional
compass methods. The research location is the Underground Research Laboratory of Aalto
University (URLA), which is a tunnel complex located in underneath Otaniemi campus at
Aalto University in Espoo Southern Finland.
    The research questions are: What are the challenges in tunnel photogrammetry? What
are the most efficient methods in capturing tunnel environments? Are 360- and action cam-
eras a viable alternative to more traditional photogrammetry methods using DSLR cam-
eras? Do the methods used produce 3D-models good enough for identifying rock futures
and for doing measurements and discontinuity mapping?
    In this thesis different cameras are compared for Structure-from-Motion photogram-
metry, a DSLR camera, a 360-camera, and a GoPro rig that was developed during the re-
search. The GoPro rig combines four GoPro action cameras using a plastic frame and 3D-
printed parts and can be used both handheld and on a tripod. An experiment is done using
constraints for how close to an unsupported walls work can be done, to simulate a tunnel
under construction. The accuracy, speed and resolution of each method is measured. The
geometric accuracy is compared with measurements from a laser measurement tool. Tra-
ditional compass measurements of discontinuity sets are compared with measurements
from 3D-models gathered, including semi-automated measurements of discontinuities in
Discontinuity Set Extractor. The results show that out of the methods compared the DSLR
method is most accurate and the 360-camera least accurate, yet each method produces a
point cloud accurate enough for automatic discontinuity set measurements. Out of the
methods tested the GoPro rig was proven to be both the fastest and cheapest method in
acquiring images for photogrammetry.

Keywords Photogrammetry. Structure-from-Motion. Mining. Tunnelling. Underground
Research Laboratory of Aalto University.

                                                  iii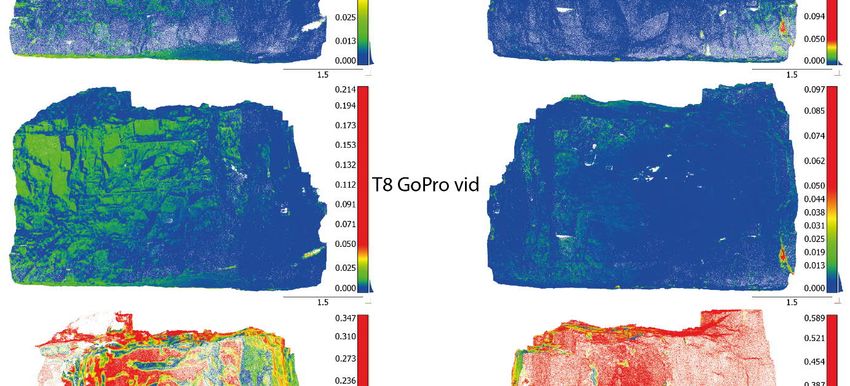
Författare Markus Prittinen

Titel Jämförelse av kamerautrustning för digitalisering av bergstunnelytor med hjälp av
fotogrammetri
Utbildningsprogram Geoteknik

Huvudämne Bergmekanik

Ansvarslärare Prof. Jussi Leveinen
Handledare Dr Mateusz Janiszewski

Datum 26.04.2021               Sidantal 62 + 16                    Språk Engelska

Sammandrag

Det är viktigt att ha tillgång till bra data för att designa säkra tunnlar. En bra förståelse för
rådande diskontinuiteter, eller sprickplan, krävs för att utvärdera bergmassans kvalitet och
behov av förstärkning. Structure-from-Motion fotogrammetri är en teknik som möjliggör
tredimensionell skanning av objekt med hjälp av tvådimensionell fotografering. 3D-mo-
dellerna möjliggör mer automatisk och snabbare kartläggning av diskontinuiteter än trad-
itionella kompassmetoder. Forskningen görs i det underjordiska forskningslaboratoriet vid
Aalto-universitetet (URLA), ett tunnelkomplex som ligger under Otnäs campus vid Aalto-
universitetet i Esbo i södra Finland.
    Forskningsfrågorna är: Vilka är utmaningarna i tunnelfotogrammetri? Vilken fotogra-
feringsmetod är mest effektiv för tunnlar? Är 360- och actionkameror ett användbart alter-
nativ till mer traditionella fotogrammetri-metoder med DSLR-kameror? Är resultatet av
metoderna tillräckligt bra för att identifiera bergmassans egenskaper och för att göra mät-
ningar och diskontinuitetskartläggning?
    I denna avhandling jämförs olika kameror för Structure-from-Motion-fotogrammetri –
en DSLR-kamera, en 360-kamera och en GoPro-rigg som utvecklades under forskningen.
GoPro-riggen kombinerar fyra GoPro-actionkameror med en ram i plast och 3D-ustrivna
delar som kan användas både handhållen och på stativ. Ett experiment görs för att simulera
en tunnel under uppbyggnad med begränsningar för hur nära en vägg som inte stöds kan
utföras. Noggrannheten, hastigheten och upplösningen för varje metod mäts. Noggrann-
heten jämförs med mätningar från ett lasermätverktyg. Traditionella kompassmätningar
av sprickplan jämförs med mätningar från 3D-modeller, inklusive halvautomatiserade
mätningar av diskontinuiteter i Discontinuity Set Extractor. Resultaten visar att DSLR-me-
toden är mest geometriskt exakt och 360-kameran minst exakt. Dock producerar varje me-
tod ett resultat som är tillräckligt exakta för automatiska mätningar av diskontinuitet. Av
metoderna som testas i avhandlingen visade sig GoPro-riggen vara både snabbast och bil-
ligast.

Nyckelord Fotogrammetri. Structure-from-Motion. Gruvdrift. Tunnel. Underground
Research Laboratory of Aalto University.

                                                    iv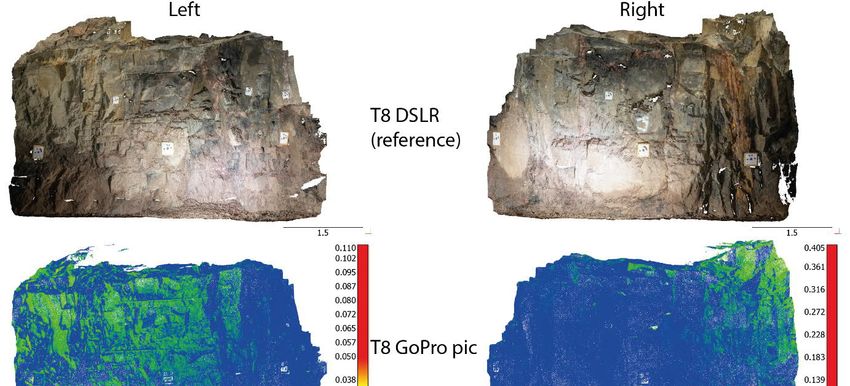
Preface

Firstly, I want to thank Professor Jussi Leveinen for all the help in trying to find a suitable
and interesting topic during the challenging times of the pandemic.

I want to thank Dr Mateusz Janiszewski for the help in developing the research topic and for
the fast answers to my questions. Mateusz acted as great support during the thesis work and
helped with many of the technical aspects from compass measurements to photographing
and provided clever solutions to some of the problems.

I also want to thank Otto Hedström for giving me access to the Aalto research tunnel every
time I needed it even with the challenges of the Covid-19 pandemic, for the logistical help
down in the tunnel and for his input.

Lastly, I want to thank my greatest supporter and wife Louise for keeping me motivated and
keeping me company during the otherwise socially distanced 2020 and 2021.

Otaniemi, 31 March 2021
Markus Prittinen

                                              v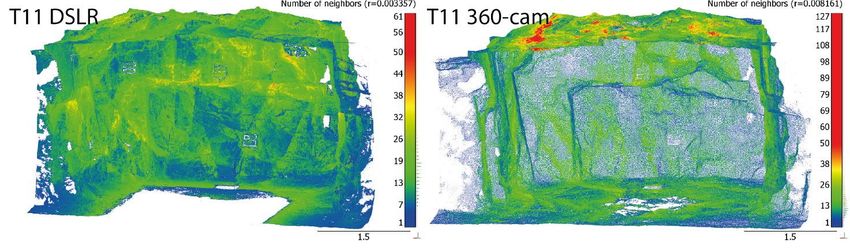
Table of Contents
Abstract ..............................................................................................................................iii

Abstract (in Swedish) .......................................................................................................... iv

Preface ................................................................................................................................. v

Table of Contents ................................................................................................................. 1

Abbreviations....................................................................................................................... 3

1     Introduction ................................................................................................................. 4

    1.1     Research problem ................................................................................................... 4

    1.2     Aim and objectives.................................................................................................. 5

    1.3     Scope of the Study .................................................................................................. 5

    1.4     Thesis structure ...................................................................................................... 6

2     Background .................................................................................................................. 7

    2.1     Photogrammetry ..................................................................................................... 7

      2.1.1        Camera systems ............................................................................................... 9

    2.2     Automatic rock discontinuity mapping ................................................................. 10

    2.3     Description of the Aalto research tunnel................................................................ 11

    2.4     Photo settings and its influence on image quality ................................................. 12

3     Data acquisition .......................................................................................................... 14

    3.1     Photo locations ..................................................................................................... 14

    3.2     Hardware .............................................................................................................. 17

    3.3     Developing the GoPro rig ...................................................................................... 19

      3.3.1        Plastic tube frame.......................................................................................... 20

      3.3.2        3D printed camera mounts............................................................................. 21

    3.4     Setting up lights .................................................................................................... 22

    3.5     Photo settings ....................................................................................................... 24

      3.5.1        Insta360 Pro .................................................................................................. 25

      3.5.2        GoPro ............................................................................................................. 26

                                                                    1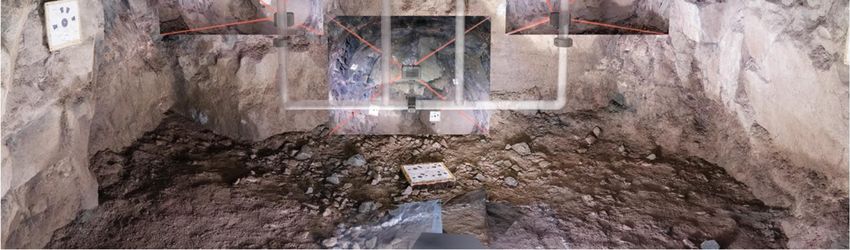
3.5.3       Canon DSLR................................................................................................... 27

    3.6     Photo editing ........................................................................................................ 29

    3.7     Mapping discontinuities ....................................................................................... 29

4     Data analysis and results ............................................................................................ 31

    4.1     3D mesh calculating models ................................................................................. 31

      4.1.1       Reality capture workflow................................................................................ 31

    4.2     Comparing results from different photo-techniques ............................................. 33

    4.3     CloudCompare and Discontinuity Set Extractor ................................................... 45

5     Discussion .................................................................................................................. 51

    5.1     Limitations of the data acquisition ....................................................................... 51

    5.2     Limitations of the software ................................................................................... 55

    5.3     Limitations of photogrammetry ............................................................................ 55

6     Conclusion .................................................................................................................. 57

7     Recommendations for future research........................................................................ 58

References ......................................................................................................................... 59

      Model results .............................................................................................................. 63

      Reality capture workflow ............................................................................................68

      DSE workflow ............................................................................................................. 74

                                                                  2
Abbreviations

CAD        Computer-Aided Design
COVE       Conceptual Orienteering in Virtual Education
DoF        Depth of Field
DSE        Discontinuity Set Extractor
DSLR       Digital Single-Lens Reflex
EDUROCK Educational virtual Rock collection
FoV        Field of View
GPS        Global Positioning System
LiDAR      Light detection and ranging
MIEDU      Mining Education and Virtual Underground Rock Laboratory
SfM        Structure from Motion
URLA       Underground Research Laboratory of Aalto University
μm         Micrometre, micron

                                            3
1 Introduction
Mining and infrastructure tunnels both have a need for detailed tunnel mapping. In Finland,
several large infrastructure tunnelling developments are planned for the near future. One of
the largest tunnel projects in the last decade was the western metro extension in Helsinki
and Espoo. The extensions, which are done in two stages, have been estimated to cost 1.5
billion euro. Another potential future tunnel project in Finland is the FinEst link, which is a
railway tunnel that would run under the Gulf of Finland connecting Finland and Estonia.
The total cost is estimated to be 13-20 billion euro. The need for tunnel mapping is not lim-
ited to infrastructure. Mining is a big industry in Finland and several of the operations are
underground mines. According to official figures from 2016 the mining industry in Finland
has a yearly turnover of about 2 billion euro and there are around 40 active mines (City of
Helsinki 2021, Vasara 2018, FinEst Link 2018).

1.1 Research problem
Jastrzebski (2018) recommends using 3D-models of tunnels and underground structures in
education. The ongoing Covid-19 pandemic has exposed the need for remote education and
good quality learning materials that can be accessed from home. The MIEDU (Mining Edu-
cation and Virtual Underground Rock Laboratory), EDUROCK (Educational virtual Rock
collection) and COVE (Conceptual Orienteering in Virtual Education) projects at Aalto uni-
versity developed methods to digitize rock collections and outcrops for virtual tunnel map-
ping exercises (Zhang 2020, Janiszewski et al. 2020a, Janiszewski et al. 2020b). Good qual-
ity models are important for immersion. Tangential to education is visualisation, Donati et
al. 2019 showcased the benefit of using 3D-models for visualisation of mines using mixed
and virtual reality.
   Getting good data will help save money while keeping tunnels safe. By comparing differ-
ent 3D models there is a possibility to monitor changes in the tunnel faces such as defor-
mations, water leaks or labour. 3D-models of tunnels have conventionally been captured by
laser scanning but SfM (Structure from Motion) photogrammetry is becoming increasingly
popular as photogrammetry software, modelling software and camera solutions become
more capable (Cawood et al. 2017, Francioni et al. 2019).
   Photogrammetry using Structure from Motion is a scanning technique which allows for
the use of conventional cameras to create 3D meshes and point clouds. This thesis explores
how tunnel mapping using photogrammetry is done and what the challenges are. It explores
the potential benefits and drawbacks of using different camera setups in tunnel

                                              4
photogrammetry, this includes a conventional DSLR (Digital Single-Lens Reflex) camera, a
multi sensor 360-degree camera and a photo rig developed for the thesis that couples several
action cameras for good image overlap. 360-cameras have been shown to be an effective tool
in architectural photogrammetry, where the 360-view has shown to be beneficial in long
corridors and other narrow spaces (Barazzetti et al. 2018). These benefits should conse-
quently apply for scanning narrow underground spaces and tunnels.
  Furthermore, discontinuities set mapping using a semi-automated method with Discon-
tinuities Set Extractor (DSE) is studied and compared with compass measurements.

1.2 Aim and objectives
The aim of the research is to compare different Structure-from-Motion photogrammetry
methods in an underground environment and quantify the difference in quality, time con-
sumption and expense. The thesis aims to map out how tunnel photogrammetry is done by
the industry and what the common challenges are. The research explores software that can
be used to achieve good photogrammetry results and software that helps making fracture
and discontinuities mapping more automated. The results from automated discontinuity
measurements are then compared to the results of the traditional manual approach.

  The research questions are:
  What are the challenges in tunnel photogrammetry?
  What are the most efficient methods in capturing tunnel environments using Structure-
from-Motion photogrammetry?
  Are 360- and action cameras a viable alternative to more traditional photogrammetry
methods using DSLR cameras?
  Do the methods used produce 3D-models good enough for identifying rock types and fu-
tures? Are they accurate enough for doing measurements and discontinuity mapping?

1.3 Scope of the Study
This thesis is limited to the mapping of hard rock tunnels. 3D-scanning is executed with
different camera systems using Structure-from-Motion photogrammetry. The research lo-
cation is limited in size and is not operational or under construction. This means the meth-
ods described are more suited to small scale tunnels and underground caverns. Moreover,
constraints in operational mining operations may affect how data acquisition is done. Con-
ditions with a tunnel under construction are simulated using limitations on how close to

                                             5
unsupported walls work can be done. However, other challenges that are present in opera-
tional tunnelling conditions were not simulated, e.g., time constraints and a dusty environ-
ment. The tunnel locations are in relatively shallow depth and the rock is of good quality.
The tunnel researched has been excavated using drilling and blasting.
1.4 Thesis structure
This thesis is divided into seven chapters, including this introduction.
Chapter 2, background. Describes photogrammetry as a field of research and the location
of the research, the Underground Research Laboratory of Aalto University (URLA).
Chapter 3, methods for data acquisition. Describes the data acquisition and results and
how the software was used.
Chapter 4, data analysis and results.
Chapter 5, discussion of the findings from the research.
Chapter 6, conclusions.
Chapter 7, recommendations for future research.
62 Background
This chapter describes the state of art in the field of study, SfM (Structure from motion)
photogrammetry and 3D-scanning of tunnels. The chapter also includes a description of the
location for the research.
2.1 Photogrammetry
Structure from motion SfM is a technique of capturing 3D models with a series of 2D photos.
The photogrammetry software recognizes similar features from overlapping photos and
plots points in 3D/space through triangulation. Unlike traditional photogrammetry meth-
ods, SfM enables the use of non-calibrated cameras and does not need coordinate ground
control points for triangulation. This means low-cost consumer grade cameras can be used
for cheap and fast 3D-reconstruction A diagram of how SfM works is shown in Figure 1, the
motion comes from the moving camera and the algorithm constructs the 3-dimensional
shape from getting image data from different angles and vantage points (Westoby et al. 2012,
Schönberger & Frahm Jun 2016).
Figure 1. A diagram of how SfM Photogrammetry works (Thormählen et al. 2004)
7SfM uses compute vision techniques for simultaneous feature matching images and cal-
culating camera positions in 3D-space. Images are matched through image pairs, and the
algorithm goes through all image pair combinations to find matching futures (Colomina &
Molina 2014, Xue et al. 2020).
To make good, safe tunnel designs, you need good data. In tunnels the roof and walls need
to be secured by support structures i.e., bolts and concrete. Data is gathered with different
approaches, some more automated than others. Data gathering is also important in meas-
uring the quality of work done to the tunnel, detecting defects and displacements (Attard et
al. 2018). Photogrammetry could help in these regards, as it allows for comparing point
clouds taken of the same structure and analysing the changes that have happened. The
changes could be displacement or labour. Shotcrete thickness has been analysed using Li-
DAR scanning (Light detection and ranging) (Fekete et al. 2010), and if similar accuracy is
achieved using SfM photogrammetry, it could potentially be used for the same application.
Tunnel inspections need to be done to ensure safety. Inspections are done as the tunnel
is being built and throughout its design life. By doing inspections often you can detect issues
and hazards early and this ensures safe operation and speedy repairs (Attard et al. 2018).
Reducing the data gathering time is important as it is usually done by highly qualified staff
whose time is valuable and could spend the time doing other work. Time savings also allows
for more frequent measurements. Making data gathering faster also leads to improvements
in safety, as tunnels can be hazardous environments and workers would need spend less
time unprotected inside them (Panella et al. 2020).
Compared to other techniques like laser 3D-scanning or LiDAR, the SfM photogramme-
try approach has the benefit of producing real life colours. Yet, this is only a drawback for
some LiDAR systems as others combine image sensors to get colour data (Chandler & Buck-
ley 2016). By colouring the point cloud, rock types can be identified, and it is easier to im-
plement the point cloud into 2D-reports and plans (Panella et al. 2020). Another benefit of
SfM when compared to LiDAR is that the cost of the equipment can be much lower, as SfM
photogrammetry data can even be gathered with common smartphones (Chandler & Buck-
ley 2016). Research has also shown that thanks to the flexibility of the SfM method, it can
give better results as data is not gathered from a single vantage point, and the camera can
be moved around capturing more angles than a stationary LiDAR scanner. Meaning the SfM
method can capture geometry that is obstructed from where LiDAR scanner would be sta-
tioned (Cawood et al. 2017).
8Photogrammetry in tunnels and other underground structures differs in several ways
from the photogrammetry done on the surface. The lack of light creates its own set of issues
and clever lighting techniques need to be used, thus lighting is something much of the re-
search on the subject discusses. Tunnels typically have poor or uneven lighting, and in some
cases no installed lighting fixtures. Power availability might be another issue, meaning you
need to use battery powered lights. Speed of data acquisition in tunnels is important as sup-
ports need to be installed soon after blasting, this means speed should sometimes be fa-
voured over accuracy (Bauer et al. 2015).
2.1.1 Camera systems
Different camera setups with a wide range of budgets can be used for SfM photogrammetry.
This includes DSLR (Digital Single-Lens Reflex) and mirrorless cameras coupled with dif-
ferent lens combinations, point and shoot cameras, action cameras, 360-cameras, and
smartphones. All have different properties, disadvantages, and advantages.
DSLR cameras are flexible options for photogrammetry as lenses can be swapped out for
different use cases. In the case of tunnels where the 3D scene is narrow, a wide lens saves
capture time due to the large field of view (FoV). The wide lens allows for lots of overlap
while keeping the number of pictures manageable. The interchangeability of lenses and the
wide range of DSLR cameras available means that they can be acquired in a wide range of
budgets.
Images with the DSLR are typically captured with a tripod and framing adjusted by mov-
ing or adjusting the angle of the tripod head. This means that the capture can be quite slow,
and that even with a wide-angle lens slower than a 360-degree camera that do not need angle
adjustments.
360 cameras can be acquired for on a low budget, and they are fast, efficient tools for
capturing indoor environments. 360-degree cameras typically comprise of two or more cam-
era sensors mated together. The sensors are equipped with fisheye lenses that lets the sensor
capture a large FoV, with sensors facing different directions covering a 360 sphere around
the camera. This makes it possible to combine the photos into large panoramic images.
Fisheye lenses make data gathering much more manageable and leads to a large reduction
in the number of pictures needed. The advantage of using a fisheye lens becomes clear when
capturing interiors, as less images are needed for a good amount of overlap compared with
camera setups with narrower lenses (Perfetti et al. 2017, Fangi et al. 2018).
9Available research regarding SfM photogrammetry using 360-cameras, focus on cultural
heritage preservation scanning indoor environments. In theory that use case should share
some of the challenges as using 360-cameras in underground tunnel mapping. Complex ge-
ometry and low or ununiform lighting. The research available also typically use the stitched
panorama pictures from the 360-cameras as input for SfM. As an example, Fangi et al. 2018
used stitched, HDR mode, JPEG-images for capturing indoor environments. However, as
the 360-camera used in this thesis allows for significantly more detail when using unstitched
pictures, unstitched images in RAW-file format were favoured.
Action cameras are compact cameras that are robust and lightweight and usually come
equipped with fish-eye lenses providing a large field of view, making them suitable for cap-
turing smaller indoor spaces as less images are needed to capture the geometry and to get
plenty of image overlap. On top of these benefits, these cameras are cheap and high resolu-
tion both in video and photo mode (Panella et al. 2020). Therefore, there is great potential
in using these cameras for photogrammetry.
2.2 Automatic rock discontinuity mapping
Discontinuities are fractures induced by the stress applied on the rock mass over time. These
affect the mechanical strength of the rock mass and are therefore vitally important to map
in rock excavations. The discontinuities also provide paths for water seepage and allows tun-
nel faces to deform. Figure 2 is a visual representation of what discontinuities are (Hudson
& Harrison 1997).
Reinforcement i.e., bolts and shotcrete are planned according to the prevailing rock
joints. As the main failure mechanism in relatively shallow hard rock conditions is gravity
induced failure, the planner must make sure that the blocks formed by discontinuities are
secured. These blocks in the rock mass may fall or slide down from the walls and roof if left
unsupported (Hammett & Hoek 1981).
10Figure 2. Visualization of discontinuities in the rock mass (Hudson & Harrison 1997).
When planning the supports in tunnels the discontinuities can be used as data for opti-
mizations and to make sure that the prevailing risks for failure have been accounted for
(Hammett & Hoek 1981). Along with directions of the discontinuities, automated measure-
ment software can be used to detect the spacing and roughness of discontinuities (Riquelme
et al. 2015). Photogrammetry using SfM produces coloured point clouds or 3D-meshes. The
high-resolution textures produced allow for detecting features impossible to detect with
non-coloured point clouds produced by laser scanners without integrated image sensors,
e.g., observations of the rock types and rock boundaries. Although this thesis focuses on
tunnels with exposed rock faces, some of the same methods used in concrete tunnels apply.
Photogrammetry has been used in concrete tunnels to monitor water ingress, cracks, and
deformations (Attard et al. 2018).
An advantage of doing automated tunnel measurements is that there is no need to spend
much time near an unsupported wall or roof as pictures for photogrammetry can be taken
much faster than doing manual compass measurements. While there are other methods for
capturing 3D-data from tunnels, SfM photogrammetry can be done with cheap readily avail-
able equipment (García-Luna et al. 2019)
2.3 Description of the Aalto research tunnel
Underground Research Laboratory of Aalto University (URLA) has been the subject of dec-
ades of field exercises and rock engineering research and field exercises. The laboratory is
11made up by a series of tunnels and underground spaces and is located underneath Otaniemi
campus at Aalto University in Espoo Southern Finland. Earlier research done in the tunnel
are mainly in the field of rock engineering, including several studies in photogrammetry,
virtual reality (Janiszewski et al. 2020a, Janiszewski et al. 2020b, Jastrzebski 2018).
The main rock type at the Otaniemi campus and in the Underground Research Laboratory
is granite and is surrounded by areas of metamorphic rocks such as amphibolite, schist, and
gneiss (GTK 2021). The tunnel complex is located at shallow depth, from ground level at
access tunnels to around 20 meters depth. It is in a hard rock environment with the main
rock type being granite and it is fractured with several discontinuity sets (Mai 2021) The
walls and roof are partly covered in shotcrete, but the locations used for photogrammetry in
this thesis are not. The locations were chosen due to their limited size and exposed rock.
2.4 Photo settings and its influence on image quality
Camera settings affect the quality of the output image. Several parameters can be adjusted
to optimize the Signal to noise ratio of the output image.
ISO is the sensor sensitivity to light. A larger ISO will make the image brighter but will
introduce more noise and a low ISO means the image is darker but has less noise. A doubling
of ISO will produce an image with double the brightness. By using longer exposures and low
ISO the noise can be reduced while keeping adequate exposure (Mansurov 2019).
Shutter speed is the time that the camera shutter is open in cameras with a mechanical
shutter or in the case of electronic shutters, the time that the sensor records light. Shutter
speed controls the exposure of the image by controlling how long the sensor detects light.
Shutter speeds are described as seconds or fractions of seconds (Mansurov 2021).
The amount of light reaching the sensor can also be adjusted with aperture control. Ap-
erture is the opening of the camera lens. A larger opening lets in more light and a smaller
opening lets in less light. A camera with fixed aperture means that the opening cannot be
adjusted. Aperture is described in F-stops. Aperture is a factor that is gotten from the diam-
eter of the opening in the lens divided by the focal length. For the 14 mm lens used in this
thesis, this would mean that when using F11, the diameter of the aperture is 1.27 mm (Cox
2021).
12Aperture visualized; a smaller aperture means a larger DoF (Photographyproject 2021)
The aperture also controls the DoF or depth of field in the image. A small opening or large
F-number means the image is sharp in a larger range, in other words the DoF is larger. A big
opening means the focus range will be smaller, which is sometimes desirable e.g., in artistic
portrait photos where the subject in interest is in focus while the background has a pleasing
blur or bokeh. However, in the case of tunnel photogrammetry where the geometry is uneven
and the range between the closest subject and the furthest subject is large, a wide DoF is
desirable. Therefore, a small aperture is chosen where possible. Using an online DoF calcu-
lator, the DoF and the ranges with acceptable focus can be calculated. The Canon 5DS R
DSLR camera has a full frame sensor and calculating the DoF with the 14 mm lens at F11,
when the focus distance is 2.5 meters, gives a DoF near limit of 0.47 meters and a far limit
of infinity. Meaning everything from 0.47 m length of the camera will be in focus range
(Nasse 2010, PhotoPills 2021, Malan Francois 2018)
RAW images are uncompressed or using lossless compression and contain more data
than JPEGs. This allows for more flexibility in editing as white balance can be adjusted later
in the photo editing software. The lossless compression of RAW files allows for more adjust-
ments in, colours, highlights, shadows, and exposures (Mansurov 2018).
133 Data acquisition
This chapter describes the methods used for gathering data and contains a description of the
two tunnel locations photographed in this thesis. Lighting can be problematic in tunnel pho-
togrammetry; this chapter contains a section describing the lighting setup used in the thesis.
The chapter also contains a description of the hardware and how the GoPro rig that com-
bines four GoPro cameras for photogrammetry was developed. Additionally, the chapter de-
fines the photo settings used, photo editing as well as how mapping of discontinuities was
performed.
3.1 Photo locations
For the thesis two locations within the Underground Research Laboratory of Aalto Univer-
sity (URLA) tunnel complex were chosen. Both locations are short tunnel openings that con-
nect to longer tunnels, tunnel 8 and 11. These two photo locations shown in Figure 3 and
Figure 4 will be referred to as tunnel 8 and tunnel 11 for short.
The tunnel openings are quite small and can be lit up with stationary lights. Both open-
ings are around 5-meter-wide, 3-4-meter-high and 5 meters deep, with tunnel 8 being the
larger of the two. The size makes comparing different methods of photographing the loca-
tions with the same or similar lighting setup much easier. The adjacent tunnel to the tunnel
11 opening has integrated light fixtures which were on during the photography sessions,
however the integrated lights did not provide much light and the panorama in Figure 4 is lit
by the camera flash. Unfortunately, the amount of light provided to tunnel 11 by the light
fixtures was not measured.
Figure 3. Tunnel 8 opening, out of the two tunnel locations this one is larger.
14Figure 4. Tunnel 11 opening, the smaller location of the two and the adjacent tunnel has integrated light fix-
tures, that partly illuminate the opening, here the opening is illuminated with the camera flash. The Leica laser
measurement tool with tripod used for measuring distance between markers is visible in the foreground.
Markers or control points were attached to both locations in a similar pattern. They are
generated in RealityCapture and are single ring, circular, 20-bit markers. Markers were at-
tached to the walls in a pattern that allows most pictures to have at least one marker in view.
In total eleven markers were attached to the walls in tunnel 8 and ten in tunnel 11. Two sizes
of markers were made, with the size of the circle on the markers 10 cm for the smaller ones
and 15 cm for the bigger ones. In the end the smaller size marker proved to be big enough
on the scale tested, as those were detected as easily by RealityCapture’s marker detection.
All markers were laminated for protection from the high moisture tunnel environment and
wooden boards as backing was added to most of the bigger size markers for rigidity and
easier mounting. Holes were bored into the rock walls and into the markers for mounting,
the markers were then attached by hammering expanding anchor bolts into the boreholes.
An identical alignment board on the ground at both locations shown in Figure 5a makes
it possible to align the model with true north and with the ground plane, as this is needed to
measure discontinuities. The board is levelled horizontally with the markers facing upwards,
by aligning the board to have zero dip using the integrated inclinometer on a smartphone.
For alignment of the 3D-scene to true north, the north direction relative to the marker board
was documented. The idea for the marker board was presented in the paper by García-Luna
et al. (2019)
Scaling the model is done with the alignment table with point 1x20:00101 representing
the origin. A local coordinate system was used as coordinates cannot be acquired by GPS
(Global Positioning System) below ground in the tunnel. As the orientation of the board and
15distance between the markers is known, it is possible to calculate the coordinates of the three
other markers. The orientation of the board has been measured with compass and inclinom-
eter. These coordinates are written down in a text document and imported into the photo-
grammetry software as ground control points. However, you need a fifth known point to get
the z- or elevation axis correct. In other words, the fifth point is needed for the software to
know which way is up. This was achieved by measuring the distance from the origin to a fifth
point on the board. As this point was not a marker that the software could automatically
recognize it was marked manually as control points in the pictures before alignment. Figure
6 shows how the alignment board works. Calculating the coordinates for the markers would
be much easier if a north needle were added and aligning the needle to the north with the
help of a compass. For this thesis, the compass measurement was done after all the models
had already been photographed. Adding a fifth marker point for z-direction alignment would
also speed up the alignment process as the markers can be scaled using the marker coordi-
nates the scale bar is not necessary. Integrating a digital inclinometer to the board would
also improve the effectivity. The proposed improvements are shown in Figure 5b.
a. b.
Figure 5: The marker board used in the thesis a. to the left and an improved design proposal b.
16Figure 6. The alignment board aligns and scales the mesh by having the orientation of the board and the dis-
tances between markers known.
3.2 Hardware
For measuring the distance between markers, the Leica DISTO s910 laser measurement tool
shown in Figure 7a was used. The Leica provides accurate measurements with a claimed
measurement accuracy of around ± 1.0 mm (Leica 2021).
It has several integrated functions including the ability to measure the distance from the
tool to the wall. When the measuring tool is attached to the included tripod it can measure
distances between two points and measure several points and plot them in 3D. The plots can
be extracted from the tool as a DXF-file that can be imported into CAD, Computer-Aided
Design software.
For discontinuities measurements and aligning the mesh with true north a compass was
used, the Bolanke M2 compass shown in Figure 7b allows for dip measurements using an
integrated inclinometer. Although it is a low-quality cheap compass, it proved good enough
for the purpose.
Three main camera setups were used for capturing the rock faces. A 360-degree camera,
a GoPro camera rig integrated lights and a DSLR (Digital Single-Lens Reflex) camera. As a
zoom lens for the canon 5DS R DSLR camera was not readily available at the time for one of
the experiments, a fourth camera system was used. This was a combination of a mirrorless
17camera with a zoom lens (Canon m6 mark ii) and the same DSLR camera with a wide-angle
lens used in the other tests. This setup can be seen in Figure 8d.
The 360-camera used was the Insta360 pro shown in Figure 8b. The camera has six cam-
era sensors with 200-degree fisheye lenses providing a 360-surround view with some over-
lap. Pictures can be extracted as raw wide-angle photos or a stitched orthophoto from all six
sensors. As more detail is preserved in the unstitched images this was chosen over the
stitched panorama option. Trying out a cheaper 360-camera was not seen as necessary, as
there was already some scepticism from the author towards how well a high-end option will
perform in the challenging tunnel environment.
The GoPro rig shown in Figure 8c is made from a combination of four GoPro hero 8
fisheye lens equipped action-cameras facing into slightly different directions. The cameras
are clamped onto and held together with standard 32mm PVC-pipe and pipe connections.
The design for the rig was first made in Fusion 360 CAD software, and then the pipes were
cut to length and attached together.
The photo function on the GoPro did not have the desirable shutter times needed to get
good results. Therefore, the models were captured with the video function of the GoPro and
using a low light time-lapse mode. The video resolution of the cameras was set to the full
sensor resolution, 3000 x 4000 pixels. The video files were converted into PNG-image files
in RealityCapture and then colour corrected before photogrammetric calculations. Even
though the method does not produce RAW images, the photo editing remained mostly the
same. Image editing for all methods can be found on page 29.
The DSLR camera used was a Canon 5DS R with a canon 14 mm F 2.8 lens shown in
Figure 8a. The tunnel openings captured were tight spaces and the wide lens provided good
overlap with few pictures. This meant much faster capture times than with e.g., a 50 mm
lens.
The tripod used for the 360-camera, the DSLR and the GoPro rig in time-lapse mode was
the Manfrotto 475b Aluminium tripod with 410 Junior Geared Tripod Head. The tripod and
tripod head shown in Figure 8e and f have plenty of height and angle adjustment making it
suitable for the purpose. The vertical angle adjustment is fast and important for taking pho-
tos with the DSLR.
18a. b.
Figure 7. Leica DISTO s910 laser measuring tool a. and compass used for discontinuities measurements, Bo-
lanke M2 b.
Figure 8. Camera equipment used in this thesis, a. Canon 5DS R DSLR with Canon 14 mm F2.8 lens., b. In-
sta360 Pro 360-camera, c. GoPro rig and d. Canon 5DS R DSLR with 14 mm canon F2.8 lens and Canon M6
mark II, e. Manfrotto tripod and f. Manfrotto head.
3.3 Developing the GoPro rig
The GoPro rig is a tool for Structure-from-Motion SfM photogrammetry developed for this
thesis. The rig is shown in Figure 9 both as the finished product and a 3D render made in
the CAD software Fusion 360. It comprises of four GoPro Hero 8 action cameras coupled
together using a plastic tube frame and 3D printed parts. The rig can be used handheld or
mounted on a tripod.
19a. b.
Figure 9. a. the finnished rig with cameras, lights and tripod mount and b. the rig rendered in Fusion 360.
3.3.1 Plastic tube frame
Photogrammetry using structure from motion works best when you have good overlap with
pictures taken from different directions (Schönberger & Frahm Jun 2016). The GoPro rig
was designed with this in mind. It is built around modularity and mobility using standard
plastic plumbing tubes and fittings as a frame as well as 3D printed parts. This means the
parts are light, easy to assemble and readily available. Four GoPro cameras are attached to
the frame with 3D printed clamps. Lights and a tripod mount can also be clamped to the
frame. The parts are only attached with friction from the rubber seals in the connection
pieces, this means the frame can easily be taken apart and parts swapped out as it is not
glued together. The frame was already quite stiff with friction only and requires considerable
force to pull apart but could be glued together if more rigidity is desired.
The design was first sketched up in Fusion 360 to find out the dimensions and material
cost. Rough placement of the cameras was done to better visualize the scale of the whole rig.
Originally the frame was designed to fit the Aputure light panels used in this thesis, but that
was ruled out later in the design process as the weight would have been unpractical for shoot-
ing handheld. After getting the parts and building it, slight modifications were made to the
design. An extension arm attached with a T-connection was added to get more height differ-
ence in the camera angles. The updated design can be seen in Figure 10.
The pieces of pipe were cut to length using a frame saw. The tube ends were cleaned with
sandpaper to clean the rough cuts. The tubes were connected using four 90-degree connec-
tions at the corners and five t-connections where three tubes meet, a straight connection
piece was attached to the bottom to get more stiffness and allows for a tripod mount.
The GoPro cameras are connected to the frame using custom made 3D-printed clamps.
One camera is attached to each side tube, one camera is attached to the bottom tube and a
20fourth camera is attached to an extension tube connected by a T-connection. The extension
allows for more height difference between the cameras without adding too much weight to
the frame, making the whole frame taller would also affect rigidity. The angle and placement
of each camera can easily be adjusted. As the GoPro cameras have small sensors, they need
lots of light for good picture quality. Two Knog Qudos Action lights were attached with the
same 3D-printed clamps.
The frame can be used handheld or on a tripod, it can be attached to a tripod using a
Manfrotto Super Clamp fastened onto the bottom of the frame. The bottom tube where the
tripod clamp was attached would sometimes spin at the T-connections, this could be fixed
by gluing the tubes together.
3.3.2 3D printed camera mounts
The camera and light attachment clamps are 3D-printed parts, and as both the GoPro cam-
era and the Knog Qudos Action lights use the same mounting system. This made it possible
to use the same clamp design for both. The clamps were available on GrabCAD and modified
in Fusion 360. Among the modifications the clamps were simplified to use only one screw
type. The M5 machine screw was chosen as they are compatible with the integrated mount-
ing system in the GoPro cameras. After exporting the files, the clamps were printed using an
Ultimaker 3 Extended 3D-printer. ABS filament was chosen as it produced the best quality
product. Experimental prints using PLA and nylon filament did not work as well and did not
have as much rigidity. The clamps need to have some compressive strength to withstand the
force exerted by the machine screws, which the ABS-filament provides.
21Figure 10. CAD drawing of the GoPro rig with pipe dimensions.
3.4 Setting up lights
Lighting used in the thesis was battery powered transportable lights. This was a conscious
choice as some tunnels might not have power available. The main lights used were a combi-
nation two DeWalt DCL074 20v lights and two Aputure Amaran Tri-8s lights, both lights
are shown in Figure 11. The GoPro rig had two additional small lights attached. These were
added to give some additional light to the less sensitive/smaller sensors and light up une-
venly lit small crevasses, and to showcase the flexibility of the frame setup. The Knog lights
used did after all prove to be quite impractical as they did not provide much additional light
and had bad battery life, lasting about 15-20 minutes of operation. Using other more pow-
erful lights with greater battery life attached to the GoPro rig could be beneficial.
As both locations photographed were tunnel openings comprised of three walls, roof and
floor that had to be lit up. The lighting setup compromised of two Aputure LED panel lights
pointed towards the top corners and one DeWalt 360 light in between. The second DeWalt
light was raised up on a tripod for better uniform illumination. The second DeWalt light was
raised up on a tripod for better uniform illumination. A close to identical setup shown in
Figure 12 was used in both tunnel locations. The tunnel floor does not contain exposed rock,
and it not as important to capture. Therefore, the floor mostly was lit up with the indirect
light, reflections from the walls and roof. The point of the experiment of where pictures were
taken with the DSRL a 5-meter distance was to showcase a scenario where one cannot do
22work under an unsupported roof or near an unsupported wall, the lights were placed in a
different arrangement. All lights were placed on the “safe side” on the tunnel floor pointing
towards the subject.
The lighting setup has flaws, some crevasses and fractures are unlit, and more diffused
light would give better results. But the lighting setup is relatively light weight and easy to set
up. The process takes only a few minutes. Unfortunately, the light output of the setup was
not measured in this thesis.
Figure 11. Lighting equipment used in the thesis, a. DeWalt DCL074 20v lights, b DeWalt light tripod and c.
Aputure Amaran Tri-8s light panels.
Figure 12. The light setup used in both tunnel locations was like what is shown in this picture from tunnel 11.
233.5 Photo settings
The camera parameters chosen for each camera system were chosen to optimize the signal-
to-noise ratio (SNR). In practice this meant that images were captured with Raw format and
long exposures where possible. Long exposures were chosen to allow for less sensor sensi-
tivity or a low ISO, as this creates a less noisy picture.
A small Aperture or opening in the lens was chosen for the DSLR (Digital Single-Lens
Reflex) to get a wider DoF (Depth of Field). An aperture of F11 was used consistently
throughout the experiments. The small aperture will mean less light reaches the sensor, but
it can easily be compensated with longer exposures. For both the 360-camera and the GoPro
the aperture is fixed. Even though the aperture of the GoPro and the 360-camera is bigger
at F2.8 than the DSLR, they still produce images with a large DoF. This is due to the smaller
sensor size. A big aperture or small F-number on a small sensor like the 1/2.3" sensor on the
GoPro will create a wider DoF than the same F-number on a full-frame sensor (Nasse 2010).
A comparison table of the camera sensors used in this thesis is shown in Table 1. Figure
13 is a visual representation in the size difference. As can be seen the sensor size of the In-
sta360 Pro is almost identical of that of the GoPro Hero 8, while the sensors of the DSLR
and mirrorless cameras are much bigger. A larger sensor typically means that the camera is
more sensitive to light, making the low light capabilities better.
Table 1. Sensor specifications for the camera systems used.
Camera Sensor size Resolution Pixel size
Canon 5DS R 36 x 24 mm 8688 x 5792 4.14 μm
Canon M6 Mark II 22.3 × 14.9 mm 6960 x 4640 3.20 μm
GoPro Hero 8 6.17 x 4.55 mm 4000 x 3000 1.54 μm
Insta360 Pro 6.311 x 4.721 mm 4000 x 3000 1.58 μm
24Figure 13. This shows the difference in sensor size between camera systems used.
3.5.1 Insta360 Pro
The Insta360 Pro has six image sensors, and the resolution of each sensor is 3000 x 4000
pixels. The sensor size is 6.311 x 4.721 mm and has a pixel size of 1.58 μm (micron). The
Insta360 camera has a set aperture of F2.4, a focal length of 1.88 and a crop factor of 5.619.
The fish-eye lens on the sensors produces a full frame equivalent FoV of a 10.57 mm and an
equivalent aperture of ~F13 (Insta360 2021b). The crop factor is calculated by dividing the
diagonal of a 35 mm sensor with the diagonal of the Insta360 sensor. Equivalent focal length
is calculated by multiplying the focal length of the Insta360 camera with the crop factor and
equivalent aperture is calculated by multiplying the aperture with the crop factor (Nasse
2010).
A render made in the 3D-software Blender 2.90.0 that can be seen in Figure 14 shows
how a single image set is captured by the Insta360 Pro 360-camera. Six photos are taken
simultaneously by the six sensors on the camera.
The 360-camera was set to 1/10 shutter speed and between 160 and 320 ISO. As Tunnel
8 is a larger location with no integrated lighting the sensor sensitivity or ISO-value needed
to be higher. The photos were taken using a smartphone and the Insta360 app as a remote
shutter release. The camera was set on a tripod and moved a small distance before the next
set of photos was taken. The photos were taken at two different tripod heights to make sure
that more detail was captured, the difference between the tripod height was 0.5 meters.
253.5.2 GoPro
The GoPro Hero 8 sensor has a resolution of 4000 x 3000 pixels, a sensor size of 6.17 x 4.55
mm and pixel size of 1.54 μm. The sensor on the GoPro is similar of that of the Insta360
sensors, but the GoPro has the benefit of a lens with a larger focal length and less of a fisheye
effect, giving it less distortion and spread-out pixels. The GoPro has a crop factor of 5.64, a
focal length of 3 mm and a fixed aperture of F2.8. This is equivalent of a full frame camera
with ~16-17 mm lens and an aperture of equivalent F16.
The GoPro rig was used both in time-lapse and video mode. To start the image captures
on all four cameras the GoPro smart remote was used. It uses Bluetooth to connect to the
cameras and allows for triggering several cameras simultaneously. An advantage of the Go-
Pro-rig in video mode is that a tripod is not needed while capturing the images. The videos
were captured while walking and pointing the GoPro rig towards the tunnel face. The shutter
speed was set to 1/96 was chosen as a compromise between motion blur and noise and ISO
was set to 800. During time-lapse mode, the cameras were set to capture raw images and
the rig was attached to a tripod and moved between captures. The shutter speed was set to
1/8 and the ISO to 100. Images were captured with a 10 second interwall which provided
enough time to move the tripod between image captures, the output of a single capture of
the GoPro rig in time-lapse mode rendered in Blender is shown in Figure 15.
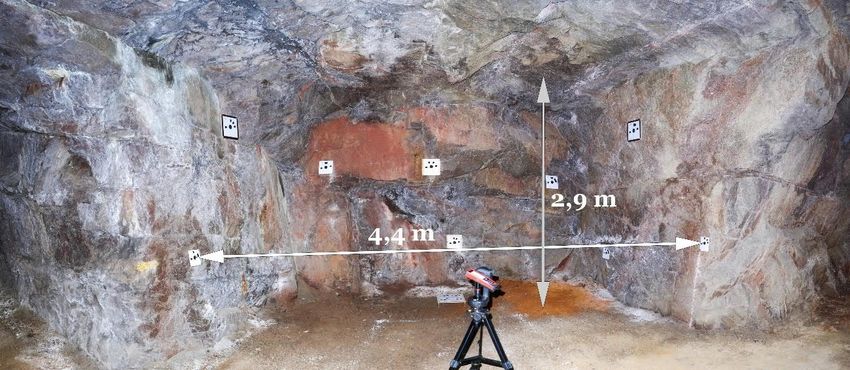
Figure 14. 3D-render of how the Insta360 Pro 360-camera captures images.
26Figure 15. 3D-render that shows the output from one frame of the GoPro rig in timelapse mode. The cameras
capture a similar area but from different angles.
3.5.3 Canon DSLR
The Canon 5DS R has a 50.2-megapixel, 36 x 24 mm full frame sensor. The images captured
with the camera are 8688 x 5792 pixels. The pixel size on the sensor is 4.14 μm, which is
much larger than that of both the GoPro and the 360-camera.
Images were captured in RAW to provide more flexibility in editing. The focal length was
fixed for all photos as a 14 mm prime lens was used. An aperture of F11 was chosen to make
sure that the whole image would be sharp and in focus. The ISO varied between 320 and
400 and the shutter speed was set to 0.8 seconds. Both were fixed values for each photo
session. The camera was placed on a tripod and the horizontal and vertical angle of the cam-
era was adjusted to capture the whole scene. The camera was moved facing the tunnel face
at about a 2-meter distance from the wall. A remote shutter was used to avoid shake from
touching the shutter release button. The shooting scheme how the camera position was
moved can be seen in Figure 16 and how the angle and height adjustments were made in
Figure 16. For each camera position four angles are captured with a fifth angle taken per-
pendicular towards the wall with the tripod height raised from 1.5 meter to 2 meters.
For one of the experiments images were taken from a distance to simulate conditions
where images cannot be taken from an unsupported tunnel section. In this case, two cameras
were used as a zoom or narrow angle lens fitting the 5DS R was not available for use during
the experiment. The camera systems used was the Canon 5DS R with 14 mm wide angle lens
27and the Canon M6 mark II equipped with a 15-45 mm zoom lens. The M6 mark II has a 22.3
× 14.9 mm, 6960 x 4640 pixels sensor with 3.20 μm pixel size. The images captured with
the Canon M6 mark II were taken at F11, with 2 second shutter speed and 400 ISO, the photo
scheme for the experiment done from a 5-meter distance of the back wall can be seen in
Figure 17. As work could not be done near unsupported walls in this case simulating opera-
tional mine conditions, lights were placed at 5-meter distance as well. Lights were pointed
towards the subject of interest.
a. b.
Figure 16. Shooting scheme for DSLR, with camera positions in a. and angle adjustments in b.
Figure 17. Two cameras were used when shooting the tunnel from a distance, the Canon 5DS R with a wide-
angle lens and the Canon M6 mark II equipped with a zoom lens.
283.6 Photo editing
All images were shot in RAW and edited in Adobe Lightroom Classic 2020. The videos cap-
tured by the GoPro had a similar workflow. Videos were first converted into image frames
in RealityCapture and then edited in Lightroom, one image frame per second of video foot-
age was exported.
White balance was adjusted to get more realistic colours and to better match the colours
between different capture techniques. As the image sensors see colours differently, different
values for white balance were chosen for different methods. Shadows were brightened and
headlights toned down to bring out more detail from the RAW photos. Shadows were set to
+100 and highlights to -100. As some of the sets of images captured in tunnel 8 were slightly
underexposed, the exposure was adjusted to values between +0.2 and +0.3. The GoPro and
360 images had a bit of haze in the images, and this was fixed by using the dehazing feature
in Lightroom. All images in each model used the same photo settings. After photo editing
was done the images were exported into JPEG-files and later brought into the photogram-
metry software. For the images produced by the GoPro in video format the images produced
by exporting images from the videos in RealityCapture are PNG-file format unlike all other
methods in this thesis that produce RAW images, but the photo editing was still similar.
Exposure was increased by 0.8 in tunnel 8 to get a lighter image and +30 dehazing was ap-
plied to photos taken in tunnel 11 to remove white haze on the images.
3.7 Mapping discontinuities
Discontinuities were mapped by hand using a compass, to be later compared with measure-
ments taken from the photogrammetry 3D-models. Only a few measurements were taken
where the dip and dip direction of the discontinuities were easy to measure using the Bo-
lanke M2 compass. This meant mostly planar and smooth discontinuity surfaces were cho-
sen.
Taking measurements with a smartphone would be faster as the results would be elec-
tronically logged on the device, but the method was ruled out due to its inaccuracy (Nova-
kova & Pavlis 2017). Measuring the dip with modern smartphones could be done as the built-
in inclinometers are quite accurate, however dip direction or azimuth measurements with
these devices have been proven to be inaccurate as the compasses are sensitive to magnetic
interference. If smartphones or tablets are used for dip and dip direction measurements,
they should be continuously compared with traditional compass measurements to make
sure that the measurements are accurate (Novakova & Pavlis 2017). Smartphones are mass-
29You can also read