Comparison Between Trophic Positions in the Barents Sea Estimated From Stable Isotope Data and a Mass Balance Model
←
→
Page content transcription
If your browser does not render page correctly, please read the page content below
ORIGINAL RESEARCH
                                                                                                                                            published: 04 March 2022
                                                                                                                                     doi: 10.3389/fmars.2022.813977

                                            Comparison Between Trophic
                                            Positions in the Barents Sea
                                            Estimated From Stable Isotope Data
                                            and a Mass Balance Model
                                            Torstein Pedersen*
                                            Department of Arctic and Marine Biology, Faculty of Biosciences, Fisheries and Economy, UiT The Arctic University of
                                            Norway, Tromsø, Norway

                                            The trophic position concept is central in system ecology, and in this study, trophic
                                            position (TP) estimates from stable-isotopes and an Ecopath mass-balance food web
                                            model for the Barents Sea were compared. Two alternative models for estimating TP
                                            from stable isotopes, with fixed or scaled trophic fractionation were applied. The mass-
                          Edited by:        balance model was parametrized and balanced for year 2000, was comprised of 108
                     Peter Grønkjær,
                                            functional groups (Gs), and was based on biomass and diet data largely based on
          Aarhus University, Denmark
                                            predator stomach data. Literature search for the Barents Sea Large Marine Ecosystem
                      Reviewed by:
                   Sharon Z. Herzka,        revealed 93 sources with stable isotope data (δ15 N values) for 83 FGs, and 25 of
       Center for Scientific Research       the publications had trophic position estimated from nitrogen stable isotopes. Trophic
   and Higher Education in Ensenada
                   (CICESE), Mexico
                                            positions estimated from the mass-balance model ranged to 5.1 TP and were highly
                Agnes M. L. Karlson,        correlated with group mean δ15 N values, and also highly correlated with the original
       Stockholm University, Sweden
                                            literature estimates of trophic positions from stable isotopes. On average, TP from the
                  *Correspondence:
                                            mass-balance model was 0.1 TP higher than the original literature TP estimates (TPSIR )
                     Torstein Pedersen
             Torstein.Pedersen@uit.no       from stable isotopes. A trophic enrichment factor (TEF) was estimated assuming fixed
                                            fractionation and minimizing differences between trophic positions from Ecopath and
                   Specialty section:
                                            TP predicted from δ15 N values assuming a baseline value for δ15 N calculated for pelagic
         This article was submitted to
          Marine Ecosystem Ecology,         particulate organic matter at a baseline TP of 1.0. The estimated TEF of 3.0h was lower
               a section of the journal     than the most commonly used TEF of 3.4 and 3.8h in the literature. The pelagic whales
          Frontiers in Marine Science
                                            and pelagic invertebrates functional groups tended to have higher trophic positions from
       Received: 12 November 2021
        Accepted: 28 January 2022           Ecopath than from stable isotopes while benthic invertebrate functional groups tended
         Published: 04 March 2022           to show an opposite pattern. Trophic positions calculated using the scaled trophic
                               Citation:    fractionation approach resulted in lower TP than from Ecopath for intermediate TPs and
        Pedersen T (2022) Comparison
                                            also a larger TP range in the BS. It is concluded that TPs estimated from δ15 N values
            Between Trophic Positions
   in the Barents Sea Estimated From        using a linear model compared better to the Ecopath model than the TPs from scaled
       Stable Isotope Data and a Mass       fractionation approach.
                        Balance Model.
             Front. Mar. Sci. 9:813977.     Keywords: ecosystem structure, trophic enrichment factor, Arctic ecosystem, ecosystem comparison, polar bear,
     doi: 10.3389/fmars.2022.813977         food web

Frontiers in Marine Science | www.frontiersin.org                                  1                                           March 2022 | Volume 9 | Article 813977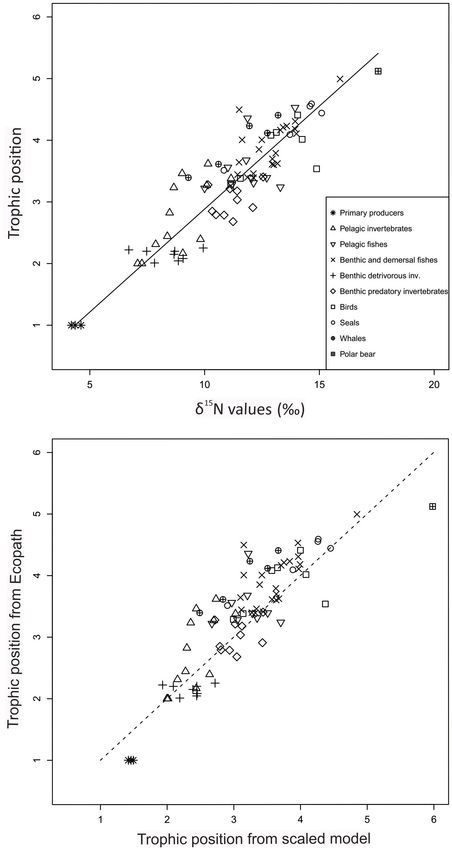
Pedersen                                                                                                 Comparison of Trophic Position Estimates

INTRODUCTION                                                             trophic level (Post, 2002) (Eq. 1). This is termed the linear
                                                                         model in this study.
Following the introduction of integer trophic levels by Lindeman
(1942) and fractional trophic levels by Odum and Heald                             TPlin = TPbase + (δ15 N − δ15 Nbase )/TEF                 (1)
(1975), the use of trophic levels has developed and it has
become a conceptual pillar in ecosystem analysis. Fractional                 The choice of baseline organism and baseline trophic position
trophic levels have also been termed trophic positions (TP)              vary between studies (Casey and Post, 2011). In the Barents
in the literature (Odum and Heald, 1975; Vander Zanden and               Sea, several baseline groups and organisms have been selected;
Rasmussen, 2001; Hussey et al., 2014a). TP is included in the            pelagic particulate organic matter (pPOM) at TP = 1 and
theoretical basis and calculation of many ecosystem metrics              copepods and bivalves at TP = 2 (Hop et al., 2002; Hallanger
and indicators such as trophic efficiency, transfer efficiency           et al., 2011a; Fuhrmann et al., 2017). Consistent strong spatial
and omnivory index (Shannon et al., 2014). Furthermore, TP               gradients in δ15 N values of lower trophic level organisms and
is an important predictor of trophic enrichment of pollutants            δ15 N baseline values have been observed within the West-
in food webs (Hop et al., 2002; Jæger et al., 2009). TP                  Greenland and in the North Sea ecosystems (Jennings et al.,
estimates have been used in analysis of ecosystem structure,             2008; Hansen et al., 2012; MacKenzie et al., 2014). Such spatial
effects of harvesting, trophic control mechanisms, and how               gradients in δ15 N baseline values (isoscapes) have been used
trophic cascades propagate within an ecosystem (Pauly et al.,            when inferring trophodynamics from stable isotopes (Jennings
1998; Frank et al., 2007). Trophic position estimates may be             et al., 2008; MacKenzie et al., 2014), but isoscapes have so
useful for evaluation of fisheries exploitation and management           far not been established for the Barents Sea. The Barents Sea
strategies, and it is important to evaluate methods used to              Large Marine Ecosystem comprise both open water habitat
estimate trophic positions and factors affecting uncertainty in          and numerous fjords and these habitats differ with regard to
these estimates.                                                         environmental conditions which may influence stable isotope
    Trophic position has been estimated from methods based               patterns of organisms (Figure 1; Fuhrmann et al., 2017;
on body size (Basedow et al., 2010), stomach content (Odum               McGovern et al., 2020).
and Heald, 1975), stable isotopes (Hobson and Welch, 1992;                   In Arctic marine ecosystems, a TEF in the range 3.4–3.8h
Hobson et al., 2002), combination of stable-isotope and body             has been commonly applied to most ecological groups (Hobson
size (Jennings et al., 2008), binary diet matrices (Blanchet             et al., 2002; Søreide et al., 2006), but a lower TEF (e.g., 2.4h)
et al., 2019) and mass-balance food web models (Polovina,                has been applied to some areas and to birds in some studies
1985; Christensen, 1995). There are relatively few studies               (Hobson and Clark, 1992; Hop et al., 2002; Hoondert et al.,
comparing results from different methods, but a common                   2021). Experimental studies indicate that TEF may depend on
approach to evaluate the parametrization of mass-balance                 taxonomic class (Caut et al., 2009) and on diet quality, and thus
models has been to compare the TPs from the mass-balance                 vary between trophic groups such as herbivores, carnivores, and
models with independent TP estimates from stable isotopes                detritivores (McCutchan et al, 2003; Vanderklift and Ponsard,
(Kline et al., 1998; Nilsen et al., 2008; Navarro et al.,                2003; Martínez del Rio et al., 2009; McMahon et al., 2015).
2011; Du et al., 2020). McCormack et al. (2019) reviewed                 For the BS, it is uncertain if a common TEF for all FGs
comparisons of TP estimates from stable isotope (SI) and mass-           would be applicable given that there are many taxonomic and
balance models and suggested that comparison of food web                 functional groups.
model attributes with measures of stable isotopes composition                The fixed fractionation model (Eq. 1) has been
of taxa, has a potential for improving ecosystem model                   questioned and an alternative scaled fractionation suggested
parameterization.                                                        (Hussey et al., 2014a). In the scaled fractionation approach
    The use of stable isotopes for estimating TP is based on             (Hussey et al., 2014a), alternative TP values are calculated
the assumption of an enrichment (increase) in the heavier 15 N           assuming that TEF decreases with increasing diet δ15 N values
isotope relative to the lighter 14 N isotope between consumer and        resulting in lower δ15 N value increments per TP at high δ15 N
food source (Post, 2002). The ratio of stable isotopes of nitrogen       values. Application of the scaled model results in a larger range
(δ15 N) may be enriched by about 2 to 4h per trophic level and           of TP than assuming a constant TEF (Hussey et al., 2014a). The
this increase has been termed trophic fractionation, diet–tissue         scaled model has been applied to a cephalopod species in the
discrimination factor or trophic enrichment factor (TEF) (Post,          Barents Sea (Golikov et al., 2019), but it is uncertain how it will
2002; Hussey et al., 2014a; Linnebjerg et al., 2016).                    perform for other FGs.
    Two alternative methods for estimating TP from SIR,                      Mass-balance models, such as Ecopath, estimate trophic
fixed fractionation and scaled fractionation, have been                  positions of functional groups based on input data on biomass,
applied (Post, 2002; Hussey et al., 2014a). In the fixed                 production per biomass, consumption per biomass, assimilation
fractionation approach, TP can be estimated from stable                  efficiency, diet, and fisheries catches (Christensen et al., 2005).
isotope values (δ15 N) from a δ15 N baseline value (δ15 Nbase )          Ecopath models usually represent an annual average of mass
of a group at baseline TP (TPbase ) (Table 1). The baseline              flows in an ecosystem (Christensen et al., 2005). When comparing
organism is typically a primary producer, a copepod, or                  TPs from mass-balance models and SI, there is a need to
an invertebrate suspension feeder, and a constant trophic                match season, space, and ontogeny for the data input for two
enrichment factor (TEF) describes the increase in δ15 N per              methods (McCormack et al., 2019). Ontogenetic changes in δ15 N

Frontiers in Marine Science | www.frontiersin.org                    2                                     March 2022 | Volume 9 | Article 813977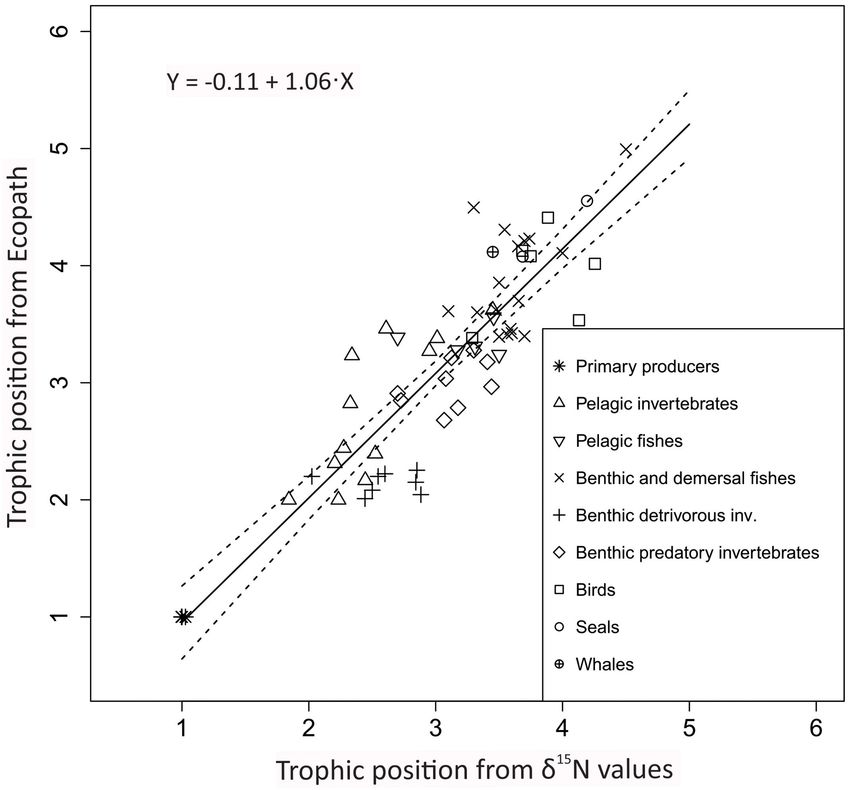
Pedersen                                                                                                                         Comparison of Trophic Position Estimates

TABLE 1 | Overview of definition of acronyms in alphabetical order.

Acronym                              Definition

BS                                   Barents Sea
DC                                   Weight proportion (carbon) of prey in diet
δ15 Nbase value                      Baseline δ15 N value for group at TPbase
δ15 Nlim value                       The highest δ15 N value with positive trophic enrichment factor used in the scaled model, see Hussey et al. (2014a)
δ15 N   TP   value                   Observed δ15 N value for an organism for which a trophic position (TPsca ) will be calculated using a scaled model (Eq. 4)
FG                                   Functional group (see list of FGs in Table 2)
iPOM                                 Ice algal particulate organic matter
pPOM                                 Pelagic particulate organic matter
POM                                  Particulate organic matter
RMSD                                 Root mean squared deviation (Eq. 3) is a measure of deviation between observed and model predicted values
r                                    Pearson correlation coefficient
rs                                   Spearman correlation coefficient
sPOM                                 Surface sediment particulate organic matter
TEF                                  Trophic enrichment factor (h) per trophic position
TPbase                               Baseline TP for lower TP group
TP                                   Trophic position
TPec                                 Trophic positions for various functional groups estimated from the Ecopath mass balance model for the Barents Sea (Pedersen
                                     et al., 2021) (Eq. 2)
TPlin                                Trophic position calculated from a linear model with fixed fractionation (constant trophic enrichment factor) according to Eq. (1).
TPsca                                Trophic position calculated from a scaled trophic fractionation model assuming a decrease in trophic enrichment factor with
                                     increasing trophic position according to Eq. (4).
TPSIR                                Trophic positions calculated from fixed fractionation models and published in the literature sources

values of organisms may coincide with seasonal food-pulses and                              The specific aims of this study were to investigate:
δ15 N values have been found to change with stage or body
size in a number of taxa (Jennings et al., 2008; Ramsvatn and                               (i) If δ15 N values for functional groups differ between
Pedersen, 2012; Jennings and Van Der Molen, 2015). When                                         open water and fjords and change with latitude within
structuring mass-balance models (e.g., Ecopath models) it is                                    the Barents Sea.
common to use size and age structured multi-stanza groups to                               (ii) If TPs from the Ecopath model and published TPs
represent ontogenetic changes in diet composition, TP, growth                                   from SI correspond.
and mortality rates (Ahrens et al., 2012).                                                (iii) If TPs estimated from stable isotope using a fixed
    Several mass-balance models with varying functional group                                   fractionation model or a scaled fractionation model show
resolution has been parametrized for the Barents Sea and                                        better correspondence to TPs from Ecopath.
Norwegian Sea (Blanchard et al., 2002; Dommasnes et al., 2002;                            (iv) The range of trophic positions in the Barents Sea ecosystem.
Skaret and Pitcher, 2016; Bentley et al., 2017; Berdnikov et al.,
2019; Pedersen et al., 2021), but so far no TP-comparisons
between model and stable-isotope data have been performed                                MATERIALS AND METHODS
for the area. For other ecosystems, comparisons between
TP estimated from SI and mass-balance models generally                                   Study Area
show positive correlations between TPs estimated by the two                              The study area included the Barents Sea Large Marine Ecosystem
methods (Kline et al., 1998; Milessi et al., 2010; Navarro                               (BS) and only data sampled from within this area were included
et al., 2011; McCormack et al., 2019; Hoover et al., 2021).                              (Figure 1). The Barents Sea Large Marine Ecosystem is a shelf-
For Ullsfjord, a fjord area at 70◦ N within the Barents                                  ecosystem (area 2,010,000 km) with an average depth of 230 m
Sea Large Marine Ecosystem (LME), TPs from a mass-                                       and is characterized by inflow of warm nutrient-rich Atlantic
balance model and SI have been compared and correlated                                   water from the southwest (Loeng, 1991; Loeng and Drinkwater,
well (Nilsen et al., 2008). Previous estimates of trophic                                2007; Skjoldal and Mundy, 2013). In the north and northeast BS,
positions of organisms in the Barents Sea from stable isotopes                           cold Arctic water dominates and BS is partially ice-covered with
have been based on various baseline organisms and values                                 a seasonal change in ice coverage. Phytoplankton is the dominant
for δ15 N baseline and trophic enrichment factors. In this                               primary producer but ice algae are also important in ice-covered
study, TPs from a recently developed mass-balance model                                  waters (Sakshaug et al., 1994). Primary production is highest in
(Ecopath) for the Barents Sea with high trophic resolution                               the warmer Atlantic ice-free part of the BS. Copepods and krill
(Pedersen et al., 2021), will be compared with published data on                         are major grazers on phytoplankton, and there is a rich and
stable isotopes and TP.                                                                  diverse fauna of benthic invertebrates (Jørgensen et al., 2017).

Frontiers in Marine Science | www.frontiersin.org                                    3                                             March 2022 | Volume 9 | Article 813977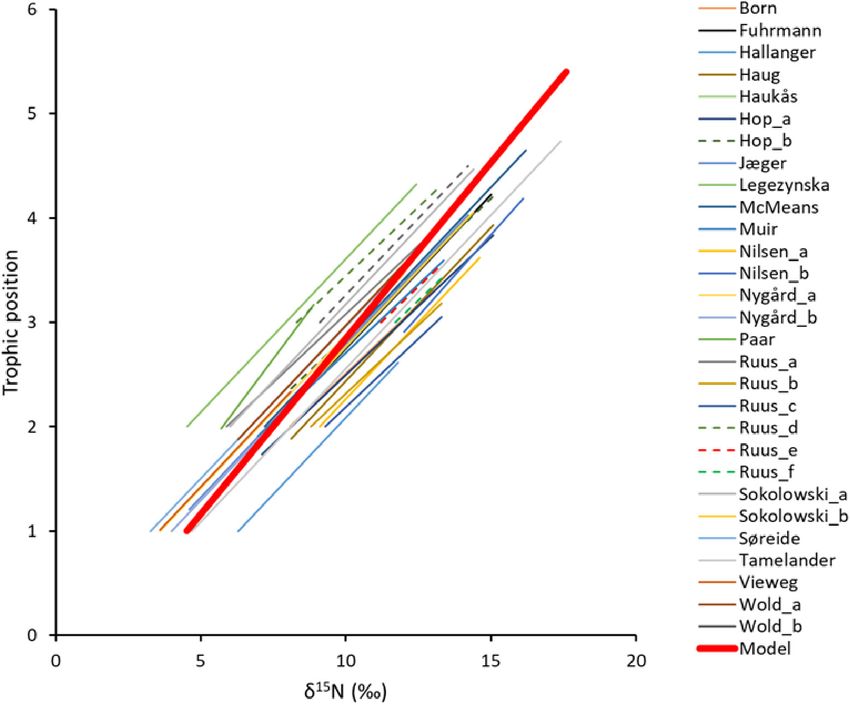
Pedersen                                                                                                               Comparison of Trophic Position Estimates

  FIGURE 1 | Map of Barents Sea large marine ecosystem. Borders of the ecosystem are shown by red lines based on
  https://www.pame.is/projects/ecosystem-approach/arctic-large-marine-ecosystems-lme-s. Positions for sampling of data entries are shown by red dots. Map was
  created using R-package ggOceanMaps (Vihtakari, 2021).

Both pelagic and demersal fishes, sea birds, seals, and whales                     were multi-stanza FGs, i.e., groups were divided into adult/large
are abundant, and polar bears is present in the northern part of                   and juvenile/small groups with separate input values, diet
the BS (Sakshaug et al., 1994). There are several distinct carbon                  compositions, and TPs (Table 2). When parametrizing Ecopath
flow pathways from lower to higher trophic FGs; the copepod                        mass-balance models, the major input to the mass-balance
pathway, the krill pathway, the microbial food web pathway, and                    model are biomass (g C m−2 ), production/biomass (year−1 )
the benthic invertebrate pathway (Pedersen et al., 2021). The large                and consumption/biomass ratios (year−1 ), ecotrophic efficiency,
stocks of planktivorous fishes, e.g., capelin, polar cod, and small                proportion of unassimilated food, catches, and diet compositions
herring are major prey sources for whales, seals, birds, and large                 (Christensen et al., 2005). Ecotrophic efficiency is the proportion
demersal and benthic fish FGs (Bogstad et al., 2015; Pedersen                      of the production of a group that is consumed within the
et al., 2021).                                                                     model. Data on biomass were taken from stock assessments for
    A few studies have reported average SI values, from locations                  exploited fish and mammal FGs and from literature for other FGs
both within and outside BS, and these values were included if                      (Pedersen et al., 2021). The Ecopath model is balanced to assure
there were no statistical significant differences between values                   that the production of each FG is sufficient to match the demands
within and outside BS. Data from fjord areas within the                            from predation, fishery, and other losses. During the balancing
BS were included.                                                                  process, the initial values of the diet matrix may be modified.
                                                                                      Ecopath calculates trophic position (TPec ) of the FGs and the
Mass-Balance Model for the Barents Sea                                             TPec,j of each predator group j using the equation:
A trophically highly resolved mass-balance model for the Barents
Sea for year 2000 has been developed (Pedersen et al., 2021) and                                                         n
was used to provide model based estimates of TPs. The model
                                                                                                                         X
                                                                                                     TPec,j = 1 +               DCij TPec,i                 (2)
comprises 108 functional groups (FGs) (Table 2). Nineteen FGs                                                             i=1

Frontiers in Marine Science | www.frontiersin.org                              4                                         March 2022 | Volume 9 | Article 813977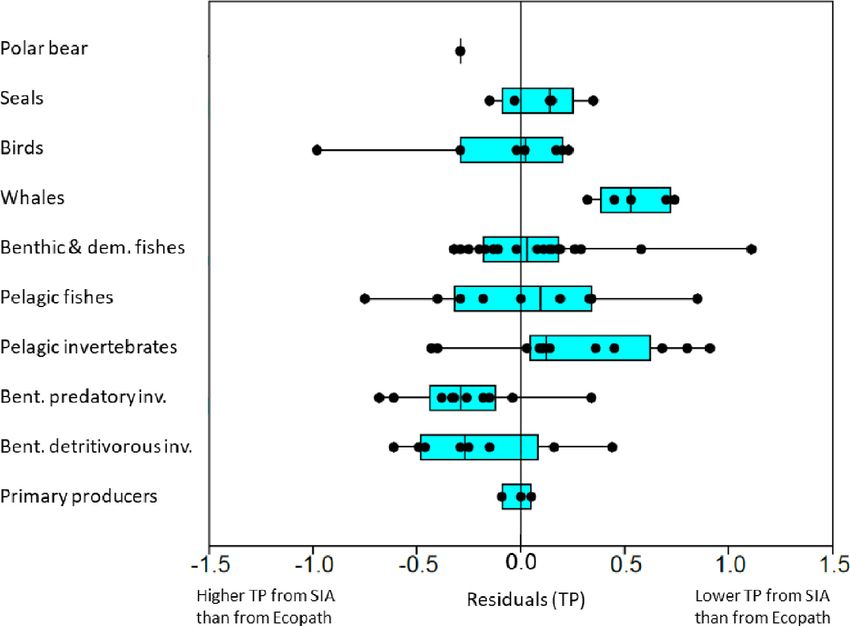
Pedersen                                                                                                                              Comparison of Trophic Position Estimates

TABLE 2 | Overview of functional groups for which output values from Ecopath were aggregated into major categories.

Aggregated category                                 Ecopath groups within the category

Polar bears                                         (1) Polar bears
Whales                                              (2) Minke whale, (3) Fin whale, (4) Blue whale, (5) Bowhead, (6) Humpback whale, (7) White whale, (8) Narwhale, (9)
                                                    Dolphins, (10) Harbor porpoise, (11) Killer whales, (12) Sperm whale
Seals                                               (13) Harp seal, (14) Harbor seal, (15) Grey seal, (16) Ringed seal, (17) Bearded seal, (18) Walrus
Birds                                               (19) Northern fulmar, (20) Black legged kittiwake, (21) Other gulls and surface feeders, (22) Little auk, (23)
                                                    Brunnich guillemot, (24) Common guillemot and razorbill, (25) Atlantic puffin, (26) Benthic feeding piscivorous
                                                    birds, (27) Benthic invertebrate feeding birds
Benthic and demersal fishes                         (28) Greenland shark, (29) Northeast Arctic cod (3+), (30) Northeast Arctic cod (0–2), (31) Coastal cod (2+),
                                                    (32) Coastal cod (0–1), (33) Saithe (3+), (34) Saithe (0–2), (35) Haddock (3+), (36) Haddock (0–2), (37) Other
                                                    small gadoids, (38) Large Greenland halibut, (39) Small Greenland halibut, (40) Other piscivorous fish, (41)
                                                    Wolffishes, (42) Stichaeidae, (43) Other small benthivorous fishes, (44) Other large benthic invertebrate
                                                    feeding fish, (45) Thorny skate, (46) Long rough dab, (47) Other benthivore flatfish, (59) Large redfish, (60)
                                                    Small redfish
Pelagic fishes                                      (48) Large herring, (49) Small herring, (50) Capelin (3+), (51) Capelin (0–2), (52) Polar cod (2+), (53) Polar cod
                                                    (0–1), (54) Blue whiting, (55) Sand eel, (56) Other pelagic planktivorous fish, (57) Lumpfish, (58) Mackerel, (61)
                                                    Atlantic salmon
Pelagic invertebrates                               (62) Cephalopods, (63) Scyphomedusae, (64) Chaetognaths, (65) Thysanoessa, (66) Large krill, (67)
                                                    Ctenophora, (68) Pelagic amphipods, (69) Symphagic amphipods, (70) Pteropods, (71) Medium sized
                                                    copepods, (72) Large calanoids, (73) Small copepods, (74) Other large zooplankton, (75) Appendicularians, (76)
                                                    Ciliates, (77) Heterotrophic dinoflagellates, (78) Heterotrophic nanoflagellates
Benthic predatory invertebrates                     (79) Northern shrimp (Pandalus borealis), (80) Crangonid and other shrimps, (81) Other large crustaceans,
                                                    (82) Crinoids, (83) Predatory asteroids, (84) Predatory gastropods, (85) Predatory polychaetes, (86) Other
                                                    predatory benthic invertebrates, (101) Snow crab, (102) Large red king crab, (103) Medium red king crab, (104)
                                                    Small red king crab
Benthic detritivorous invertebrates                 (87) Detritivorous polychaetes, (88) Small benthic crustaceans, (89) Small benthic molluscs, (90) Large
                                                    bivalves, (91) Detritivorous echinoderms, (92) Large epibenthic suspension feeders, (93) Other benthic
                                                    invertebrates, (94) Meiofauna, (96) Benthic foraminifera
Primary producers                                   (97) Diatoms*, (98) Autotroph flagellates*, (99) Ice algae**, (100) Macroalgae

*Included in pPOM. **Included in iPOM.Functional group numbers are shown in brackets.Groups with δ15 N values are shown in bold.

Where DCij is the proportion of prey, i in the diet of predator                          name or higher taxonomic level, or if the sample comprised
j, and TPec,i is the trophic position of FG i. In Ecopath it is                          particulate organic matter (POM) of three categories; pPOM
assumed that all the detritus groups have trophic position 1                             (pelagic particulate organic matter), sPOM (POM from surface
(Christensen et al., 2005).                                                              sediment), iPOM (ice algal particulate organic matter) was
                                                                                         registered. If data on size or stage were available, it was recorded.
Stable Isotope Data, Sources and                                                         The entries were allocated to FGs based on the feeding category
                                                                                         (i.e., herbivore, detritivorous or predatory), and the number of
Overview
                                                                                         replicates the δ15 N value were based on and the δ15 N value were
Literature was searched for sources containing δ15 N values for
                                                                                         noted (Supplementary Table 2).
organisms and/or trophic position (TPSIR ) estimated from δ15 N
                                                                                             To obtain model independent values for TEF that could help
values for the Barents Sea LME area (Figure 1), resulting in a
                                                                                         to explain deviations from model predicted TPs, literature was
total of 93 sources with data (Supplementary Table 1). The SI-
                                                                                         searched to obtain estimated values on TEF from experiments
data included values from living groups and on δ15 N values from
                                                                                         and field studies with known diet source for organisms in FGs
organic matter in surface sediment samples. TP and δ15 N values
                                                                                         that are distributed within the BS. It was required that at least the
were registered for the lowest taxonomic level reported in the
                                                                                         genus of the species is distributed within the BS.
publication and were allocated to FGs that matched the Ecopath
functional groups (Table 2).
    For each data entry with SI values, the variables registered                         Data Analysis, Trophic Position-Stable
included: the year or time period and month of sampling,                                 Isotope Relationships and Statistical
geographical sampling area, location, whether data were sampled                          Analysis
in a fjord (binary habitat variable; fjord = 1, open water = 0).                         Data that were only available in plots were digitized using
Position or geographic range of sampling (latitude and longitude                         a digitizer (WebPlotDigitizer1 ). Data entries represented by
of sampling were registered). The sampling location was                                  average values for δ15 N and TPSIR were calculated for given
registered by entering either the exact latitude and longitude                           taxa when there were several values for the same taxa, sampling
when reported, or the midpoint of the geographical area                                  position, and time. Separate data entries were recorded for
of sampling represented by the lowest and highest integer
latitude and longitude including the sampling area. The species                          1
                                                                                             https://automeris.io/WebPlotDigitizer/

Frontiers in Marine Science | www.frontiersin.org                                    5                                                  March 2022 | Volume 9 | Article 813977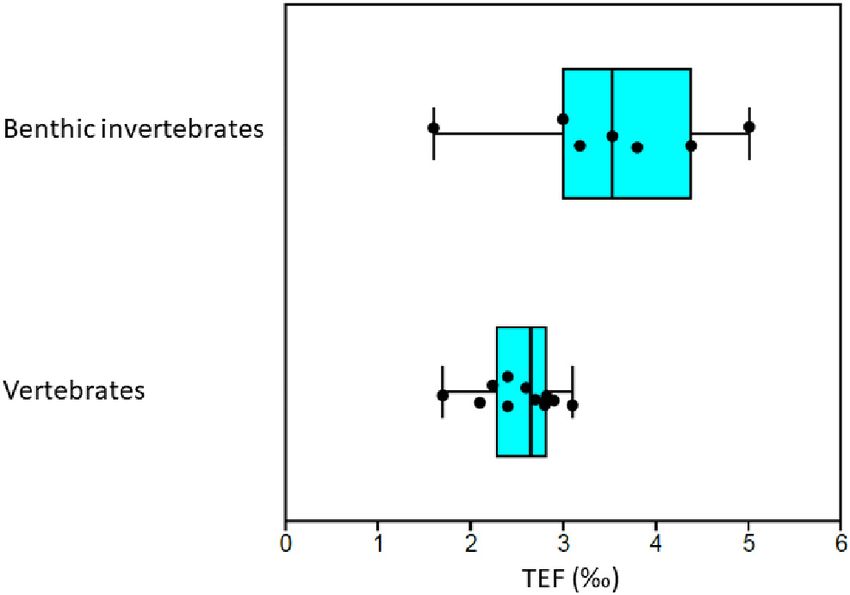
Pedersen                                                                                                       Comparison of Trophic Position Estimates

different sampling positions or sampling times. Values for                    test was applied to test if central tendency differed for δ15N values
separate size or stage groups within a taxa, and for various                  between habitats.
sampling times (seasons), locations, and sampling years were                     (II) Average δ15 N and TP values were calculated for each FG
kept in their original format. Data entries were allocated to                 with values on δ15 N and/or trophic position value from stable
functional groups (FGs) matching the Ecopath groups based                     isotopes given in literature sources (TPSIR ), For FGs with only
on information from literature (i.e., Kȩdra et al., 2010; Planque            one δ15 N and TPSIR value, this value was used to represent the FG.
et al., 2014; Sokołowski et al., 2014; Jumars et al., 2015; Renaud            A total of 83 and 65 FGs had δ15 N and TPSIR values, respectively.
et al., 2015; Pedersen et al., 2021). Ontogenetic effects are partly          In addition to the living functional groups, values of δ15 N
included in the Ecopath model by the specification of groups                  measured from sediment sampled particulate organic matter
for small and large individuals (multi-stanza FGs) for a number               (sPOM) were entered as representative for the FG “detritus from
of species; Northeast arctic cod, coastal cod, saithe, haddock,               other sources” which is a functional group in Ecopath and a major
Greenland halibut, redfish, capelin, polar cod and red king crab              food source for benthic detritivorous invertebrates and bacteria.
(Table 2). Data entries were allocated to the multi-stanza FGs                   Values of TPec and TPSIR were compared in bi-scatter plots
based on information about age and body size given in the                     and the Pearson correlation coefficient was estimated. TPec and
source. δ15 N or TPSIR values reported for broad categories (e.g.,            TPSIR values for each FG were compared and whether there was
“copepods”) that were too broad to match the FGs (e.g., three                 a significant difference between TPec and TPSIR was examined
copepod FGs in the Ecopath model, Table 2) were not included                  using a Wilcoxon two-sample paired sample test (Zar, 1999). The
in the further analysis. All taxa names were checked to be in                 significance level was set to 5% in all statistical tests.
accordance with the accepted names in World Register of Marine                   The root mean squared deviation (RSMD) (Piñeiro et al.,
Species2 (accessed 20 June 2021) and presently unaccepted names               2008), represent the mean deviation of model predicted TP
in the original sources were corrected (Supplementary Table 2).               values (ypi ) with respect to the observed ones here taken as TPec
    Further analysis of the isotope data were made in several major           (yoi = TPec ).
steps corresponding to the aims (I–IV) given in the introduction.
Since the Ecopath mass-balance model give TPs for an average                                        v
                                                                                                    u          n
state of the BS ecosystem, the stable isotope data were treated to                                  u       1 X           2
                                                                                             RMSD = t            ypi − yoi                         (3)
represent average conditions.                                                                              n−1
                                                                                                                  i=1
    (I) The total data set was unbalanced with regard to geographic
position and season of sampling (Figure 1 and Supplementary
Table 3). There were few samples from open water in the                       where n is the number of pairs of observed and predicted
southern part of the Barents Sea and most samples were taken                  values. RMSD has unit trophic position and lower RMSD values
during the summer months (Figure 1 and Supplementary                          indicate better fit of model predictions to observations than do
Table 3). A large proportion (61%) of the total number of                     higher RMSD values.
δ15 N values were from samples taken in fjord habitats. It was                    (III) Since there is a range of possible TEF values, a linear
considered inappropriate to apply statistical methods that were               best-fit model was estimated to represent the average relationship
dependent on balanced designs. For FGs with sufficient number                 between TP and δ15 N values. The model was fitted to two
(n > 5) of δ15 N values, δ15 N values were plotted versus latitude            alternative sets of data; (i) from open water and fjord habitat,
and month-values with different plotting symbols for open                     and (ii) from only open water data. This was chosen because
water and fjord habitats to assess if there were obvious spatial              open water represent the majority of the area in the BS and
or seasonal trends. Whether δ15 N values were correlated with                 because most of the Ecopath background data is from open water.
latitude was examined using the Spearman rank correlation                     The model estimated TEF by minimizing the sum of squared
coefficient (rs ) applying the cor.test in package stats in R. P-values       differences between values for TPec and TP predicted from δ15 N
for multiple tests were adjusted according to Benjamini and                   values (TPlin ) using Eq. (1). The baseline TP was set to 1.0
Hochberg (1995) using p.adjust in package stats in R. Values                  and the δ15 N baseline value was set to the average δ15 N value
deviating more than 3 SD from the mean of the FG were                         for pPOM representing phytoplankton which is the dominating
identified as outliers.                                                       primary producer in BS (Sakshaug et al., 1994). The model was
    The FG mean δ15 N values and the difference between the                   fitted to the data (TPec and the average δ15 N values for each FG)
mean-values for fjord and open water habitat for each FG were                 applying the nls function with least-squares estimation in package
calculated. Whether the frequency distributions of δ15 N values               stats in R. The values for TPbase and δ15 Nbase were kept fixed
for each habitat (open water or fjord) deviated from normal                   during the estimation.
distributions was examined using Shapiro-Wilks test (shapiro.test                 Pelagic particulate organic matter-samples may contain
in package stats in R), and for distributions not deviating from              heterotrophic organisms such as bacteria and protozoa in
normality, two-group t-tests with separate variances were applied             addition to phytoplankton (Stowasser et al., 2012), and the effects
to test if the mean were equal in fjords and open-water habitats.             of choosing an alternative TPbase of 1.2 in the linear best-fit model
For groups where δ15 N values from at least one habitat deviated              for data from both open water and fjord habitats were tested.
from normality, a two-sample non-parametric Mann–Whitney                          A scaled model for calculating TP was based on the description
                                                                              by Hussey et al. (2014a,b) (Eq. 4). The scaled model requires that a
2
    https://www.marinespecies.org/                                            primary consumer (base) is selected with its δ15 N value (δ15 Nbase

Frontiers in Marine Science | www.frontiersin.org                         6                                      March 2022 | Volume 9 | Article 813977
Pedersen Comparison of Trophic Position Estimates
value) and its trophic position (TPbase ). The TP (TPsca ) of an n = 113; p = 0.009), large suspension feeders (rs = −0.66,
organism with known δ15 N value (δ15 NT P ) can then be calculated n = 23; p = 0.009) and polar cod (age 2+) (rs = −0.70,
n = 15; p = 0.04). For data from only open water, no FGs
had significant correlations between δ15 N values and latitude
!
log δ15 Nlim − δ15 Nbase − log δ15 Nlim − δ15 NTP
TPsca = + TPbase (4)
k (Supplementary Table 5).
A large majority, with 22 of 26 of the living FGs with sufficient
where number of δ15 N values to compare (n for both habitats > 5),
β0 − δ15 Nlim
k = − log( ) (5) had higher mean δ15 N values in open water than in fjord habitat
−δ15 Nlim (Supplementary Table 5). The proportion of the FGs with higher
and δ15 N values in open water than in fjords was 85% and the
median δ15 N values of the FGs were higher for open water
β0 than for fjord habitat (Wilcoxon two-sample paired-samples test;
δ15 Nlim = − (6)
β1 p = 0.001). Tests for equality between δ15 N values in fjord or
open water habitat within separate FGs in normally distributed
The approach adapted to Arctic ecosystems by Linnebjerg groups (mean) or for groups deviating from normal distributions
et al. (2016) and Golikov et al. (2019) was followed and δ15 Nbase (central tendency) showed significantly lower δ15 N values in fjord
was set to the δ15 N value of 7.20h for Calanus glacialis in habitat for sPOM (Supplementary Table 5). Average sPOM and
the Barents Sea and assuming TPbase to be 2.0. β0 and β1 are pPOM δ15 N values were 1.1 and 1.5h lower in fjords than for
coefficients used to calculate δ15 Nlim which is the highest δ15 N open water, respectively (Supplementary Table 5). Both sPOM
value with positive TEF. The values of β0 (5.92) and β1 (−0.27) and pPOM had largest variability in some Svalbard fjords at 77–
were estimated in a meta-analysis by Hussey et al. (2014a). 80◦ N (Supplementary Figure 1). Detrivorous echinoderms and
In this study, TPsca values were calculated for individual δ15 N small benthic mollusks also showed significant habitat differences
values at the data entry level before average TPsca values were with δ15 N values that were 1.3 to 2.0h lower in fjords than in
calculated for each FG. open water (Supplementary Table 5).
The residual TPs (TPec –TPlin ) from the linear best-fit model Benthic predatory invertebrate FGs, other small benthivorous
and the deviations (TPec –TPsca ) for the scaled model (Eqs 2 fishes, and Stichaeidae had δ15 N values that were 0.3 to 2.0h
and 3) for the 83 FGs were calculated and inspected visually in lower in fjords than in open water, but the differences were
plots. RMSD (Eq. 3) was calculated taking TPec as observed and not significant for single FGs (Supplementary Table 5). For
TPlin or TPsca as predicted values. The 83 FGs were aggregated pelagic invertebrates and fish groups, the δ15 N values did not
into 10 categories (Table 2) based on previous assignment of differ significantly between the open water and fjord habitat
functional groups into aggregated categories in the Ecopath (Supplementary Table 5).
model (Pedersen et al., 2021) and TP residuals for FGs were δ15 N values from the methane seep areas in the western
plotted in box plots. Whether residuals differed significantly part of the BS were included in the material (Åström et al.,
between FGs of these aggregated categories was examined using a 2019; Supplementary Table 1) and, among the taxa sampled,
Kruskal–Wallis test (Zar, 1999). Polar bears were not included in the chemosymbiotic polychaetes Siboglinidae had low deviating
this test since the test needs more than one value in each category. δ15 N values in the range of – 3.7 to 4.5h (Åström et al., 2019).
(IV) Maximum TP of FGs for the various methods were Some deviating low δ15 N values for pPOM and some benthic
recorded to indicate range of TP for the BS ecosystem. invertebrates from a spring bloom situation were observed in
the data set (Silberberger et al., 2018; Supplementary Table 1)
from the Vesterålen area (68o N) (Silberberger et al., 2018;
RESULTS Supplementary Figure 1). The values above were included
in the analysis.
Overview
A total of 83 functional groups of organisms had a total of 1,832
δ15 N values. The number of δ15 N values per FG varied from Comparison of Trophic Position From
1 to 126 (Table 2 and Supplementary Table 4). Many of the Ecopath and From Isotopes
δ15 N values had not been used to calculate TPSIR values in the On average, TPec was slightly higher than the original TPSIR
original sources and 759 TPSIR values from 65 functional groups reported in the literature sources with an average pairwise
were published in the original sources. In addition, the material difference of 0.10 TL (Supplementary Table 4), but the difference
included a total of 87 δ15 N values from samples of sediment was not significant (Wilcoxon two-sample paired test, n = 65;
organic matter (sPOM) (Supplementary Table 3). p = 0.07). TPec were strongly positively correlated with the
original TPSIR values in the papers (r = 0.89; p < 0.0001, n = 65)
Latitude and Habitat Effects (Figure 2). RMSD was 0.4 TP (Table 3).
For δ15 N values from both habitats and including pPOM, On the FG level and for data pooled from both habitats, TPec
iPOM and sPOM, δ15 N values and latitude were significantly was strongly positively correlated with FG mean δ15 N values
correlated for few (12%) FGs (Supplementary Table 5), (r = 0.90, n = 83) (Figure 3A and Supplementary Figure 2). The
with negative correlations for large bivalves (rs = −0.32, average δ15 N values for the three primary producer FGs were
Frontiers in Marine Science | www.frontiersin.org 7 March 2022 | Volume 9 | Article 813977Pedersen Comparison of Trophic Position Estimates
The δ15 N value of 4.4h for pPOM was chosen as δ15 N
baseline at TP of 1.0 for the linear best-fit model since
phytoplankton is the major primary producer FG in the
ecosystem (Sakshaug et al., 1994). The fit of the linear model for
both open water and fjord data (TPlin = 1 + (δ15 N – 4.4)/TEF),
resulted in a TEF of 3.0h (95% CI 2.9, 3.1). RMSD was 0.4
TP (Table 3). The TEF from the linear best-fit model was
within the range of 2.7 to 3.8h published for the BS ecosystem
(Supplementary Table 6) (Figure 4). The linear best-fit model
was intermediate compared to published linear TP-SI models
for BS that were based on various values for TPbase (1, 2, or 3),
δ15 Nbase values, and TEF values (Figure 4).
For the linear model for both open water and fjord data,
the median of the residuals for TP of FGs (Polar bears was
not included) differed significantly between aggregated categories
(Kruskal–Wallis, χ2 = 21.8, df = 8; p = 0.005) (Figure 5). Whales
and the pelagic invertebrate FGs had predominantly positive
residuals (TPlin < TPec ) while the benthic detritivorous- and
predatory invertebrate FGs had predominantly negative residuals
(TPlin > TPec ) (Figure 5). Seals, birds, benthic, demersal, and
FIGURE 2 | Comparison of trophic positions estimated through Ecopath pelagic fish FGs had residuals centered approximately around
(y-axis) and average trophic positions for each functional group (x-axis) from zero (Figure 5).
stable isotopes (TPSIR ) based on TP values reported in the literature sources. At the FG-level, the five FGs with the highest positive residuals
Symbols are shown for aggregated categories. Continuous line shows linear
were: small Greenland halibut (1.1 TP), Ctenophora (0.9 TP),
regression line and stippled lines show 95% confidence intervals.
Atlantic salmon (0.9 TP), pelagic amphipods (0.8 TP), and blue
whales (0.7 TP). The groups with the five most negative residuals
were: other gulls and surface feeders (−1.0 TP), capelin (3+)
similar: phytoplankton (pPOM) (4.4h, SD = 2.0, n = 78), ice (−0.8 TP), predatory asteroids (−0.7 TP), predatory gastropods
algae (iPOM) (4.2h, SD = 1.4, n = 24) and macroalgae (4.6h, (−0.6 TP), and detrivorous echinoderms (−0.6 TP).
SD = 1.2, n = 63) (Supplementary Table 4). The average δ15 N The alternative linear model for all habitats with pPOM as
value of sPOM (av. 5.0h, SD = 1.7, n = 87) was also similar to the Nbase assuming a TPbase of 1.2 resulted in a TEF of 3.2h (95%
values for the primary producers. CI 3.1, 3.4) and a RMSD of 0.4 TP (Table 3). To test if inclusion
TABLE 3 | Overview of major results from comparison of trophic positions from Ecopath and calculation of trophic positions using fixed fractionation (linear model) and
scaled fractionation.
Model Data TPbase , δ15 Nbase Measure and/or variables Value (n)
Linear Both habitats, published TPSIR Various r for TPec vs. TPSIR 0.89 (65)
RMSD 0.4 TP
Both habitats 1.0, 4.4h r for TPec vs. δ15 N values 0.90 (83)
TEF 3.0h
RMSD 0.4 TP
Maximum TPlin 5.4
1.2, 4.4h r for TPec vs. δ15 N values 0.90 (83)
TEF 3.2h
RMSD 0.4 TP
Maximum TPlin 5.3
Only open water 1.0, 4.9h r for TPec vs. δ15 N values 0.82 (68)
TEF 2.9h
RMSD 0.5 TP
Maximum TPlin 5.4*
Scaled Both habitats 2.0 RMSD 0.6 TP
Maximum TPsca 6.0
Only open water 2.0 RMSD 0.6 TP
Maximum TPsca 6.0*
*All polar bears were assumed to belong to open water habitat.TP, trophic position; r, Pearson correlation coefficient; n, number of functional groups.
Frontiers in Marine Science | www.frontiersin.org 8 March 2022 | Volume 9 | Article 813977Pedersen Comparison of Trophic Position Estimates
values were strongly correlated to TP from Ecopath (r = 0.82,
n = 68). The value for pPOM was used as baseline (Nbase = 4.9h)
and the fit of the linear model for the open water material
(TPlin = 1 + (δ15 N – 4.9)/TEF) resulted in a TEF of 2.9h (95%
CI 2.7, 3.0) which was very similar to the TEF estimated for the
total material from both habitats. The fit of the linear model to the
average FG values and the test for differences in residuals between
categories (Kruskal–Wallis, χ2 = 24.8, df = 8; p = 0.002) and the
residual patterns for open water data was also very similar to the
fit for the data from both habitats (Supplementary Figure 3).
RMSD was 0.5 TP (Table 3). This imply that the major patterns
in between FG variability of TP were similar for the two data sets
(both habitats vs. open water only).
Trophic Positions From Scaled Model
and Range of Trophic Position
Trophic positions for FGs calculated by the scaled model with
a reference TP of 2.0 for the total material from both habitats
showed a curved relationship between TPsca and δ15 N values
(Figure 6). TPsca were lower than the TPec for most FGs with the
largest differences for TPsca between ca. 2.5 to 4.5 (Figure 3B).
RMSD was 0.6 TP (Table 3). The results when applying the scaled
model on open water δ15 N values were very similar to the results
from the scaled model for all habitats (Supplementary Figure 4)
and RMSD was 0.6 TP (Table 3).
Trophic positions from Ecopath ranged from 1.0 for primary
producers to 5.1 for polar bears. The maximum TPlin estimated
by the linear best-fit model for the total material was 5.4 for polar
bears. The TPsca for polar bears from the scaled model TP was 6.0
(SD = 1.6, n = 43) which is 0.9 higher than the TPec for polar bears
(Figure 3B and Table 3). Among the original published TPSIR
values, Greenland shark had the maximum FG average with a TP
of 4.5 but there was no TP estimate for polar bears.
Trophic Enrichment Factors From
Published Experiments and Field Studies
With Known Diet
Median TEF was 3.5h (n = 7) and 2.7h (n = 12) for
detritivorous invertebrates and for vertebrates, respectively
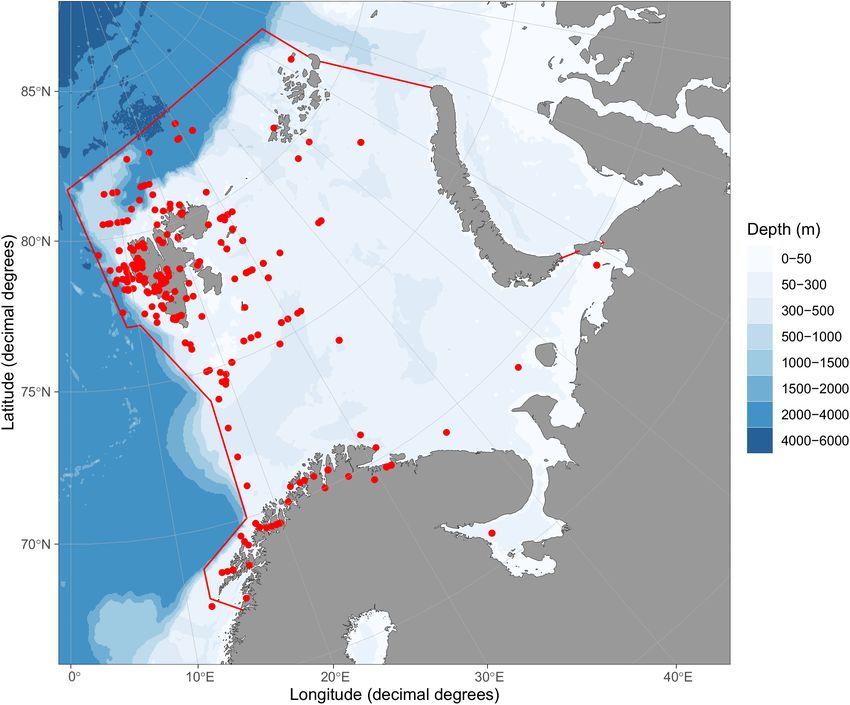
FIGURE 3 | Relationship between trophic positions estimated from Ecopath
(y-axis) and from alternative models (linear and scaled) from δ15 N values for 83 (Supplementary Table 7). The TEF values of detritivorous
functional groups (x-axis) for the Barents Sea for both open water and fjord invertebrate FGs were significantly higher than for vertebrates
habitats. Symbols show FGs in major categories. (A) Trophic position (whales, seals, polar bear and fish FGs) (Figure 7) (Mann–
estimated from Ecopath (y-axis) and line shows trophic positions predicted by Whitney, U = 13; p = 0.02). Polar bears had a relatively low TEF
linear best-fit model from δ15 N values (x-axis) [TPlin = 1 + (δ15 N + 4.4)/3.0].
of 2.0h.
(B) Trophic position from Ecopath (TPec , y-axis) and trophic position
estimated by scaled model (TPsca ) from δ15 N values (Eq. 3, x-axis) for
functional groups. Stippled line show (1:1) line. In the scaled model, baseline
TP (TPbase ) was 2.0 and baseline δ15 N value (δ15 Nbase ) was set to 7.2h. DISCUSSION
Variability in Trophic Positions and δ15 N
of the SI data from fjords had a major influence on the results, Values Related to Latitude and Habitat
an analysis with only open water data were undertaken. The The limited range in δ15 N values for both sPOM and pPOM in
data from open water comprised 708 δ15 N values from 68 living BS open water habitat along the latitudinal gradient, suggest that
functional groups and in addition, there was 52 δ15 N values from there were small changes with latitude for δ15 N values at the base
sediment samples. The average δ15 N value for pPOM of 4.9h of the food web. In a meta-analysis based on δ15 N values for a
(SD = 1.7), based on 39 values for open water, was higher than number of species from the Svalbard area, Hoondert et al. (2021)
the value for the total material (4.4h). At the FG level, δ15 N found no latitudinal effect. Phytoplankton is the main primary
Frontiers in Marine Science | www.frontiersin.org 9 March 2022 | Volume 9 | Article 813977Pedersen Comparison of Trophic Position Estimates
FIGURE 4 | Comparison of 29 published linear relationships between trophic positions (TP) and δ15 N values from literature from the Barents Sea Large Marine
Ecosystem. Red bold line show the linear best-fit model for the TP- δ15 N value relationship estimated in this study for all habitats. The linear best-fit relationship had a
δ15 Nbase value of 4.4h for TPbase = 1 and a TEF of 3.0h. Values for the published SI-TP relationships are given in Supplementary Table 6. Sources for
short-names in the figure legend; Born (Born et al., 2003), Fuhrmann (Fuhrmann et al., 2017), Hallanger (Hallanger et al., 2011b), Haug (Haug et al., 2017), Haukås
(Haukås et al., 2007), Hop a and b (Hop et al., 2002), Jæger (Jæger et al., 2009), Legeżyńska (Legeżyńska et al., 2012), McMeans (McMeans et al., 2013), Muir
(Muir et al., 2003), Nilsen a and b (Nilsen et al., 2008), Nygård a and b (Nygård et al., 2012), Paar (Paar et al., 2019), Ruus a–f (Ruus et al., 2015), Sokołowski a and b
(Sokołowski et al., 2014), Tamelander (Tamelander et al., 2006), Vieweg (Vieweg et al., 2012), Wold a and b (Wold et al., 2011).
producer in the BS (Sakshaug et al., 1994), and nitrate is the major water at West-Greenland for Calanus finmarchicus and the krill
source of nitrogen for phytoplankton during the spring/summer species Thysanoessa raschii (Hansen et al., 2012). The latitudinal
bloom in the BS (Tamelander et al., 2009). In support of limited trend at West-Greenland was explained as a result of high δ15 N
range in baseline δ15 N value at both low and high latitudes within values in high Arctic blooms due to partial depletion of the nitrate
the BS, seawater nitrate δ15 N had stable values of c. 5.1h for both pool and higher renewal by deep nitrate resulting in lower δ15 N
Atlantic and Arctic water in the BS (Tuerena et al., 2020). Tuerena values further south (Hansen et al., 2012). Carroll et al. (2014)
et al. (2020) found no clear trend in δ15 N values for nitrate or observed that δ15 N values of the large bivalve Ciliatocardium
for particulate nitrogen with increasing latitude in the BS. This ciliatum was lower in Artic than in Atlantic waters in the BS
apparent stability in BS in lower TP δ15 N values is in contrast to and this is consistent with the trend in the total material in this
persistent latitudinal gradients in δ15 N values in the North Sea study. The authors suggested that this difference may be due to
and at West-Greenland (Jennings et al., 2008; Hansen et al., 2012; higher rates of primary production, recycling in the pelagic and
MacKenzie et al., 2014). heterotrophy in Atlantic than in Arctic waters (Carroll et al.,
That only a few FGs showed a change in δ15 N values with 2014). When large bivalves are used as baseline organisms for
latitude in the BS may be a result of a relatively stable baseline estimation of TP from δ15 N, spatial trends in their δ15 N values
δ15 N value. The decrease in δ15 N values with increasing latitude will affect TP estimates for higher TPs.
observed in some FGs [large bivalves, large epibenthic suspension For polar cod, the decrease in δ15 N values with latitude may be
feeders, and polar cod (2+)] reflect effects on δ15 N values that caused by a change in diet composition with increasing latitude.
hypothetically may be caused by changes in temperature or diet Polar cod inhabiting drift ice in the northernmost area of the
composition and quality with latitude. The decreasing trend in BS feed, to a large degree, on symphagic fauna (Lønne and
δ15 N values with latitude in the BS for the three FGs is opposite to Gulliksen, 1989) while the diet of polar cod in open water may
the increase in δ15 N values with increasing latitude found in open be more varied including copepods, pelagic amphipods, krill and
Frontiers in Marine Science | www.frontiersin.org 10 March 2022 | Volume 9 | Article 813977Pedersen Comparison of Trophic Position Estimates
FIGURE 5 | Box-plot of residuals for trophic position values from Ecopath for functional groups predicted by the linear best-fit model for trophic position from δ15 N
values. The functional groups were grouped into major categories. The linear best-fit relationship had a δ15 Nbase value of 4.4h for TPbase = 1 and a TEF of 3.0h
estimated for all habitats (open water and fjord). Positive residuals shows when TP from Ecopath is larger than predicted from δ15 N values. Black points show
residuals for individual FGs within each major category. Vertical line in boxes show median and boxes show 25–75% quartiles and whiskers show minimal and
maximal values.
fish (Aune et al., 2021). Symphagic fauna in the drift ice may pPOM used as baseline value (4.4h for both habitats compared
have lower TP than diet sources in open water which may cause to 4.9h for open water habitat) for the linear model results was
the observed trend. In support of this, the symphagic amphipod low since the estimates of TEF (2.9 vs. 3.0h) for the two data sets
Apherusa glacialis which is a dominating prey source for polar were similar (Table 3). This suggest that the overall effect of the
cod in ice covered habitats had very low mean δ15 N values in the terrestrial input of light nitrogen to the fjords on the results for
study (5.4h) compared to iPOM (4.8h) (Kohlbach et al., 2016), FGs at higher trophic positions is low.
and consumption of these amphipods may have contributed to In this study, the fjord areas, especially in the Svalbard area,
the low δ15 N values of polar cod at high latitudes. generally had a high density of samples and data entries per
The difference between open water and some fjords at unit area compared to the large open water area (Figure 1).
Svalbard which had lower δ15 N values for sPOM than in open Despite the variability in pPOM, the isotopic baselines for the
water have also earlier been observed by Knies et al. (2007). There total material comprising both open water and fjord (4.4h) and
is freshwater supply of particulate terrestrial organic nitrogen the open water habitat (4.9h) were similar (Table 3). Thus, the
with low δ15 N values in some high Arctic fjords at Svalbard fjord-open water habitat effect did not largely affect the linear
(Koziorowska et al., 2016; McGovern et al., 2020). Low δ15 N best-fit estimates of TEF, RMSD and maximum TP. This suggests
values in particles in freshwater runoff to inner fjord areas at that this habitat-difference does not markedly affect the results
Svalbard may contribute to low δ15 N values for lower TP benthic from the comparison of TPs from SI and Ecopath.
invertebrate FGs in fjord areas at Svalbard (McGovern et al., That open water had higher δ15 N values than some fjords
2020). The very low δ15 N values both in sediments (sPOM), for sPOM and benthic invertebrates in the Barents Sea is in
pelagic POM (pPOM) and benthic invertebrates from some fjord contrast to the pattern observed along the coast of Greenland,
areas at Svalbard, suggest a bottom-up effect propagating from where higher δ15 N values were observed in pelagic groups in
phytoplankton and detritus to benthic invertebrate detritivores fjords than offshore (Hansen et al., 2012). The inshore-open water
and benthic invertebrate predators. The lack of a clear fjord-effect gradient in lower trophic level δ15 N values in the Barents Sea are
for major zooplankton FGs (e.g., medium sized copepods and also in contrast to the large gradient in the North Sea with high
Thysanoessa) may be caused by advection of these FGs into fjord δ15 N values in the southern shallow part with large freshwater
areas from open water areas. The effect of the lower δ15 N value for input than the lower δ15 N values in the deeper northern North
Frontiers in Marine Science | www.frontiersin.org 11 March 2022 | Volume 9 | Article 813977Pedersen Comparison of Trophic Position Estimates
FIGURE 6 | Relationship between trophic position from scaled model (TPsca ) and δ15 N values for various functional groups (FGs).
Sea (Jennings et al., 2008; MacKenzie et al., 2014). The habitat between TPec and TPlin estimated using the linear best-fit model,
gradient in δ15 N values from the Barents Sea resembles the also indicates a good correspondence between the two methods.
pattern in the Beaufort Sea with low δ15 N values in terrestrial The deviations from the linear best –fit linear TP- SI
organic material from river input (Bell et al., 2016). relationship estimated in this study may be caused by factors
The deviating low δ15 N values for some FGs from areas affecting both the TPs from Ecopath and from δ15 N values.
with methane seeps in the western part of the BS have been That most pelagic invertebrate FGs had higher TPec than TPlin
well described by Åström et al. (2019). The few deviating low (positive residuals), may indicate that these FGs had low TEF
δ15 N values for pPOM and some benthic invertebrates from the values. Microzooplankton FGs are included in the Ecopath
southern part of the BS LME (Silberberger et al., 2018), probably model with the FGs heterotrophic nanoflagellates, ciliates, and
indicate local effects that did not markedly affect the overall heterotrophic dinoflagellates, but no SI values were available for
results because of the low number of entries identified as outliers these FGs. Experiments indicate that protists may be isotopically
(Silberberger et al., 2018). “invisible” using bulk stable isotopes due to their very low bulk
δ15 N value enrichment (Gutiérrez-Rodríguez et al., 2014; Landry
and Décima, 2017; Park et al., 2021). The microzooplankton FGs
Comparison of Trophic Positions are active and have a large production in the BS, and ciliates
Estimated From Ecopath and Linear and dinoflagellates are important prey groups for a number of
Trophic Position-SI Relationship pelagic invertebrate FGs (Rat’kova and Wassmann, 2002; De
The TPec values from Ecopath and the original TPSIR from stable Laender et al., 2010; Pedersen et al., 2021). In the Ecopath model
isotopes were similar for most FGs in the BS ecosystem. TPSIR used in this study for the BS, microzooplankton amounted to
was calculated using linear TP-SI relationships were based on a 7–32% of the diet of the copepods FGs, krill (Thysanoessa) and
various baseline organisms, baseline δ15 N value and TEF values, pelagic amphipods (Pedersen et al., 2021). Thus, a low TEF of
and were calculated for different purposes. The strong correlation the microzooplankton FGs may contribute to low δ15 N values
Frontiers in Marine Science | www.frontiersin.org 12 March 2022 | Volume 9 | Article 813977Pedersen Comparison of Trophic Position Estimates
producing detritus. This may contribute to a reduce TPs from
Ecopath compared to TPs from SI.
The higher TPlin than TPec of benthic invertebrate FGs could
also indicate relatively high values for TEF for these FGs in the BS.
This interpretation is supported by the relatively high TEF values
from experiments with detritivorous invertebrates. Vanderklift
and Ponsard (2003) found that mollusks and crustaceans
had lower TEF and related this to the mode of nitrogen
excretion. Crustaceans and mollusks excrete ammonia (i.e., are
ammonotelic) and had lower TEF than taxonomic groups that
were ureotelic or uricotelic. However, in this study, the two
other important taxa dominating among benthic detritivorous
FGs, polychaetes and echinoderms, also excrete ammonia to a
large degree (Davoult et al., 1991; Thiel et al., 2017). Thus, it is
more likely that the low TEF values of the benthic detritivorous
FGs in this study are related to diet composition than to
FIGURE 7 | Comparison of trophic enrichment factors (TEF) from published
nitrogen excretion mode.
experiments and field studies with known diet for benthic invertebrates and
vertebrates (mammals, fish, and birds) that are present in the Barents Sea at
Fractionation is dependent on diet quality and Adams and
least at the genus level. Each black point represent an estimated TEF value. Sterner (2000) found that TEF of a zooplankton species (Daphnia
Vertical line in boxes show median and boxes show 25–75% quartiles and magna) increased with increasing carbon:nitrogen ratio in the
whiskers show minimal and maximal values. Supplementary Table 7 gives food. In the marine fish Fundulus heteroclitus, TEF was largest
details on literature sources.
for diets with low δ15 N values, i.e., a larger difference between
consumer and diet δ15 N values (Elsdon et al., 2010). In this study,
it seems most likely that the negative residuals for most benthic
invertebrate FGs are due to high TEF values for detritivorous
for their predator FGs and hence low TPlin values and positive FGs feeding on low quality detritus (i.e., high C:N ratio) and that
residuals. There are few experimental data on TEF for pelagic predatory benthic invertebrates get relatively high δ15 N values
invertebrates. That the predominantly herbivorous pelagic FGs because their benthic detritivorous invertebrate prey have high
(copepod groups and krill groups) had small residuals indicate δ15 N values.
higher TEF values than for the pelagic planktonic predators such Seasonal variation in δ15 N values are common in aquatic
as pelagic amphipods, cephalopods, Ctenophora, and Scyphozoa invertebrates (Woodland et al., 2012), and seasonal variability
which had high residuals, and this may fit with the diet- in baseline δ15 N value may potentially affect the usefulness
quality hypothesis. of TP-SI models. The pelagic primary production in Arctic
The positive residuals from the linear TP-SI relationship for ecosystems is highly seasonal and food pulses propagate to
whales may suggest that this group also had relatively low TEF higher trophic levels with time delay (Falk-Petersen et al., 2007).
compared to other groups, and the low values for TEF from The spring phytoplankton bloom is based on nitrate as its
literature sources for whales may give support to this explanation. main nutrient, but after the bloom phytoplankton production is,
The whale FGs with SI data in this study included baleen and to a large degree, based on regenerated nutrients (Kristiansen
toothed whales and long distance seasonal migrants (blue whales, et al., 1994; Tamelander et al., 2009). This may contribute to
fin whales, minke whales) and all-year resident whales in the seasonal variations in δ15 N values and computed trophic position
Barents Sea (e.g., harbor porpoise and killer whales). Individual for species and FGs (Hoondert et al., 2021). Some FGs (e.g.,
feeding specialization was found for killer whales and polar bears copepod FGs) are omnivorous and change diet seasonally from
(Blévin et al., 2019; Jourdain et al., 2020). Some killer whales phytoplankton in spring and summer to protozoa and detritus
specialize in feeding on coastal seals and show high δ15 N values during summer (De Laender et al., 2010; Kohlbach et al., 2021).
while the majority of the individuals feed on herring (Jourdain Generally, high δ15 N values of have been observed in several FGs
et al., 2020), and have relatively low δ15 N values and low standard during winter and spring when feeding at lower trophic levels are
deviation of δ15 N value (SD = 0.05) (Supplementary Table 4). reduced (Olive et al., 2003; Hertz et al., 2015). Hertz et al. (2015)
Benthic detritivorous and benthic predatory invertebrate FGs found an average increase in δ15 N values of fasting of 0.5h, and
were the other aggregated categories deviating most from the in the BS, Carroll et al. (2014) found higher δ15 N values (ca.
linear average TP- SI model with higher TPlin than TPec . It is 0.5–1.0h) in the large bivalve Ciliatocardium ciliatum during
possible that the diet composition of benthic detritivorous FGs spring than in fall. That the majority of stable isotope samples in
in Ecopath generally contain too little heterotrophic FGs (e.g., the material analyzed in this paper were sampled during spring,
bacteria and other microorganisms) and this may contribute summer, and autumn suggest that they were representative of the
to relative low TPec of these FGs compared to TP from stable most productive season.
isotopes. In Ecopath, all detritus are assigned to TP = 1.0 by Other factors, such as ontogeny and gender, may also influence
convention, while the δ15 N values of detritus from organisms at δ15 N values. Ontogenetic effects are partly included in the
higher TPs are likely to correspond to the TP of the organisms Ecopath model by the specification of multi-stanza FGs for
Frontiers in Marine Science | www.frontiersin.org 13 March 2022 | Volume 9 | Article 813977You can also read