Comparative analysis of current - health expenditure and mortality from COVID-19 by countries - REVISTA AVFT.COM
←
→
Page content transcription
If your browser does not render page correctly, please read the page content below

Comparative analysis of current
      health expenditure and mortality
      from COVID-19 by countries
      Análisis comparativo del gasto corriente sanitario y la mortalidad por COVID-19 por países

          Irina V. Spichak;   Irina V. Zhirova;   Maryna V. Podgaina;   Yulia V. Korzh;   Alina O. Ivashchenkova
      1
      Belgorod State University, 85, Pobedy St., Belgorod, 308015, Russia
      2
      National University of Pharmacy, 53, Pushkinska St., Kharkiv, 61002, Ukraine; sm211@ukr.net
      *Corresponding author: Irina V. Zhirova, Belgorod State University, 85, Pobedy St., Belgorod, 308015, Russia; Email: zhirova@bsu.edu.ru
      Received/Recibido: 06/28/2020       Accepted/Aceptado: 07/15/2020      Published/Publicado: 09/09/2020         DOI: 10.5281/zenodo.4266533

      Abstract                                                                               Resumen

      The research aimed to conduct a comparative assessment                                 El objetivo de la investigación fue realizar una evaluación
      of mortality rates from COVID-19 and health expenditure in                             comparativa de las tasas de mortalidad por COVID-19 y el
      countries, where the COVID-19 had been found, in order to                              gasto en salud en los países donde se presenta el COVID-19,
      establish the correlation between these two indicators.                                para establecer la correlación entre estos dos indicadores.

      Materials and methods. Data about current health ex-                                   Materiales y métodos. Los datos sobre el gasto actual
      penditure per capita have been taken from the Data World                               en salud per cápita se han tomado del Banco Mundial de
      Bank from the World Health Organization Global Health                                  Datos de la base de datos de gastos mundiales en salud
      Expenditure Database. Worldwide mortality data of corona-                              de la Organización Mundial de la Salud. Los datos mundia-
544   virus have been used from Johns Hopkins University and                                 les de mortalidad por coronavirus se han utilizado los de
      medicine Coronavirus resource center where actual data of                              la Universidad Johns Hopkins y el Centro de Recursos De
      incidence and fatal cases are presented.                                               Medicina Coronavirus, donde se presentan datos reales de
                                                                                             incidencia y casos fatales.
      Results. The results of the analysis have shown: among
      countries with a low level of health expenditures per capita                           Resultados. Los resultados del análisis han demostrado
      the smallest share has corresponded to the countries with a                            que, entre los países con un bajo nivel de gasto en salud per
      high COVID-19 fatality rate – less than 20% (22 countries).                            cápita, la proporción más pequeña corresponde a los países
      Assessment of the volume of expenditures of these 22 coun-                             con una alta tasa de mortalidad de COVID-19, menos del
      tries indicates: 2 of them (9%) have had health expenditures                           20% (22 países). Se ha obtenido una evaluación del volumen
      per capita higher 2000$ (Italy and Spain), 4 of them (18%)                             de gastos de estos 22 países: 2 de ellos (9%) han tenido gas-
      – from 1000$ to 2000$, and 4 countries have had health ex-                             tos de salud per cápita superiores a 2000 $ (Italia y España),
      penditures per capita less 200 $.                                                      4 de ellos (18%) - de 1000 $ a 2000 $, y 4 países han tenido
                                                                                             gastos de salud per cápita menos 200 $.
      Conclusions. The results of our comparative study of health
      expenditures to COVID-19 case-fatality convincingly show                               Conclusiones. Los resultados de nuestro estudio compara-
      that the absence of a direct correlation between the volume                            tivo de gastos en salud para la letalidad de COVID-19 de-
      of health expenditure of the country and the COVID-19 fatal-                           muestran de manera convincente la ausencia de correlación
      ity index.                                                                             directa entre el volumen de gasto en salud del país y el índice
                                                                                             de letalidad de COVID-19.
      Keywords: COVID-19, pandemic, health expenditure, com-
      parative analysis.                                                                     Palabras clave: COVID-19, pandemia, gasto en salud, aná-
                                                                                             lisis comparativo.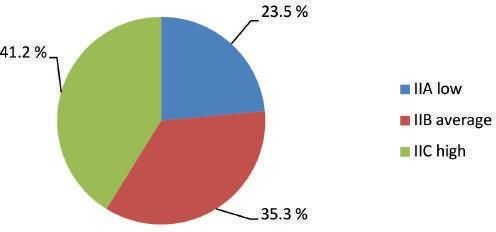
Introduction                                                          for COVID-19

Over the past few decades, a large number of people have            5. Guidance for laboratories shipping specimens to WHO
been affected by the 3 epidemics caused by coronavirus                 reference laboratories that provide confirmatory testing for
family (SARS-2003, MERS-2012, and COVID-2019) in the                   COVID-19 virus
world. A novel coronavirus spillover event, with its epicenter in   6. Laboratory Assessment Tool for laboratories implementing
Wuhan, People’s Republic of China, has emerged as a public             COVID-19 testing
health emergency of international concern. This began as an         7. Scientific brief: Advice on the use of point-of-care immuno-
outbreak in December 20191. Nevertheless, there is a sub-
                                                                       diagnostic tests for COVID-19.
stantial genetic dissimilarity between pathogens of the three
previous epidemics, in particular, MERS with COVID-19. In           The epidemic of COVID-19 has caused public health
the previous epidemics, initial hotspots of diseases were the       crises. In the coming weeks and months, viral tests for the
Middle East, Saudi Arabia (MERS), and China and animal to           presence of COVID-19 infection as well as serological tests
human and then human to human transmissions of patho-               for antibodies and to measure the prevalence of the disease
gens were reported in other countries2-5.                           are crucial. Governments, businesses and households will
                                                                    rely on the data of these tests when deciding on the path

                                                                                                                                       AVFT Archivos Venezolanos de Farmacología y Terapéutica
Severe acute respiratory syndrome coronavirus (SARS-
                                                                    ahead. However, local test data is not currently available to
CoV)-2, a novel coronavirus from the same family as SARS-
                                                                    the public, and there is no comprehensive set of this data in
CoV and Middle East respiratory syndrome coronavirus, has
                                                                    one place12.
spread worldwide leading the World Health Organization to
declare a pandemic. The disease caused by SARS-CoV-2,               The number of COVID-19 cases has risen substantially in the
coronavirus disease 2019 (COVID-19), presents flu-like              world compared to SARS and MERS, and it would probably

                                                                                                                                                                                                 Volumen 39, número 5, 2020
symptoms that can become serious in high-risk individuals13.        take longer to halve the disease cases; meaning that control
                                                                    measures would have to be in place for a longer period. WHO
Coronavirus disease 2019 (COVID-19) is a newly emerged
                                                                    has announced that the Coronavirus epidemic is progressive-
disease that has become a global public health concern as
                                                                    ly increasing in three countries, including Italy, South Korea,
it rapidly spread around the world. The etiologic agent re-
                                                                    and Iran. The shared string that links these three countries
sponsible for this disease has been named as severe acute
                                                                    is the pandemic of MERS in 2013, which was transmitted
respiratory syndrome coronavirus-2 (SARS-CoV-2) by the
                                                                    through close human-to-human contacts. Some studies were
International Committee on Taxonomy of Viruses as it shows
                                                                    carried out to review different epidemiological and clinical as-
similar genomic features to that of SARS-CoV which caused
                                                                    pects of the new emerging disease along with specific mea-
a pandemic in 2002.                                                 sures by countries at the community level14-25,35.
In February 2019, the World Health Organization (WHO),
                                                                    The economic effects of COVID-19 around the world have
worked with an international network of statisticians and
                                                                    been described on The World Economic Forum COVID
mathematical modelers to estimate key epidemiologic                 Action Platform26. Confirmed cases of the COVID-19 coro-
parameters of COVID-19, such as the incubation period (the          navirus have topped 4 million globally. Businesses are cop-
time between infection and symptom onset), case fatality            ing with lost revenue and disrupted supply chains as factory
ratio (CFR, the proportion of cases that die), and the serial       shutdowns and quarantine measures spread across the                545
interval (the time between symptom onset of a primary
                                                                    globe, restricting movement and commerce. Unemployment
and secondary case). These values were published in the
                                                                    is skyrocketing, while policymakers across countries race to
Situation Report–30 and were considered preliminary and
                                                                    implement fiscal and monetary measures to alleviate the fi-
parameters were updated as more information become                  nancial burden on citizens and shore up economies under
available. Future modeling can support decision-making              severe strain.
but needs to be combined with rigorous data collection and
comprehensive analysis of the situation6-9.                         In the US, the unemployment rate in April climbed to 14.7% - a
                                                                    post-war record - as more than 20 million Americans lost their
Worldwide, the COVID-19 pandemic is causing significant
                                                                    jobs. The news comes after the US Commerce Department
loss of life, disrupting livelihoods, and threatening recent
                                                                    reported a rapid decline in the gross domestic product (GDP)
health advances and progress toward global development              in the first three months of the year on 29 April. GDP dropped
goals, according to the WHO World Health Statistics 202010.
                                                                    by 4.8% in the first quarter of 2020 - the sharpest contraction
Given the significance of the problem WHO has developed             since the global financial crisis of 2007-2009 - bringing to an
technical guidelines on COVID-1911:                                 end the longest economic expansion in US history.

1. WHO interim guidance for laboratory testing                      On 15 April, the International Monetary Fund (IMF)
2. WHO interim guidance for laboratory biosafety related to         warned economies in Asia would see no growth this year, for
   COVID-19 virus                                                   the first time in 60 years, with the service sector particularly
                                                                    under pressure. National lockdowns across the region have
3. Molecular assays to diagnose COVID-19 virus                      meant airlines, factories, shops, and restaurants have suf-
4. WHO reference laboratories providing confirmatory testing        fered the greatest economic shocks. On 20 March, the United

                                                                                                           www.revistaavft.com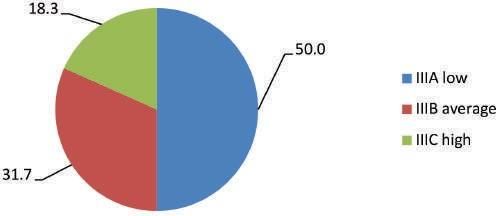
Kingdom (UK) announced radical fiscal spending measures                        Results and Discussion
      to counter the economic impact of a worsening crisis. The
      government said it would pay up to 80% of the wages of em-                     According to WHO, there are current health expenditures
      ployees across the country unable to work, as most business-                   per capita for 268 countries all over the world. At the same
      es shut their doors to help fight the spread of coronavirus.                   time, there are 151 countries where COVID-19 incidence has
      Earlier in the month, the Danish government announced it                       been confirmed. From the 151 countries with COVID-19 cas-
      would help private companies struggling to manage the fall-                    es, 7 countries have been presented into the WHO’s Global
      out from the pandemic by covering 75% of employees’ sala-                      Health Expenditure database but the indicator it had not been
      ries if firms agreed not to cut staff. Denmark has announced                   given: Albania, Kosovo, Libya, Montenegro, Somalia, Syria,
      restrictions on companies that are registered in tax havens                    Yemen; and there were 5 countries with COVID-19 cases that
      from accessing financial aid. Companies applying for state                     even haven’t been presented into the WHO’s Global Health
      aid will also have to commit to not paying dividends or make                   Expenditure database: Angola, Burma, Diamond Princess,
      share buy-backs this year and next. Poland had already an-                     Iceland, Taiwan. So, comparative analyses of COVID-19 fatal
      nounced restrictions on access to state aid based on whether                   cases and current health expenditures per capita have been
      large firms pay taxes in the country.                                          conducted for 139 countries.
                                                                                     We have ranged the list of countries by COVID-19 fatal cases
      The European Union more broadly has implemented fiscal
                                                                                     from the lowest to the highest, and if the countries had the
      measures to shore up the economy worth more than €3 tril-
                                                                                     same rate it was placed at the same rank. So it has been
      lion26,34.
                                                                                     ranged from 1 (the country with the lowest case-fatality) to 78
      Given the acute urgency of the COVID-19 pandemic, the re-                      (the country with the highest case-fatality). The case-fatality in-
      search aimed to conduct a comparative assessment of mor-                       dicator shows the number of deaths/per 100 confirmed cases
      tality rates from COVID-19 and health expenditure in coun-                     (observed case-fatality ratio). Then using the method of equal-
      tries, where the COVID-19 had been found, to confirm or                        ity of intervals, it was proposed three main groups of countries
      refute the correlation between these two indicators.                           in terms of mortality among the identified cases and it was
                                                                                     assigned the codes A - countries with low case-fatality from
                                                                                     COVID-19 (1-25 country’s number in the range), B - countries
                                                                                     with average case-fatality from COVID-19 (26-52) and C -
      Materials and Methods                                                          countries with high case-fatality from COVID-19 (53-78).
      Here, we provide an overview of the current health expenditure                 The data about current health expenditures per capita have
      per capita and fatality cases from COVID-19 by countries.                      been analyzed by Method of Equal-Appearing Intervals36. All
                                                                                     139 countries have been divided into three groups - index I
      Data about current health expenditure per capita were taken
                                                                                     countries with high health expenditures per capita (expendi-
      from Data World Bank from the World Health Organization
                                                                                     ture from 10246.1 to 6837.2 $), index II countries with aver-
      Global Health Expenditure database, last updated date -
                                                                                     age health expenditures per capita (from 5904.5 to 3428.3
      09.04.2027. Despite this, we consider it expedient to conduct
                                                                                     $), index III countries with low health expenditures per capita
      a comparative analysis, because the main trends and ratios
                                                                                     (from 3361.6 to 19.4$).
      of the analyzed indicators are preserved.
546                                                                                  Accumulation both of indicators allowed to propose a con-
      Worldwide mortality data of coronavirus have been used from                    solidated “cost-fatality” index. If there is an indirect correlation
      Johns Hopkins University and Medicine Coronavirus resource                     between the volume of health expenditures and COVID-19
      center where actual data of incidence and fatal cases are pre-                 fatal cases, consolidated “expenditure - fatality” index will
      sented. Data on May 17, 2020, have been analyzed28-32.                         show the lowest fatality in countries with high health expendi-
                                                                                     tures per capita (IA) and the highest fatality in countries with
                                                                                     low health expenditures per capita (IIIC).
       Table 1. Results of complex comparative analyzes of health expenditure per capita and COVID-19 fatality in countries with high (I) and
       average (II) health expenditures level
                                   Range number by health                                                                                         Consolidated
      Current health expenditures                                                 Range number by        Confirmed            Case-Fatality
                                  expenditures per capita (of   Country Name                                         Deaths                   “expenditure -fatality”
          per capita, $, 2017                                                    Case-Fatality (of 78)     cases                 In %
                                            139)                                                                                                     index
             10246.13867                      1                  United States           49              1.508.308   90.347        6.0                   IB
             9956.259766                      2                   Switzerland            51                30.597     1.886        6.2                   IB
              7936.375                        3                     Norway               23                 8.257      233         2.8                  IA
             5904.583984                      4                     Sweden               70                30.377     3.698       12.2                  IIC
             5800.151367                      5                    Denmark               42                11.166      548         4.9                  IIB
             5782.628418                      6                  Luxembourg              22                 3.947      107         2.7                 II A
             5331.817871                      7                    Australia             13                 7.068       99         1.4                 II A
             5033.452148                      8                    Germany               39               176.551     8.003        4.5                 II B
             4976.862305                      9                     Ireland              53                  24.2     1.547        6.4                 II C
             4939.875488                      10                    Austria              32                16.269      629         3.9                 II B
             4911.44043                       11                 Netherlands             71                44.341     5.713       12.9                 II C
             4754.947754                      12                    Canada               59               79.411       5.96        7.5                 II C
             4507.356445                      13                    Belgium              76                55.559      9.08       16.3                 II C
             4379.727051                      14                    France               75               180.051    28.242       15.7                 II C
             4205.742676                      15                    Finland              41                  6.38      300         4.7                 II B
             4168.986328                      16                     Japan               40                16.305      749         4.6                 II B
             4040.786621                      17                    Andorra              56                  761        51         6.7                 II C
             3937.221924                      18                 New Zealand             13                 1.499       21         1.4                 II A
             3858.674316                      19                United Kingdom           73               247.709    34.876       14.1                 II C
As shown in Table 1, in groups I and II - from 19 countries – pared to countries with health expenditures per capita less
where the highest health expenditures per capita, a high level 200$, Ukraine (177$), Moldova (191). Russian Federation’s
of fatality was registered in most of them- 7 countries - 41,2% health expenditures per capita consisted of a few more of 585 $
(IC index), the lowest was in the group of countries - 4 coun- (61st place in the range of health expenditures per capita of 139
tries only- with low fatality rates (figure1). countries). Fortunately, the Russian Federation and Ukraine,
both, showed an index IIIA – low COVID-19 fatality rate.
Figure 1. Distribution of countries with a high and an average
level of health expenditures per capita by COVID-19 fatality rate Finally, among countries with a low level of health expen-
ditures per capita the smallest share corresponded to the
countries with a high COVID-19 fatality rate – less than 20%
(22 countries). Assessment of the volume of expenditures
of these 22 countries showed: 2 of them (9%) have health
expenditures per capita higher 2000$ (Italy and Spain), 4
of them (18%) – from 1000$ to 2000$, and 4 countries had
health expenditures per capita less 200 $.
AVFT Archivos Venezolanos de Farmacología y Terapéutica
Conclusion
At the time of this study, the priority goals of the WHO in the
Among the counties with a higher level of health expenditures
fight against COVID-19 were:
per capita (group I) such as the US, Switzerland, and Norway,
Volumen 39, número 5, 2020
the first two had Consolidated “expenditure- fatality” index IB • Limit human-to-human transmission including reducing sec-
and only Norway in the third place of the group I had had ondary infections among close contacts and health care
Index IA. Significant meaning is the absence of high fatality workers, preventing transmission amplification events, and
in the group. preventing further international spread from China. This can
be achieved through a combination of public health mea-
Countries with average health expenditure per capita (group
sures, such as rapid identification, diagnosis and manage-
II) and low case-fatality (index – II_A) from COVID-19 were
ment of the cases, identification and follow up of the con-
3 countries: Luxembourg, Australia, and New Zealand. It
tacts, infection prevention and control in health care settings,
should be noted; New Zealand presented a rank of 17th - the
implementation of health measures for travelers, awareness-
penultimate place - in group II by health expenditure. Among
raising in the population and risk communication;
the average level of health expenditures countries, there
were 8 (50% of the II group) with II C index that is, those • Identify, isolate and care for patients early, including provid-
that are characterized by the highest COVID-19 fatality level: ing optimized care for infected patients;
Andorra, Belgium, Canada, France, Ireland, Netherlands,
Sweden, and United Kingdom. • Identify and reduce transmission from the animal source;
The most numerous group (III group) includes 120 countries • Address crucial unknowns regarding clinical severity, the
extent of transmission and infection, treatment options, and 547
with health expenditures per capita less than 3428.3 $. The
structural analyses by fatality cases are shown in figure 2. accelerate the development of diagnostics, therapeutics,
and vaccines;
Figure 2. Distribution of countries with a low level of health • Communicate critical risk and event information to all com-
expenditures per capita by COVID-19 fatality rate munities and counter misinformation;
• Minimize social and economic impact through multisectoral
partnerships13.
The results of our comparative study of health expenditures
to COVID-19 case-fatality indicate the absence of a direct
correlation between the volume of health expenditure of the
country and the COVID-19 fatality index.
This study should take into consideration the time of study
– relatively short term of COVID-19 pandemic and different
periods of epidemic duration in different countries; the differ-
The half, 60 countries of the group, have been assigned index
ent magnitude of testing against COVID-19 by countries; the
III A – the lowest COVID-19 fatality rate. Thus, Qatar has the
different levels of transparency and completeness of data by
lowest Case-Fatality index – 0% (15 deaths of 33 969 con-
countries.
firmed cases). It is fair to say - health expenditures per capita
in Qatar were almost 1650 $ (2017), which is adequate com-
www.revistaavft.comReferences mortality_rates_and_pandemic_ risk_ assessment.html
1. The 2019 Novel Coronavirus Disease (COVID-19) 17. Liu, T., Hu, J., Kang, M., Lin, L., Zhong, H., Xiao, J., et al. Transmission
Pandemic: A Review of the Current Evidence dynamics of 2019 novel coronavirus (2019-nCoV), https://www.bior-
Indian J Med Res. 2020 Feb & Mar;151 (2 & 3):147- xiv.org/content/10.1101/2020.01. 25.919787v1.full.pdf
159. doi:10.4103/ijmr.IJMR_519_20. https://pubmed.ncbi.nlm.nih.
gov/32362642/?duplicate_of=32242874 18. Backer, J., Klinkenberg, D., Wallinga, J., Incubation period of 2019
novel coronavirus (2019-nCov) infections among travelers from
2. Lu, R., Zhao X., Li J., Niu P., Yang, B., Wu, H., et al. Genomic Wuhan, China, 20-28 January. Eurosurveillance 25(5), 2020
characterization and epidemiology of 2019 novel coronavirus: im-
plications for virus origins and receptor binding. Lancet (London, 19. Guan, W.J., Ni, Z.Y., Hu, Y., Liang, W.H., Ou, C.Q., He, J.X., et al.
England) 2020;395(10224):565–74. Clinical characteristics of 2019 novel coronavirus infection in China.
https://www.medrxiv.org/content/10.1101/2020.02 .06.20020974v1.
3. Zhang, L., Shen, F.M., Chen, F., Lin, Z. Origin and evolution of the full.pdf
2019 novel coronavirus. Clinical infectious diseases: an official publi-
cation of the Infectious Diseases Society of America. 2020. 20. Lauer, S., Grantz, K., Bi, Q., Jones, F., Zheng, Q., Meredith, H., et
al. The incubation period of 2019-nCoV from publicly reported confir-
4. Ryu, S., Gao, H., Wong, J., Shiu, E., Xiao, J., Fong, M., and med cases: estimation and application. https://www.medrxiv.org/con
Cowling, B., Nonpharmaceutical Measures for Pandemic Influenza tent/10.1101/2020.02.02.20020016v1.full.pdf
in Nonhealthcare Settings—International Travel-Related Measures,
EID, Volume 6, number 5 – May 2020 21. You, C., Deng, Y., Hu, W., Sun, J., Lin, Q., Zhou, F., et al. Estimation
of the Time-Varying Reproduction Number of 2019-nCoV Outbreak
5. Kolifarhood, G., Aghaali, M., Mozafar, H. et all. Arch Acad Emerg in China, https://www.medrxiv.org/content/ 10.1101/2020.
Med. 2020; 8(1): Published online 2020 Apr 1. Epidemiological and 02.08.20021253v1
Clinical Aspects of COVID-19; a Narrative Review.
22. Chinazzi, M., Davis, J., Ajelli, M., Gioannini, C., Litvinova, M., Merler,
6. Coronavirus disease 2019 (COVID-19) Situation Report – S., et al. The effect of travel restrictions on the spread of the 2019
30. 2020. Available at:https://www.who.int/docs/default-source/ novel coronavirus (2019-nCoV) outbreak; https://www.medrxiv.org/
coronaviruse/situation-reports/20200219-sitrep-30-covid-19. content/10.1101/2020.02.09.20021261v1.full.pdf
pdf?sfvrsn=3346b04f_2.
23. Tian, H., Li, Y., Liu, Y., Kraemer, M., Chen, B., Cai, J., Li, B., Early
7. Guidance on regulations for the transport of infectious substances evaluation of Wuhan City travel restrictions in response to the 2019
2019–2020. Geneva: World Health Organization; 2019. (https://www. novel coronavirus outbreak https://www.medrxiv.org/content/10.1101
who.int/ihr/publications/WH O-WHE-CPI-2019.20/en/). /2020.01.30.20019844v3 accessed 19 February 2020.
8. Li, Q., Guan, X., Wu, P., Wang, X,, Zhou, L., Tong, Y., et al. Early 24. Jung, S., Akhmetzhanov, A., Hayashi, K., Linton, N., Yang, Y., Yuan,
Transmission Dynamics in Wuhan, China, of Novel Coronavirus– B., et al. Real-Time Estimation of the Risk of Death from Novel
Infected Pneumonia, NEJM January 29, 2020 Coronavirus (COVID-19) Infection: Inference Using Exported Cases,
J. Clin. Med. 2020, 9(2), 523
9. Yang, Y., Lu, Q.B., Liu, M.J., Wang, Y.X., Zhang, A.R., Jalali, N., et al.
Epidemiological and clinical features of the 2019 novel coronavirus 25. Dorigatti, I., Okell, L., Cori, A., Imai, N., Baguelin, M., Bhatia, S., et al.
outbreak in China. https://www.medrxiv.org/content/10.1101/2020.02 Report 4: Severity of 2019-novel coronavirus (nCoV), https://www.
.10.20021675v1.full.pdf imperial.ac.uk/mrc-globalinfectious-disease-analysis/news--wuhan-
coronavirus/
10. WHO: People living longer and healthier lives but COVID-19
threatens to throw progress off track. https://www.who.int/news- 26. The economic effects of COVID-19 around the world 17 Feb 2020
548 room/detail/13-05-2020-people-living-longer-and-healthier-lives-but- Rosamond Hutt. https://www.weforum.org/https://www.weforum.org/
covid-19-threatens-to-throw-progress-off-track agenda/2020/02/coronavirus-economic -effects-global-economy-
trade-travel
11. WHO’s country and technical guidance on COVID-19. https://www.
who.int/emergencies/diseases/novel-coronavirus-2019/technical- 27. The Global Health Expenditure Database (GHED). apps.who.int/
guidance/laboratory-guidance nha/database
12. Hopkins, Johns COVID-19 Testing Insights Initiative https://coronavi- 28. Mortality analyses, John Hopkins University and Medicine. https://
rus.jhu.edu/testing coronavirus.jhu.edu/data/mortality
13. COVID-19 Diagnosis and Management: A Comprehensive Review 29. Shi, X., Gong, E., Gao, D., et al. Severe acute respiratory syndrome
J Intern Med. 2020 Apr 29. doi: 10.1111/joim.13091. https://pubmed. associated coronavirus is detected in intestinal tissues of fatal cases.
ncbi.nlm.nih.gov/32348588/ Am J Gastroenterol. 2005;100 (1):169–176.
14. Kelly-Cirino, C., Mazzola, L.T., Chua, A., Oxenford, C.J., Van 30. Zhou, J., Li, C., Zhao, G., et al. Human intestinal tract serves as an
Kerkhove, M.D., An updated roadmap for MERS-CoV research and alternative infection route for Middle East respiratory syndrome coro-
product development: focus on diagnostics. BMJ global health. 2019 navirus. Sci Adv. 2017;3(11).
15. Linton, N. et al, Epidemiological characteristics of novel coronavirus 31. Ding, Y., He, L., Zhang, Q., et al. Organ distribution of severe acute
infection: A statistical analysis of publicly available case data, https:// respiratory syndrome (SARS) associated coronavirus (SARS-CoV)
www.medrxiv.org/content/10.1101 /2020.01.26.20018754v1 in SARS patients: implications for pathogenesis and virus transmis-
sion pathways. J, Pathol. 2004;203(2):622–630.
16. Famulare, M., 2019-nCoV: preliminary estimates of the confirmed-
case-fatality-ratio and infection-fatality-ratio, and initial pandemic risk 32. Infection prevention and control during health care when novel co-
assessment, https://institutefordiseasemodeling. github.io/nCoV- ronavirus (nCoV) infection is suspected, interim guidance, January
public/analyses/first_adjusted_ mortality_ estimates_ and_risk_ 2020. Geneva: World Health Organization; 2020. (https://www.
assessment/2019-nCoVpreliminary _age_and_ time_ adjusted_ who.int/publicationsdetail/infection-prevention-and-controlduring-health-care-when-novelcoronavirus-(ncov)-infection-is-suspected-
20200125).
33. Laboratory biosafety guidance related to the novel coronavirus
(2019-nCoV), World Health Organization; 2020 (https://www.who.int/
docs/defaultsource/coronaviruse/ laboratory-biosafetynovel-corona-
virus-version-1-1.pdf?sfvrsn=912a9847_2)
34. Tsiring, D. A., Evstafeeva, E. A., Ponomareva, I. V., & Sizova, Y.
N. (2019). Subject and personal particularities of women having
various stages of breast cancer. Electronic Journal of General
Medicine, 16(6).
35. Sharquie, K. E., & Al-Jaralla, F. A. (2019). Cupping (Hijama) in
Skin diseases with positive Koebner’s Phenomenon: What is
New?. Journal of Clinical and Experimental Investigations, 10(3),
em00726.
36. Guilford, J. P., & Dingman, H. F. (1955). A modification of the method
AVFT Archivos Venezolanos de Farmacología y Terapéutica
of equal-appearing intervals. The American journal of psychology,
68(3), 450-454.
Volumen 39, número 5, 2020
www.revhipertension.com
www.revdiabetes.com
www.revsindrome.com
www.revistaavft.com
549
Indices y Bases de Datos:
OPEN JOURNAL SYSTEMS
REDALYC (Red de Revistas Científicas de América Latina, el Caribe, España y Portugal)
SCOPUS de Excerpta Medica
GOOGLE SCHOLAR
Scielo
BIREME (Centro Latinoamericano y del Caribe de Información en Ciencias de la Salud)
LATINDEX (Sistema Regional de Información en Línea para Revistas Científicas de América Latina, el Caribe, España y Portugal)
Índice de Revistas Latinoamericanas en Ciencias (Universidad Nacional Autónoma de México)
LIVECS (Literatura Venezolana de Ciencias de la Salud)
LILACS (Literatura Latinoamericana y del Caribe en Ciencias de la Salud)
PERIÓDICA (Índices de Revistas Latinoamericanas en Ciencias)
REVENCYT (Índice y Biblioteca Electrónica de Revistas Venezolanas de Ciencias y Tecnología)
SABER - UCV
EBSCO Publishing
PROQUEST
www.revistaavft.comYou can also read