Co incorporation of manure and inorganic fertilizer improves leaf physiological traits, rice production and soil functionality in a paddy field
←
→
Page content transcription
If your browser does not render page correctly, please read the page content below
www.nature.com/scientificreports
OPEN Co‑incorporation of manure
and inorganic fertilizer improves
leaf physiological traits, rice
production and soil functionality
in a paddy field
Anas Iqbal1,2,4, Liang He2, Izhar Ali2, Saif Ullah2, Aziz Khan2, Kashif Akhtar3, Shangqin Wei2,
Shah Fahad4, Rayyan Khan5 & Ligeng Jiang1,2*
The combined use of organic manure and chemical fertilizer (CF) is considered to be a good method
for sustaining high crop yields and improving soil quality. We performed a field experiment in 2019 at
the research station of Guanxi University, to investigate the effects of cattle manure (CM) and poultry
manure (PM) combined with CF on soil physical and biochemical properties, rice dry matter (DM) and
nitrogen (N) accumulation and grain yield. We also evaluated differences in pre-and post-anthesis DM
and N accumulation and their contributions to grain yield. The experiment consisted of six treatments:
no N fertilizer (T1), 100% CF (T2), 60% CM + 40% CF (T3), 30% CM + 70% CF (T4), 60% PM + 40% CF (T5),
and 30% PM + 70% CF (T6). All CF and organic manure treatments provided a total N of 150 kg ha−1.
Results showed that the treatment T6 increased leaf net photosynthetic rate (Pn) by 11% and 13%,
chlorophyll content by 13% and 15%, total biomass by 9% and 11% and grain yield by 11% and 17%
in the early and late season, respectively, compared with T2. Similarly, the integrated manure and CF
treatments improved post-antheis DM accumulation and soil properties, such as bulk density, organic
carbon, total N, microbial biomass carbon (MBC) and microbial biomass nitrogen (MBN) relative to
the CF-only treatments. Interestingly, increases in post-anthesis DM and N accumulation were further
supported by enhanced leaf Pn and activity of N-metabolizing enzyme during the grain-filling period.
Improvement in Pn and N-metabolizing enzyme activity were due to mainly improved soil quality
in the combined manure and synthetic fertilizer treatments. Redundancy analysis (RDA) showed a
strong relationship between grain yield and soil properties, and a stronger relationship was noted
with soil MBC and MBN. Conclusively, a combination of 30% N from PM or CM with 70% N from CF is a
promising option for improving soil quality and rice yield.
Abbreviations
N Nitrogen
CF Chemical fertilizer
OM Organic manure
CM Cattle manure
PM Poultry manure
NR Nitrate reducates
GS Glutamine synthetase
GOGAT Glutamate oxoglutarate aminotransferase
SOC Soil organic carbon
TN Total nitrogen
1
College of Life Science and Technology, Guangxi University, Nanning 530004, China. 2Key Laboratory of Crop
Cultivation and Farming Systems College of Agriculture, Guangxi University, Nanning 530004, China. 3Institute of
Nuclear Agricultural Sciences, College of Agriculture and Biotechnology, Zhejiang University, Hangzhou 310058,
China. 4Department of Agronomy, The University of Haripur, Khyber Pakhtunkhwa, Pakistan. 5Tobacco Research
Institute, Chinese Academy of Agricultural Science, Qingdao 266101, China. *email: jiang@gxu.edu.cn
Scientific Reports | (2021) 11:10048 | https://doi.org/10.1038/s41598-021-89246-9 1
Vol.:(0123456789)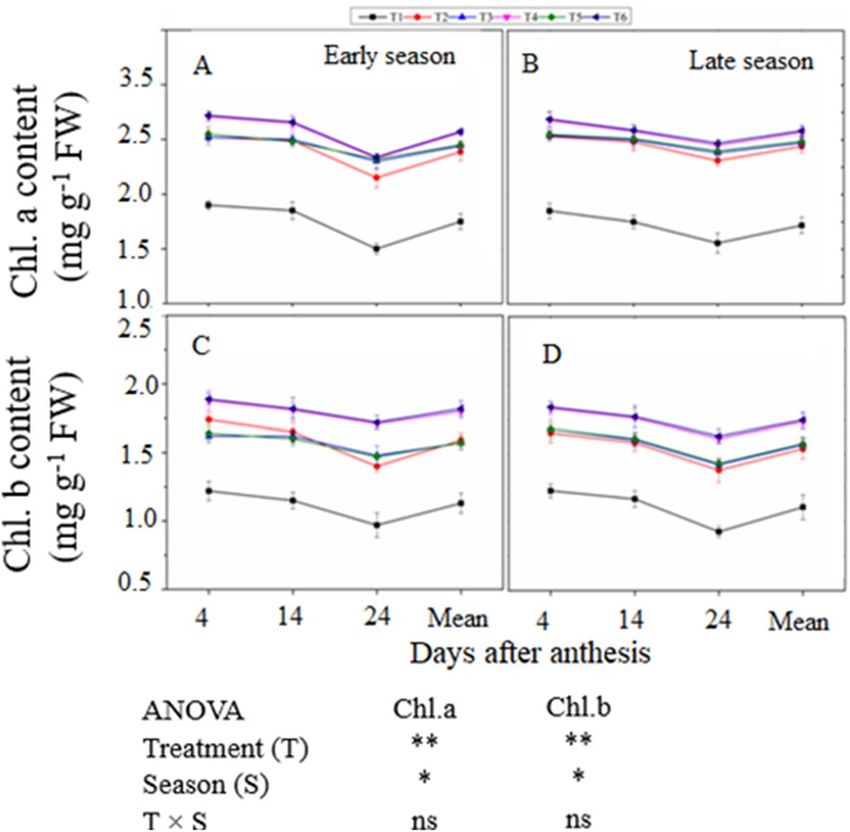
www.nature.com/scientificreports/
BD Bulk density
DM Dry matter
DMT Dry matter translocation
NT Nitrogen translocation
Pn Photosynthetic rate
DAA Days after anthesis
Chl.a Chlorophyll a
Chl.b Chlorophyll b
MBC Microbial biomass carbon
MBN Microbial biomass nitrogen
Rice (Oryza sativa L.) is the main staple food eaten by half of the world’s inhabitants and almost 60% of the
Chinese population1,2. China is the leading globle producer and consumer of rice1. Nitrogen (N) is essential for
plant growth, and its application influences crop yield by establishing and maintaining photosynthetic and sink
capacities3,4. The current farming system is heavily reliant on synthetic N fertilizers to achieve higher yields.
However, crop yield does not necessarily increase linearly with N fertilizer input5,6. Excessive N application causes
significant environmental problems, such as increased greenhouse gas emission, groundwater contamination,
and surface water e utrophication7,8. Long-term use of chemical N fertilizer has also caused the acidification,
degradation, and compaction of arable soils, thereby suppressing plant growth and p roductivity9,10. Moreover,
the extreme use of N and phosphorus fertilizers also reduces the soil microbial population and increases soil
acidity11,12. Therefore, the continued reliance on synthetic N fertilizer for cereal crop production is not sustain-
able. Proper management practices are needed to improve N use efficiency, and reduce the harmful effects of
CFs on soil health, and ensure sustainable rice production.
Organic manure derived from animal waste holds great promise, for maintaining soil health and fertility,
protecting soil biodiversity, and improving crop production; organic fertilizers have a clear advantage over CFs in
many aspects13–15. Organic fertilizer has greater organic matter and richer nutrient contents; it improves soil phys-
icochemical and biological properties primarily by enhancing soil structure and reducing soil bulk d ensity16–18.
The slow and steady N release from organic fertilizers is a benefit to sole CF application in achieving higher N
use efficiency , crop yield, and grain quality19,20,21. However, organic manure is relatively low in nutrient content,
and its release rate is generally too slow to meet plant requirements in a short time period. Thus, the combined
application of organic manure and CF has proven to be a promising option in improving and maintaining soil
fertility and crop production than the use of either amendments or alone20,22. Although the advantages of organic
manure fertilization are generally recognized, its optimal application ratio with CF remains unclear.
Plant leaves play two major roles, particularly during the grain filling period of cereal crops: they are the pri-
mary photosynthetic organs necessary for the production of DM, and they are the main source of grain fi lling23.
Delayed leaf senescence promotes relatively high photosynthetic rates and is desirable for producing the highest
cereal yield that can be synchronized with sufficient soil N availability during the grain-filling period24,25. Geng
et al.26 reported that organic manure application improved leaf photosynthetic capacity and chlorophyll content
during the reproductive period because of the slow and steady release of mineral nutrients from manure dur-
ing the entire growing season, particularly during the grain-filling period. Nitrogen is taken up and assimilated
through N-metabolizing enzymatic pathways, that include nitrate reductase (NR), glutamine synthetase (GS), and
glutamate oxoglutarate aminotransferase (GOGAT)27. Maintenance of N recovery by N metabolizing enzymes
not only enhances the plant’s photosynthetic ability but also prolongs the stay-green period leaves28,29.
Crops grain yield derives from two sources, the translocation of plant DM accumulated pre-anthesis and post-
anthesis DM production30. Previous research has demonstrated the value of pre-anthesis plant DM accumulation
and translocation, which can contribute to higher grain y ields30. Furthermore, it was shown that 69% of straw
N and 84% of non-structural carbohydrates accrued pre-anthesis could be translocated to the grains, although
this depends on the sowing conditions and cultivar31. Post-anthesis DM production may be a good contribu-
tor to cereal grain yield, according to recent evidence32,33. However, due to a lack of information, further study
into the relationship between post-anthesis DM production and grain yield is required. In the present study, we
hypothesized that the combined use of organic and inorganic fertilizers would improve soil physiochemical and
biochemical properties, which would in turn increase plant nutrient uptake and accumulation. We also predicted
that the slow and steady release of mineral nutrients from organic fertilizers during the entire plant growth
period would improve leaf physiological activity, post-anthesis DM, and N accumulation, thereby increasing
grain yield. The objectives of the study were: (1) to determine the effects of organic and inorganic N fertilizer
combinations on soil physical and biochemical properties; (2) to assess the effect of integrated fertilization on
rice leaf physiology, biomass and grain yield; and (3) to evaluate the difference in pre-and post-anthesis N and
DM accumulation and its relationship to rice grain yield.
Results
Soil properties. The combined application of organic and inorganic fertilizer and the different seasons had
significant effects on soil physical and chemical properties such as bulk density (BD), pH, soil organic carbon
(SOC), total nitrogen (TN), available nitrogen (AN), available potassium (AK), and availible phosphorus (AP)
up to 20 cm (Table 1). The treatments showed the same behavior across both seasons. In the CF-only treat-
ment (T2), soil pH (5.92 and 5.90), SOC (14.86 and 14.66 g kg−1), TN (1.45 and 1.43 g kg−1), AN (138.5 and
137.5 mg kg−1), AP (23.5 and 24.5 mg kg−1) and AK (226.5 and 231.2 mg kg−1) were recorded in the early and
late seasons, respectively. Compared with T 2, the combined treatment T
3 increased soil pH by (4.5% and 7.2%),
SOC (13% and 19%), TN (14% and 25%), AN (11% and 18%), AP (14% and 22%), and AK (22% and 33%) dur-
Scientific Reports | (2021) 11:10048 | https://doi.org/10.1038/s41598-021-89246-9 2
Vol:.(1234567890)
www.nature.com/scientificreports/
BD pH SOC SOM TN AN AP AK
Treatment (g cm-3) (water) (g kg−1) (g kg−1) (g kg−1) (mg kg-1) (mg kg−1) (mg kg−1)
Early season
132.82 ± 6.55 225.22 ± 10.55
T1 1.36 ± 0.01 a 5.97 ± 0.32 c 13.53 ± 0.85 d 25.0 ± 2.05 d 1.40 ± 0.08 c 23.23 ± 1.54c
d c
138.53 ± 8.05 226.54 ± 12.36
T2 1.36 ± 0.02 a 5.95 ± 0.24 c 14.10 ± 1.01 d 25.01 ± 1.52 d 1.41 ± 0.03 c 23.54 ± 2.00 c
c c
154.38 ± 10.11 276.53 ± 11.50
T3 1.24 ± 0.02 c 6.10 ± 0.34 a 16.81 ± 0.44 a 29.20 ± 0.85 a 1.63 ± 0.02 a 26.59 ± 1.05 a
a a
148.87 ± 9.44 266.80 ± 15.50
T4 1.29 ± 0.04 b 6.00 ± 0.50 b 15.41 ± 0.81 b 28.15 ± 1.58 c 1.54 ± 0.07 b 24.81 ± 2.15 b
b b
155.40 ± 5.05
T5 1.25 ± 0.01 c 6.11 ± 0.30 a 16.69 ± 1.44 a 28.60 ± 2.87 a 1.65 ± 0.10 a 26.87 ± 1.22 a 274.28 ± 7.55 a
a
149.60 ± 8.57
T6 1.30 ± 0.06 b 6.03 ± 0.41 b 15.01 ± 0.28 c 26.42 ± 1.81 c 1.52 ± 0.04 b 24.59 ± 1.88 b 265.60 ± 9.33 b
b
Average 1.30 a 6.02 b 14.80 b 27.17 b 1.53 b 146.60 b 24.94 b 255.83 b
Late season
133.14 ± 12.01 226.42 ± 15.57
T1 1.36 ± 0.04 a 5.96 ± 0.21 c 13.44 ± 1.08 d 24.85 ± 1.74 d 1.39 ± 0.02d 24.28 ± 3.01 c
d d
137.55 ± 5.25
T2 1.35 ± 0.03 a 5.90 ± 0.12 d 14.66 ± 0.35 c 25.22 ± 2.35 c 1.43 ± 0.05 c 24.80 ± 2.43 c 231.21 ± 8.88 c
c
167.79 ± 6.78 308.24 ± 10.76
T3 1.17 ± 0.01d 6.28 ± 0.62 a 17.68 ± 0.42 a 29.10 ± 1.85 a 1.83 ± 0.04 a 30.31 ± 2.55 a
a a
156.56 ± 11.05
T4 1.21 ± 0.05 b 6.19 ± 0.40 b 16.21 ± 0.85 b 28.74 ± 0.95 b 1.71 ± 0.03 b 27.78 ± 1.42 b 286.52 ± 6.55 b
b
168.80 ± 10.56 303.25 ± 16.20
T5 1.20 ± 0.07 c 6.26 ± 0.84 a 17.56 ± 0.70 a 31.92 ± 3.05 a 1.81 ± 0.02 a 28.45 ± 2.77 a
a a
158.25 ± 5.33
T6 1.23 ± 0.02b 6.18 ± 0.33 b 16.31 ± 1.22 b 28.62 ± 2.11 b 1.72 ± 0.04 b 30.54 ± 3.11 b 284.52 ± 9.30 b
b
Average 1.25 b 6.12 a 15.98 a 28.08 a 1.65 a 162.68 a 27.69 a 273.36 a
ANOVA
Treatment (T) ** * ** ** ** * * *
Season (S) * * * * * * * *
T×S ns ns ns ns ns ns ns ns
Table 1. Changes in soil physical and checmial properties under the combined organic and inorganic N
fertilization. Note: T1, no N fertilizer, T2 100% CF, T3 60% CM + 40% CF, T4 30% CM + 70% CF, T5 60%
PM + 40% CF, T6 30% PM + 70% CF, BD bulk density, SOC soil organic carbon, SOM soil organic matter,
TN total nitrogen, AP available phosphorous, AK available potassium. Values followed by the same letters,
within column, are not significantly different at p ≤ 0.05. Mean values (n = 3) ± SE. ns: non significant, *p < 0.05,
**p < 0.05.
ing the early and late seasons, respectively. Treatment T
3 also considerably reduced the soil BD relative to T 2 by
6% in the early season and 9% in the late season. Soil pH, SOC, TN, AN, AP, and AK in T 3 increased by 60%,
46%, 78%, 63%, 57%, and 50%, respectively, in the late season compared with the early season. Soil properties in
the treatment T5 did not differ significantly from those in T3. Moreover, treatments T
4 and T6 also significantly
improved soil physical and chemical properties relative to T2 Lower values for soil parameters were noted in the
non N-treated plots.
Microbial biomass C and N. Soil MBC and MBN differed significantly among treatments in both seasons,
as shown in Fig. 1. The integrated use of organic manure and CF significantly enhanced soil MBC and MBN in
both seasons compared with CF-only fertilization. In the both seasons, the treatments showed the same trend.
Compared with CF-only ( T2), the T3 treatment improved soil MBC by (14% and 26%) and MBN (11% and 19%)
in the early and late seasons, respectively. Relative to the early season, MBC and MBN in treatment T3 increased
by 85% and 72%, respectively, in the late seasons. However, MBC and MBN did not differ significantly between
T3 and T5. The treatments T4 and T6 also significantly improved soil microbial C and N compared with CF-only
fertilization and non N-treated plots.
Net photosynthetic efficiency and chlorophyll content of the flag leaf. The combination of
manure and chemical N fertilizer significantly improved Pn, chlorophyll a (Chl a), and chlorophyll b (Chl b)
content during the grain filling period in both seasons compared with the CF-only application (Figs. 2, 3). Leaf
Pn, Chl a, and Chl b declined with increasing days after anthesis (DAA). The treatments exhibited the same
trend in both seasons. Averaged across DAA, T6 treatment increased Pn by 11% and 13%, Chl a by 12% and
14%, and Chl b by 14% and 16% in the early and late seasons, respectively, compared with T2. However, T 4 was
Scientific Reports | (2021) 11:10048 | https://doi.org/10.1038/s41598-021-89246-9 3
Vol.:(0123456789)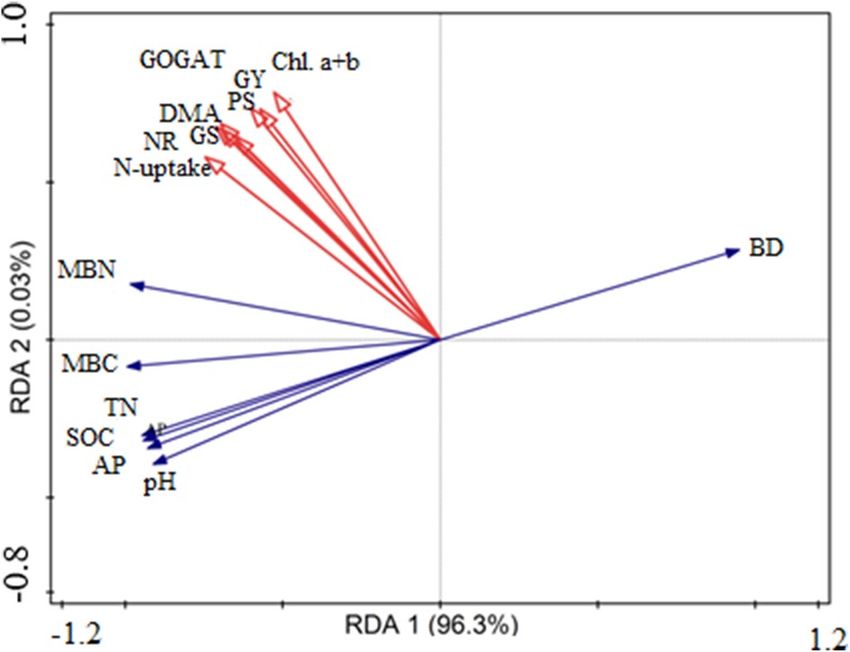
www.nature.com/scientificreports/
Figure 1. Changes in soil microbial biomass C (SMBC) in the early and late season (A) and N (SMBN) during
early and late (B) under combined organic and inorganic N fertilization. ns: non significant, *p < 0.05, **p < 0.05.
For treatment details please see Table 1.
noted statistically (P < 0.05) non-significant with T6. Similarly, the combined treatments T3 and T5 enhanced leaf
Pn and Chl content compared with non N-treated plots, but did not differ significantly from T2 in either season.
Activity of N‑metabolizing enzymes. The activity of N-metabolizing enzymes such as NR, GS, and
GOGAT during the grain filling period were significantly affected by the combined application of manure
and chemical fertilizer and different seasons (Fig. 4). Higher activity of N-metabolizing enzymes was noted in
N-treated plants, wheareas lower activity was observed in non N-treated plants during both seasons (Fig. 4A–F).
N-metabolizing enzyme activity showed the same behavior in both seasons. NR activity decreased durig the the
grain filling period; it reached a maximum at 4 DAA, then slowly decreased and was lowest at 24 DAA (Fig. 4A,
B). Averaged across DAA, the NR activity of T 6 was 10% and 14% higher than that of T 2 in the early and late
seasons, respectively. NR activity did not differ significantly among T 4 and T
6. Similarly, T3 and T 5 also improved
NR activity, and the lowest values were observed in nonN-treated plots.
By contrast, GS and GOGAT activities first increased and then decreased during the grain filling period;
highest at 14 DAA and lowest at 24 DAA (Fig. 4C–F). Across the grain filling period, GS activity was (13% and
17%) and GOGAT was (11% and 16%) higher in T6 than in T2 in the early and late seasons, respectively. However,
no significant differences were observed among T4 and T 6. The combined fertilization treatments T3 and T 5 had
significantly higher values of GS and GOGAT activity than the non N-treated plots.
Accumulation and translocation of DM and N. Dry matter and N accumulation reflect plant growth
and metabolic capacity and ultimately control the economic yield. In the present study, the accumulation of
DM and N increased progressively with plant growth and attained maximum values at plant maturity. DM and
N accumulation differed significantly among fertilizer treatments and seasons, as shown in Table 2. DM accu-
mulation was 9% and 11% higher in T 6 than in T
2 at maturity in the early and late seasons, respectively, and N
accumulation was 10% and 12% higher in T6. DM and N accumulation in T6 were 22% and 20% higher in the
late season than in the early season. DM and N did not differ significantly between T4 and T6. The combined
treatments T3 and T5 also improved DM and N accumulation but did not differ significantly from T2. The lowest
values of DM and N accumulation were observed in non-N treated plots in both seasons.
The combination treatments also showed the highest translocation rates of DM and N accumulated pre-
anthesis (Table 5). Relative to non-N-treated plots, the combination treatments improved DM and N transloca-
tion significantly in both seasons.
Post‑anthesis DM and N accumulation. The combination of manure and synthetic fertilizer signifi-
cantly improved post-anthesis DM and N accumulation (Table 2). Post-anthesis DM accumulation in the CF-
only treatment (T2) was 482 and 436 (g m−2) in the early and late seasons, respectively, and post-anthesis N
accumulation in T2 was 4.18 and 4.06 (g m−2). Post-anthesis DM accumulation was 9% and 14% higher in the
T6 combination treatment than in T 2 in the early and late seasons, respectively, and post-anthesis N accumula-
tion was 10% and 13% higher. T4 did not differ significantly from T 6 in post-anthesis DM and N accumulation.
Treatments T3 and T5 also improved post-anthesis DM and N accumulation, and the lowest post-anthesis values
were observed in non-N-treated plots.
Rice yield and yield components. Rice grain yield and yield attributes were significantly improved by
the combination of organic manure and inorganic N fertilization (Table 3). However, there was no significant
difference effects of different season on grain yield and yield components, with the exception of panicles number
and 1000 grain weight. The T 6 treatment produced significantly higher panicle number (11% and 14%), grain
filling percentage (5% and 7%), 1000-grain weight (6% and 9%), and grain yield (11% and 17%) compared with
T2 in the early and late seasons, respectively. These parameters did not differ significantly between T
4 and T
6. The
Scientific Reports | (2021) 11:10048 | https://doi.org/10.1038/s41598-021-89246-9 4
Vol:.(1234567890)www.nature.com/scientificreports/
Figure 2. Changes in leaf net photosynthesis rate at (4, 14, and 24 DAA) during grain filling period both
early (A) and late season (B) under the combined organic and inorganic N fertilization. Vertical bars represent
the standard error of mean. Different letters above the column indicate significance at the (P < 0.05). ns: non
significant, *p < 0.05, **p < 0.05. For treatment details please see Table 1.
T3 and T
5 combination treatments also had higher yields and yield components than non-N-treated plots. The
lowest yield and yield components were observed in non-N-treated plots.
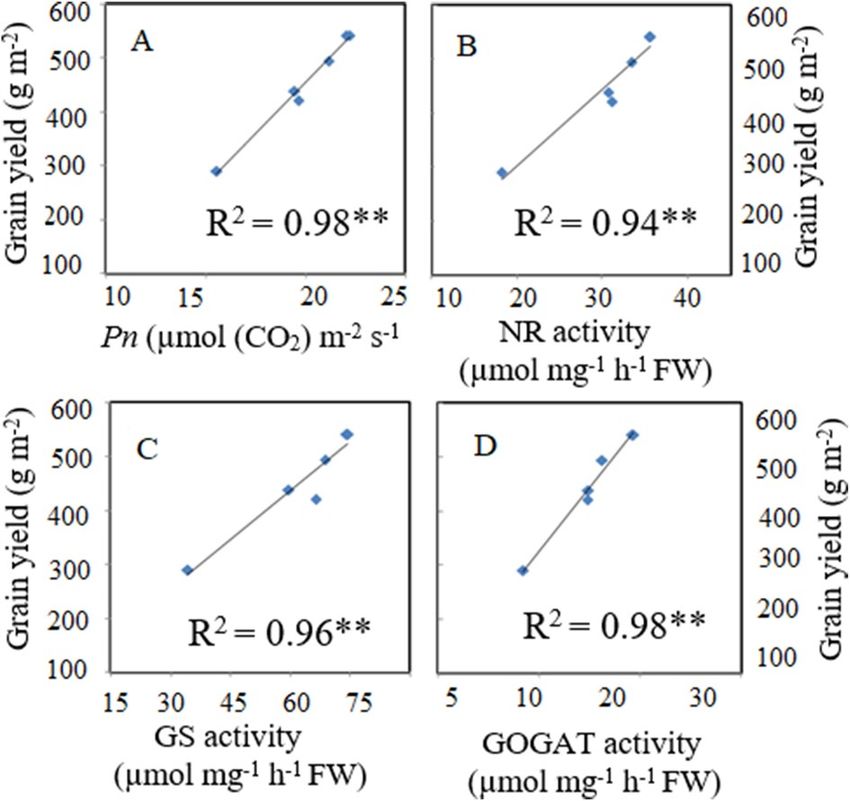
Relationships between leaf physiological traits and grain yield. Changes in leaf physiological
traits significantly affect the grain yield of rice. In the present study, linear regression analysis revealed highly
significant and strong relationships between leaf physiological attributes and grain yield, as shown in Fig. 5. Flag
leaf Pn (R2 = 0.98**, Fig. 5A), and the activities of the N-metabolizing enzymes NR (R2 = 0.94**, Fig. 5B), GS
(R2 = 0.96**, Fig. 5C), and GOGAT (R2 = 0.98**, Fig. 5D) were strongly positively associated with grain yield.
Therefore, higher leaf physiological activity during the grain filling period contributed significantly to rice grain
yield.
Relationships of pre‑ and post‑anthesis DM and N accumulation with grain yield. The grain
yield of cereal crops highly dependent on pre- and post-anthesis accumulation of DM and N. In the current
study, linear regression analysis showed strong positive relationships of post-anthesis DM (DMA, R2 = 0.81**,
Fig. 6A) and N accumulation (NA, R 2 = 0.73**, Fig. 6C) with grain yield. Moreover, translocation of DM (DMT,
2 2
R = 0.71**, Fig. 6B) and N (NT, R = 0.80**, Fig. 6D) accumulated pre-anthesis were also positively related to
grain yield. Finally, linear regression confirmed that post-anthesis DM accumulation was strongly positively cor-
related with grain yield. Therefore, improvements in post-anthesis DM accumulation contributed significantly
to higher grain yield in rice.
Relationships of soil properties with N‑metabolizing enzyme activities and grain yield. Changes
in above-average plant yields are highly dependent on fluctuations in soil quality and can be helpful in soil
sustainability and stability. In this study, RDA revealed strong positive relationships of N metabolism enzyme
activities and grain yield with soil properties and microbial activity (Fig. 7). Soil properties such as pH, SOC,
TN, AP, MBC, and MBN showed strong correlations with plant biomass accumulation, rice grain yield and N
metabolism enzyme activities, and photosynthetic efficiency during the grain-filling period. However, the corre-
lation of MBN with N metabolism enzyme activity, plant N, and biomass accumulation was significantly higher
under organic manure fertilization, presumably as a result of improved soil fertility.
Discussion
Soil physical and chemical properties were significantly improved by the combination of organic and inorganic
N fertilization compared with the application of urea fertilizer alone (Table 1). The combination treatment also
resulted in lower soil BD. Reductions in soil BD in the combination treatments were due to the bulky nature
of the organic manure, which prevented the soil from separating34. Moreover, the use of organic manures has
been shown to promote soil aeration and enhance soil aggregation, which leads to a decline in soil BD35. Our
outcomes are in consistent with Franzluebbers et al.35, who concluded that variation in SOC not only directly
affects soil BD but also increases soil aggregation and healthy pore growth due to improved soil physicochemical
and biological properties.
Soil chemical properties such as soil pH, SOC, TN, AN, AK, and AP increased significantly with the combined
application of organic and inorganic fertilizers. We noted that the decomposition of organic manure gradually
Scientific Reports | (2021) 11:10048 | https://doi.org/10.1038/s41598-021-89246-9 5
Vol.:(0123456789)www.nature.com/scientificreports/
Figure 3. Leaf chlorophyll content a and b at 4, 14, and 24 days after anthesis during grain filling at early (A,C)
and late (B,D) season in response to combined organic and inorganic N fertilization. Vertical bars represent
the standard error of means. Different letters above the column indicate significance at (P < 0.05). Note:
Chl.a–Chlorophyll a, Chl.b–Chlorophyll b, FW–Fresh leaf weight. ns: non significant, *p < 0.05, **p < 0.05. For
treatment details please see Table 1.
released nutrients into the soil, and increasing the amount of organic fertilizer from 30 to 60% improved soil
chemical properties. The use of CF alone reduced soil pH, whereas the combination treatment increased soil
pH considerably. Chemical N fertilization may have significantly reduced the exchangeable base cations in the
soil, ultimately leading to a decline in soil pH. The use of synthetic N has also been shown to shift soils into the
Al3+ buffering stage36. Another possible explanation for increased soil pH in the combination treatments is that
organic fertilizer contains enough basic cations and carbonate ions to neutralize the acidification e ffect37,38.
Soil C is an important parameter for the evaluation of soil quality and fertility. The substantial improvements
in SOC, TN and AN observed in this study may have resulted from both direct C and N inputs from the organic
manure and indirect C and N inputs associated with greater crop biomass, such as roots and crop r esidues38,39.
Soil organic C at any specific location depends mainly on the seasonal return and recycling of organic materials,
roots, and shoot stubbles40,41. Our results are in agreement with Purakayastha et al.42, who reported that organic
manure integrated with chemical fertilizer increased soil TN by 56–90% and SOC by 11–80% in the upper soil
layer. The application of organic fertilizers may also have increased soil nutrient availability because the manure
absorbed more leachate, improving soil water holding capacity, decreasing nutrient leaching, and ultimately
increasing the availability of N, P, and K in the soil43.
Higher soil available P in the combination treatments is consistent with the results of P addition from chemi-
cal fertilizers, as plants typically use only a portion of the applied P 44. Likewise, organic manure often provides
a large amount of P to the soil and reduces the fixation of added P, resulting in enhanced competition of organic
molecules with P O43− ions for P retention sites in the manure t reatments45. Higher available K in the combination
treatments relative to the urea-only treatment may reflect exudation of organic acids during the decomposition
process, which releases negative ions that have a preference for di- or trivalent cations (e.g., Al3+, Ca2+, and
Mg2+), leaving K+ to be absorbed by negatively charged soil colloids46. This phenomenon can help to minimize
K fixation and improve soil K availability.
Soil MBC and MBN reflect characteristics of the soil microbial community structure47. In the present study,
organic manure in combination with CF significantly enhanced soil MBC and MBN (Fig. 1). Increases in MBC
and MBN may have occurred because organic fertilizer improved the physicochemical and biological proper-
ties of the soil, leading to increased absorption and uptake of mineral N by the crop48,49. In addition, manure
may have facilitated the conversion of mineral N to MBN and other N forms50. Another possible explanation
is that the combination treatments may have improved soil fertility and rice biomass production (Tables 4, 5),
leading to an increase in crop residues. Such residues are beneficial for the propagation of soil microbes and may
therefore facilitate the conversion of C and N 51. Furthermore, the integration of organic fertilizer with synthetic
N is widely accepted as an efficient means of improving soil microbial activity, soil structure, aggregation, and
water retention capacity13,14.
Leaf chlorophyll (Chl) content is widely used to assess plant photosynthetic health52. Chl synthesis and protein
are also associated with leaf N concentration, and higher photosynthetic rates promote stem elongation, enhance
leaf area expansion, and delay leaf s enescence53. Leaf Chl content and Pn are directly related to N uptake54. Pho-
tosynthetic rate responds readily to N and water supply and is the key driver of plant production by enhancing
Scientific Reports | (2021) 11:10048 | https://doi.org/10.1038/s41598-021-89246-9 6
Vol:.(1234567890)www.nature.com/scientificreports/
Figure 4. Changes in N metabolism enzyme activities at 4,1 4, and 24 days after anthesis during grain filling
period, NR,GS and GOGAT at early season (A–C–E) and late season (B–D–F) in response to combined organic
and inorganic N fertilizer application. Vertical bar represents the standard error of mean. Different letters
above the column indicate statistical significance at the (P < 0.05). Note: NR–nitrate reductase, GS–glutamine
synthetase, GOGAT–glutamine oxoglutarate aminotransferase. ns: non significant, *p < 0.05, **p < 0.05. For
treatment details please see Table 1.
growth and biomass55,56. In this work, leaf Pn and Chl content were highest in the integration treatments relative
to the CF-only application during the grain-filling (Figs. 3 and 4). This increase may have been due to the fact
that the combined application of manure and synthetic fertilizer increased soil fertility and quality (Table 4),
decreasing the leaching of mineral elements from the upper soil layer and improving the physical structure of
the soil, thereby increasingplant nutrient a bsorption57. Another possible reason for improvement in Pn and Chl
content during the grain-filling period is the quicker release of nutrients from synthetic fertilizer and accompa-
nied by the slow and steady release of nutrients from organic fertilizer across the entire growth p eriod20. Pn and
Chl a were always highest in T 6 and lowest in T
1 (Figs. 3 and 4). These findings highlight the importance of Chl
a, as it is the primary photosynthetic pigment.
Several key enzymes such as NR, GS, and GOGAT play an important role in plant N assimilation27. In this
study, higher N-metabolizing enzyme activity was observed in response to the combined application of manure
and synthetic fertilizer (Fig. 4). This may have resulted from improved soil quality under the combination treat-
ment (Table 5). Our findings indicated that the combination of organic manure and chemical fertilizer improved
N accumulation in leaves more effectively than the traditional urea-only application, and this was necessary to
provide adequate grain-filling substrate and promote superior grain yield58. Similarly, Gupta et al.59 also reporteda
strong relationship of soil N availibility and N absorption with the activities of key N assimilatory enzymes during
grain filling. Our outcomes are consistent with those of Sun et al.58, who concluded that GS and GOGAT activities
in flag leaves during the grain-filling period were strongly positively associated with grain yield and crop quality.
Delayed leaf senescence supports comparatively high photosynthetic activity and promotes maximum DM
production and grain yield; it may be achieved by synchronizing soil N availability and plant N uptake during the
grain-filling period24,25. In the present study, delayed leaf senescence, high photosynthetic efficacy, and enhanced
N-metabolizing enzyme activity were observed during the grain-filling period in the combination treatments
(Figs. 3 and 4). These treaits improved N uptake and post-anthesis DM accumulation, and ultimately improved
grain yield. This was further supported by the significant and highly positive correlations of grain yield with
Pn (R2 = 0.98**, Fig. 5A), NR (R2 = 0.94**, Fig. 5B),GS (R2 = 0.96**, Fig. 5C) and GOGAT (R2 = 0.98**, Fig. 5D),
indicating that greater Pn and N metabolism activities during grain formation promoted the formation of a
superior sink (as quantified by panicle length and spikelet number), and consequently led to superior rice grain
Scientific Reports | (2021) 11:10048 | https://doi.org/10.1038/s41598-021-89246-9 7
Vol.:(0123456789)www.nature.com/scientificreports/
DMA (g m
−2) NA (g m−2)
Treatment Ant Mat Post-a DMA DMT (g m ) Ant
−2
Mat Post-a NA NT (g m−2)
Early season
T1 648 ± 14.52 d 956 ± 16.02 d 308 ± 14.20 c 214 ± 8.82 c 6.27 ± 0.85 c 8.84 ± 0.82 c 2.64 ± 0.32 c 4.42 ± 0.44 b
T2 998 ± 17.21 b 1480 ± 20.52 b 482 ± 11.08 b 249 ± 11.52 a 10.12 ± 1.12 b 14.30 ± 1.44b 4.18 ± 0.82b 6.28 ± 0.30 a
T3 969 ± 16.54 b 1399 ± 18.22 c 430 ± 14.54 b 241 ± 13.84ab 10.45 ± 0.92 a 14.78 ± 0.82 b 4.33 ± 0.22 b 6.24 ± 0.34 a
T4 1092 ± 11.52 a 1598 ± 16.50 a 506 ± 12.58 a 266 ± 13.00 a 11.40 ± 0.58 a 16.11 ± 1.12 a 4.71 ± 0.70 a 6.63 ± 0.80 a
T5 909 ± 18.00 c 1370 ± 19.82 c 461 ± 18.52 b 236 ± 15.10 b 10.75 ± 0.82 b 14.71 ± 0.62 b 3.96 ± 0.14 b 6.78 ± 0.34 a
T6 1094 ± 16.12 a 1618 ± 21.30 a 524 ± 10.12 a 251 ± 9.85 ab 11.50 ± 1.10 a 16.18 ± 1.02 a 4.68 ± 0.38 a 6.26 ± 0.30 a
Average 952 a 1493 a 480 a 242 a 10.08 a 15.20 a 4.37 a 6.10 a
Late season
T1 649 ± 15.88 c 941 ± 14.11 d 292 ± 11.82 c 187 ± 10.50 b 5.98 ± 0.58 c 8.51 ± 0.40 c 2.61 ± 0.30 c 4.39 ± 0.22 b
T2 994 ± 12.53 a 1430 ± 18.54 b 436 ± 18.32 b 222 ± 7.56 a 9.40 ± 1.02 b 13.46 ± 0.52 b 4.06 ± 0.32 b 5.36 ± 0.30 a
T3 970 ± 22.50 b 1364 ± 12.20 c 394 ± 11.50 b 215 ± 12.02 a 9.32 ± .38 b 13.35 ± 1.14 b 4.03 ± 0.82 b 5.37 ± 0.24 a
T4 1094 ± 14.00 a 1580 ± 17.32 a 486 ± 21.54 a 240 ± 11.40 a 11.08 ± 1.44 a 15.58 ± 0.92 a 4.50 ± 0.74 a 5.95 ± 0.72 a
T5 908 ± 17.77 b 1335 ± 20.52 c 427 ± 11.62 b 209 ± 14.50 a 9.55 ± 1.04 b 14.38 ± 1.10 b 3.88 ± 0.75a 6.05 ± 0.35 a
T6 1088 ± 8.25 a 1587 ± 18.02 a 500 ± 10.50 a 205 ± 8.70 a 11.12 ± .42 a 15.60 ± 1.08 a 4.57 ± 0.36 a 5.68 ± 0.30 a
Average 951 a 1459 a 448 a 213 b 9.41 b 13.48 b 4.21 a 5.46 a
ANOVA
Treatment (T) * * * ** ** ** * *
Season (S) ns ns ns * * * ns ns
T×S ns ns ns ns ns ns ns ns
Table 2. Pre-and post-anthesis dry matter and nitrogen accumulation and translocation under the combined
organic manure and inorganic fertilization. DMA dry matter accumulation, DMT dry matter translocation, NA
nitrogen accumulation, NT nitrogen translocation, Ant anthesis, Mat maturity, Post-a anthesis accumulation.
Values followed by the same letters, within column, are statistically non-significant at (p < 0.05). Mean values
(n = 3) ± SE. ns: non significant, *p < 0.05, **p < 0.05. For treatment details please see Table 1.
PN PL SSP FGP TGW GY
Treatment PH (cm) (hill−1) (cm) (panicle−1) (%) (g) (kg ha−1)
Early season
T1 90 ± 7.22 c 7.72 ± 1.12 c 20.9 ± 1.55 d 129.23 ± 12.50 d 78.57 ± 4.18 c 18.42 ± 1.85 d 2942 ± 155.52 c
T2 105 ± 5.52 b 10.81 ± 1.05 a 25.23 ± 2.40 ab 143.94 ± 9.55 a 84.65 ± 8.10 b 24.52 ± 2.12 a 5038 ± 175.58 a
T3 103 ± 8.20 ab 9.60 ± 0.52 b 23.48 ± 2.02 bc 139.33 ± 14.12 b 85.37 ± 7.22 a 23.34 ± 1.82 bc 4276 ± 190.26 b
T4 106 ± 10.55 a 10.82 ± 0.32 a 25.47 ± 2.12 a 144.45 ± 10.55 a 85.94 ± 4.52 a 23.58 ± 2.02 ab 5572 ± 265.52 a
T5 104 ± 4.58 ab 9.68 ± 1.04 b 23.52 ± 1.86 c 140.73 ± 17.44 b 85.64 ± 3.18 b 22.83 ± 2.30 b 4050 ± 185.50 b
T6 105 ± 7.22 a 10.57 ± 1.07 a 25.55 ± 1.10 a 144.05 ± 8.86 a 85.53 ± 3.12 a 24.31 ± 1.12 a 5855 ± 105.40 a
Average 102 a 9.43 b 23.80 a 140.25 a 84.25 a 22.76 b 4576 a
Late season
T1 92 ± 4.58 c 6.65 ± 0.90 c 21.02 ± 1.80 d 130.23 ± 10.54 d 77.55 ± 4.62 c 18.31 ± 1.66 d 2855 ± 178.40 d
T2 103 ± 12.15 b 9.66 ± 1.04 c 24.65 ± 1.72 ab 143.55 ± 10.50 ab 84.35 ± 4.32 b 23.83 ± 1.10 b 4559 ± 212.58 b
T3 103 ± 10.30 b 10.04 ± 0.52 b 23.59 ± 2.08 b 142.03 ± 16.66 bc 85.33 ± 4.40 a 23.52 ± 2.12 b 4197 ± 185.80 c
T4 105 ± 8.55 a 10.56 ± 1.10 a 24.86 ± 1.52 a 144.92 ± 15.05 a 85.52 ± 8.10 a 24.64 ± 1.16 a 5251 ± 268.42 a
T5 104 ± 6.54 ab 10.16 ± 1.04 b 23.46 ± 1.72 b 142.14 ± 13.30 bc 85.34 ± 4.12 a 23.34 ± 1.14 b 4168 ± 288.52 c
T6 106 ± 7.52 a 10.64 ± 1.04 a 25.04 ± 2.04 a 145.44 ± 11.55 a 85.35 ± 5.05 a 24.58 ± 2.20 a 5273 ± 145.50 a
Average 102 a 9.55 a 23.78 a 141.24 a 83.8 a 23.06 a 4383 a
ANOVA
Treatment (T) * ** ** ** ** ** **
Season (S) ns * ns ns ns * ns
T×S ns ns ns ns ns ns ns
Table 3. Changes in rice growth, yield and yield components under organic and inorganic N fertilizer
application. PH plant height, PN panicle number, PL panicle length, SSP spikelet number per panicle, FGP
filled grain percent, TGWthousand grain weight, GY grain yield. Values followed by the same letters, within
column, are not significantly different at p ≤ 0.05. Mean values (n = 3) ± SE. ns: non significant, *p < 0.05,
**p < 0.05. For treatment details please see Table 1.
Scientific Reports | (2021) 11:10048 | https://doi.org/10.1038/s41598-021-89246-9 8
Vol:.(1234567890)www.nature.com/scientificreports/
Figure 5. Linear relationships of grain yield with net photosynthetic rate (Pn) (A), Nitrate reductase (NR) (B),
glutamine synthetase (GS) (C), and glutamine oxoglutarate aminotransferase (GOGAT) (D). **p < 0.01. n = 6.
Figure 6. Linear relationships of grain yield with post-anthesis DMA (A), dry matter translocation (B), post-
anthesis NA (C), and nitrogen translocation (D). Note:DMA- dry matter acuumulation, DMT- dry matter
translocation, NA-nitrogen accumulation, NT- nitrogen translocation. **p < 0.001. n = 6.
yield. Consistent with our results, many authors have reported that increased N uptake leads to increases in Pn,
overall photochemical efficiency of PSII, and leaf physiological activity; this delays leaf senescence in the late
growth period and eventually enhances photosynthetic production during the grain-filling s tage59,60.
Cereal crop yields are strongly dependent on post-anthesis DM production and the translocation of DM
accumulated prior to anthesis to grain30. Pal et al.30 also concluded that the contribution to grain yield of DM
production prior to anthesis ranged from 22 to 69%, depending on rice cultivar and the sowing time. Moreover,
Wu et al.32 stated that variation in rice yield between the early and late growing seasons could be explained pri-
marily by the difference in post-anthesis DM production. In the current study, the combined treatments T 4 and
T6 had the highest values of DMT and accumulated pre-anthesis and post-anthesis DM production, as shown in
Table 2. Highest DM and N accumulation under the combination of 30% manure and 70% inorganic fertilizer
could be attributed to a high and continuous supply of nutrients due to improved soil fertility (Table 1). The
constant and steady release of N from the cattle and poultry manure, particularly during the grain-filling period,
would have encouraged their use by the p lant26.
Scientific Reports | (2021) 11:10048 | https://doi.org/10.1038/s41598-021-89246-9 9
Vol.:(0123456789)www.nature.com/scientificreports/
Figure 7. Ordination plot of results from redundancy analysis to identify relationship between soil properties,
pH, soil organic carbon (SOC), total nitrogen (TN), available phosphorous (AP) bulk density (BD), and
microbial biomass carbon (MBC) and nitrogen (MBN) with N metabolism enzymes activities (NR, GS, and
GOGAT), dry matter accumulation (DMA), and grain yield (GY).
Linear regression analysis showed that post-anthesis DM accumulation was more strongly positively cor-
related with grain yield (R2 = 0.81**, Fig. 6A) than was DMT (R2 = 0.71*, Fig. 6B). This finding underscored that
both processes are important, but post-anthesis DM production plays a more important role in higher grain
yield. Similarly, pre- and post-anthesis N accumulation were also highly positively correlated with grain yield:
post-anthesis NA (R2 = 0.73**, Fig. 6C) and NT (R2 = 0.80**, Fig. 6D). The current study confirms that plants
rely primarily on post-anthesis DM production and N accumulation for grain filling. Higher post-anthesis DM
production and N accumulation in the combination treatments were due mainly to adequate availability of
nutrients, which delayed leaf senescence and increased N remobilization.
Rice grain yield is determined by yield components, including the number of tillers, panicle length, and
spikelets per p anicle32,61. In the present study, the combination of manure and synthetic N fertilizer significantly
improved rice growth, yield, and yield components compared to urea fertilization alone (Table 3). The higher
rice growth, yield, and yield traits under the combination treatments could be attributed mainly to a balanced
and continuous supply of nutrients due to enhanced soil fertility (Table 4), which ultimately improved plant
nutrient uptake and growth. The continued and slow release of N from organic manure, particularly during the
grain-filling period, may have enabled its efficient utilization by the c rop41,62. Moreover, the RDA showed that
the x-axis explained 96.3% of the variation, and the y-axis explained 0.03%. It revealed significant positive cor-
relations of grain yield, leaf physiological traits, N metabolism enzyme activities, and dry matter accumulation
with all soil properties (Fig. 7).
Conclusion
Application of a combination of organic manure and chemical fertilizer enhanced soil physical and biochemical
traits, leaf physiological activity, and rice yields compared with chemical fertilizer alone. The co-incorporation of
manure and synthetic fertilizers significantly improved pre- and post-anthesis DM production and N accumula-
tion compared with the application of urea alone. Improvements in DM production and N accumulation were
due primarily to improved soil fertility and leaf physiological activity, including Pn, Chl, and the activities of
N-metabolizing enzymes, which further increased DM production and N uptake. RDA revealed positive relation-
ships between grain yield and soil properties (i.e., SOC, TN, AN, and AP), and a significantly higher correlation
was observed between grain yield and soil MBC and MBN. The combination of organic manure and synthetic
fertilizer in a 30:70 ratio is a beneficial and sustainable practice for rice production and soil quality improvement.
Materials and methods
Experimental site. The experiment was conducted at the experimental farm of Guangxi University, China
(22° 49′ 12″ N, 108° 19′ 11″ E; 75 m) in the early season (March to July) and late season (July to November) of
2019. The region is characterized by a subtropical, monsoon climate with average annual rainfall of 1080 mm.
The average maximum and minimum temperatures are 32.5 °C and 24.2 °C in the early season and 31.2 °C and
22.0 °C in the late season (Table 4). The soil is classified as an ultisol based on USDA classification. It is slightly
acidic with pH 5.94, soil organic carbon (SOC) 14.56 g kg−1, total N (TN) 1.41 g kg−1, available phosphorous (P)
23.12 mg kg−1, available potassium (K) 233.33 mg kg−1, and a high bulk density (BD) of 1.36 g cm−3 (Table 5).
Experimental design and field management. The field experiment was performed in a randomized
2). Cattle manure (CM)
complete block design (RCBD) with three replicates and a plot size of 3.9 m × 6 m (23.4 m
and poultry manure (PM) were the organic fertilizers and urea was the chemical fertilizer (CF). The experiment
Scientific Reports | (2021) 11:10048 | https://doi.org/10.1038/s41598-021-89246-9 10
Vol:.(1234567890)www.nature.com/scientificreports/
Maximum Minimum Relative Total
Months Temperature (°C) Temperature (°C) Humidity (%) Rainfall (mm)
March 24 16 83 72
April 29 21 76 92
May 31 23 83 176
June 35 25 81 211
July 35 26 82 231
August 36 26 80 151
September 33 24 79 115
October 29 21 82 98
November 26 16 87 110
Table 4. Mean maximum and minimum temperatures, relative humidity, and total rainfall during both
growing seasons.
Cattle Poultry
Properties Soil Manure Manure
Porosity (%) 40.52 – –
Moisture content (%) 11.93 – –
Bulk density (g cm−3) 1.36 0.81 0.74
pH (water) 5.94 7.75 7.95
SOC (g k g−1) 14.56 146.33 164.22
SOM (g k g−1) 25.08 254.63 282.42
Total N (g kg−1) 1.41 9.76 13.58
Total P (g kg−1) 0.75 10.12 7.32
Total K (g k g−1) - 14.22 9.76
Available N (mg kg−1) 134.7 – –
Available P (mg kg−1) 23.12 – –
Available K (mg kg−1) 233.3 – –
Table 5. Physical and chemical properties of soil and manure before the experimentation. SOC soil organic
carbon, SOM soil organic matter, N nitrogen, P phosphorous, K potassium, C: N carbon to nitrogen ratio.
consisted of six treatments, i.e., : no N fertilizer (T1); 100% CF (T2); 60% CM + 40% CF ( T3); 30% CM + 70% CF
(T4); 60% PM + 40% CF (T5), and 30% PM + 70% CF ( T6). The noodle rice cultivar “Zhenguiai” was used as the
test crop. Rice seeds were sown in an open filed in plastic seedling trays, and urea was applied to the nursery at
the time of preparation. The 25 day- old seedlings were transplanted to the field, and two seedlings per hill . The
plant-to-plant distance was 10 cm, the row-to-row distance was 30 cm, and the total number of plants in each
plot was 780. The recommended dose of NPK was 150:75:150 (kg ha−1), and every plot received 175.5 g of P2O5
from superphosphate, 365 g of KCl from potassium chloride, and 351 g of N from PM or CM and CF (urea)
after proper N estimation. The net N, P, and K contents in the urea, superphosphate, and potassium chloride was
46%, 20%, and 60%, respectively. The chemical composition of the organic manure and the nutrient content and
quantity for each treatment are shown in Tables 5 and 6. N and KCI were applied in three splits as a basal dose
(60%), at the early tillering stage (20%), and at panicle initiation (20%). P was delivered as a basal dose one day
before transplantation (Table 6).
Organic fertilizer, such as CM and PM were obtained from the cattle and poultry farms, located in the local
area. Organic manure applied to plots 20 days prior to transplantation. The T1 treatment received no N fertilizer
but received P and K fertilizers at rates equal to those in N-treated plots. Standard flood water was provided at
a depth of approximately 5 cm from transplant to physiological maturity. Normal agricultural practices were
used for all treatments, including irrigation (about 5 cm flood water), insecticide application (chlorantraniliprole
formulations sprayed at the recommended rate of 150 mL a.i. per ha), and herbicide application (paraquat at
10 gallons per acre).
Sampling and analysis. Sampling and analysis of soil and manure. Subsamples of initial soil and or-
ganic fertilizers (CM and PM) were dried at room temperature and passed through a 2-mm sieve. Inaddition,
three replicate soil samples were taken from the 0–20 cm depth after harvest in the early and late seasons, to
assess changes in soil properties. Soil bulk density (BD) was determined by the core method as described by
Grossman63, and used to calculate soil total porosity using Eq. (1) recomended by H
illel64:
Porosity = (1 − (BD/PS)) × 100 (1)
Scientific Reports | (2021) 11:10048 | https://doi.org/10.1038/s41598-021-89246-9 11
Vol.:(0123456789)www.nature.com/scientificreports/
where BD is soil bulk density and PS is particle density, assumed to be 2.65 mg m−3. Soil moisture content was
measured as described by Ledieu et al65. Air-dried soil was passed through a 0.5-mm sieve, and the weight of
the tin (g) was taken as W1. A 1 g soil sample was taken along with the tin and weighed as W2. The soil sam-
ples were dried in an oven for 2 h at 105 °C to obtain a constant weight as W3. Soil moisture content (%) was
determined using Eq. (2):
W2 − W3
MC % = (2)
W3 − W1
Soil organic carbon was measured using the oxidation method. Soil subsamples (0.5 g) were digested with
5 mL of 1 M K2Cr2O7− H2SO4 and 5 mL of concentrated H 2SO4 and boiled at 175 °C for 5 min, accompanied
eSO4 digests according to the method of Bao66. To measure total soil N content, 200 mg of soil
by titration of F
was digested using the salicylic-acid sulfuric-acid hydrogen peroxide method of Ohyama et al.67, and TN was
analyzed using the micro-Kjeldahl method of Jackson68. Total P was determined using the ascorbic acid described
by Murphy69. Total K was measured by preparing a standard stock solution by dissolving KCI in distilled water
and measuring TK at 7665 R wavelength with an atomic absorption spectrophotometer (Z-5300; Hitachi, Tokyo,
Japan) after sample digestion. Soil organic matter (SOM) was calculated by multiplying the SOC by 1.72.
AN was estimated using the methods of Kostechkas and Marcinkevicinee70 and Dorich and Nelson71. Soil
AP was measured by the N aHCO3 extraction method and analyzed by the Mo-Sb colorimetric procedure using
a spectrophotometer (UV 2550, Shimadzu, Japan) by method of B ao66. Soil AK was assessed by the method of
Knudsen et al.72, using normal 1 M N H4OAc. Soil pH was measured with a digital pH meter (Thunderbolt PHS-
3C, Shanghai, China) after mixing the soil and organic manure with distilled water at a 1:2.5 (w/v) ratio for 1 h.
Soil microbial biomass. The fumigation extraction technique was used to determine MBC as described
by Brookes et al.73, and MBN according to the procedure of Vaince et al.74. From the composite soil samples, we
took 10 g of soil and divided it into similar halves. In a vacuum desiccator, 25 ml of ethanol-free CHCL3 was put
in petri dish to disinfect first half of the soil (5 g) for 24 h at room temperature (25 °C). The samples were placed
in warm water at 80 °C after fumigation to eliminate fumes, and 20 ml of K 2SO4 (0.5 M) was then used to remove
C and N from both the fumigated and non-fumigated soils. The filtrated samples were then processed on a TOC
Analyzer (TNM1; Shimadzu) and subjected to Kjeldhal digestion in order to calculate total C (TC) and TN.
Equation (3) was used to estimate MBC and MBN:
TN or TCfu − TNor TCnfu
MBC or MBN = (3)
kEN or kEC
where TNfu and TNnfu are the total N in fumigated and non-fumigated samples, and TCfu and TCnfu are the
TC concentrations in fumigated and non-fumigated samples. A kEC coefficient of 0.45 was used to estimate
MBC according to the method of Jenkinson et al.75, and a kEN coefficient of 0.54 was used to estimate MBN
ueller76.
according to the method of Joergensen and M
Accumulation and translocation of DM and N. Three replicate plants were collected at anthesis and
at physiological maturity to measure DM and N accumulation. The rice plant was divided into leaves (leaf
blade + leaf sheeth), stems, and panicles, and then oven-dried to constant weight at 65 °C. Rice plant sub samples
were ground to powder, and total N was estimated using the micro-Kjeldhal method as described by J ackson68.
Post-anthesis DM or N accumulation is considered to be the difference in aboveground accumulation between
anthesis and maturity30. Assuming that all DM and N losses from the vegetative organs of the plant were trans-
ferred to the grains, N translocation (NT) and DM translocation (DMT) during the grain filling stage were
measured according to the equations of Papakosta and Gagianas77:
(4)
DMT = DMa − DMleaf, m + DMstem, m + DMchaff , m
(5)
NT = NTa − NTleaf, m + NTstem, m + NTchaff , m
where DMa is the total aboveground DM accumulation at anthesis and D Mstem,m, DMleaf,m, and D
Mchaff,m are
the DM of leaves, stems, and chaff at maturity. NTa is the total aboveground N accumulation at anthesis, and
NTstem,m, NTleaf,m, and NTchaff,m are the total N accumulation of stems, leaves, and chaff at physiological maturity.
Rice leaf net photosynthetic efficiency and chlorophyll content. To assess the process of leaf
senescence during the reproductive phase, flag leaf chlorophyll content, photosynthetic rate (Pn), and days to
maturity were also determined. Flag leaf Pn and Chl content (Chl a and Chl b) were measured at the grain-filling
stage. Pn was measured on the completely expanded flag leaf using a portable photosynthesis instrument (LI-
6400, LI-COR, Lincoln, NE, USA). Measurements were made on a sunny day from 10:00 a.m. to 12:00 p.m. The
sampling conditions were light intensity 1200 µmol m−2 s−1, air humidity 70%, C O2 375 μmol mol−1, and leaf
temperature 28 °C.
To measure leaf chlorophyll content, 1 g of fresh leaf tissue was cut into small pieces, placed in a volumetric
flask that contained 10 mL of 80% acetone solution as described in Porra et al.78, and stored in the dark for 24 h.
The absorbance of the extracted solution was measured at 663 and 645 nm using a UV spectrophotometer (Infi-
nite M200, Tecan, Männedorf, Switzerland) to estimate chlorophyll a and b content (mg g −1) using the equations
described by A rnon79:
Scientific Reports | (2021) 11:10048 | https://doi.org/10.1038/s41598-021-89246-9 12
Vol:.(1234567890)www.nature.com/scientificreports/
Treatment N (g p
lot−1) Urea (g plot−1) CM or PM (kg p
lot−1) Basal fertilization (kg plot−1) Tillering (g p
lot−1) Panicle initiation (g plot−1)
T1: No− N 0 0 0 P2O2: 0.93, KCl: 0.30 KCl: 0.30 Urea: 0
T2: 100% CF 351 753 0 Urea: 0.45, P2O2: 0.93, KCl: 0.30 Urea: 150, KCl: 0.30 Urea: 150
T3: 60% CM + 40% CF 351 301 21.5 Urea: 0, CM: 21.5, P2O2: 0.93, KCl: 0.30 Urea: 150, KCl: 0.30 Urea: 150
Urea:1.17, CM: 10.7, P
2O2: 0.93, KCl:
T4: 30% CM + 70% CF 351 527 10.7 Urea: 150, KCl: 0.30 Urea: 150
0.30
T5: 60% PM + 40% CF 351 301 15.5 Urea: 0, PM: 15.5, P2O2: 0.93, KCl: 0.30 Urea: 150, KCl: 0.30 Urea: 150
T6: 30% PM + 70% CF 351 527 7.7 Urea: 0, PM: 7.7, P2O2: 0.93, KCl: 0.30 Urea: 150, KCl: 0.30 Urea: 150
Table 6. Nutrient content and amount nutrient provided of each treatment and application time. N nitrogen,
CF chemical fertilizer (urea), CM cattle manure, PM poultry manure, P2O2 superphosphate, KCl potassium
chloride.
C(Chl a) = 12.71 D663 − 2.59 D645 (6)
C(Chl b) = 22.88 D645 − 4.67 D663 (7)
where C(Chl a) and C(Chl b) are the content of Chla or Chb; D663 and D645 are the absorbance at 663 and 645 nm,
respectively, using spectrophotometer (Model-1800, Tecan-infinite M200, Switzerland).
Nitrogen metabolizing enzyme activities . Five flag leaves were collected from each treatment during
the grain-filling period, immediately frozen in liquid N and stored at ‒ 80 °C for estimation of the activities of
the N-metabolizing enzymes such as Nitrate reductase (NR), Glutamine synthetase (GS), and Glutamate syn-
thase was extracted and measured using a Glutamate Synthase (GOGAT).
NR was extracted and measured using a Nitrate Reductase (NR) assay Kit (BC0080, Solarbio, Beijing, China).
Briefly, 0.1 g leaf samples were extracted in 1 ml extraction solution and the mixture was centrifuged at 4000 g for
10 min. The resulting supernatant was collected for further analysis. The absorbance at 520 nm was used for the
calculation of NR activity. GS was extracted and measured using a Micro Glutamine Synthetase (GS) assay Kit
(BC0915, Solarbio, Beijing, China). Briefly, 0.1 g leaf samples were thoroughly ground in liquid nitrogen and
extracted with 1 mL extraction buffer. The mixture was centrifuged at 8000 g at 4 °C for 10 min. The supernatant
after centrifuging was collected for activity measurement. The absorbance at 520 nm was used for the calcula-
tion of GS activity.
Glutamate synthase was extracted and measured using a Glutamate Synthase assay Kit (BC0070, Solarbio,
Beijing, China). Briefly, 0.1 g leaf samples were extracted in 1 mL extraction buffer. The extraction mixture was
centrifuged at 10,000 g at 4 °C for 10 min. The resulting supernatant was harvested and the absorbance at 340 nm
was measured for the calculation of GOGAT activity.
Rice yield and yield attributes. Five central rows from each plot were selected at physiological maturity
to measure rice growth, yield, and yield traits. Three hills were randomly selected at physiological maturity to
measure plant height, panicle number, panicle length, spikelet number per panicle, grain filling percentage,
and thousand-grain weight. The crop was harvested when almost all the heads showed a complete loss of green
color. Grain yield (kg/ha) was measured from five central rows in each treatment and adjusted to 14% moisture
content.
Statistical analysis. Analysis of variance (ANOVA) was performed with Statistics 8.1 software to examine
variations in soil physical and biochemical properties, leaf physiological traits, rice grain yield, and yield com-
ponents. Percentage data were arcsine transformed prior to analysis. Data from both seasons were used in the
analysis in order to detect differences between seasons as well as fertilizer treatments. Treatment was considered
to be a fixed effect, and season was considered to be a repeated measures factor and a fixed effect. The interac-
tion between fertilizer treatment and season was also taken as a fixed effect, but the interaction of season and
treatment with replication was taken as a random effect. Mean separation was performed using the least signifi-
cant difference (LSD) method at p < 0.05. Linear regression analysis was performed to evaluate the relationship
between grain yield and Pn, N-metabolizing enzyme activities, pre-and post-anthesis DM, and N accumulation.
Redundancy analysis (RDA) was performed using Canoco version 5 (Cambridge University Press, Cambridge,
UK). .
Received: 15 May 2020; Accepted: 15 April 2021
References
1. Chauhan, B. S., Jabran, K. & Mahajan, G. Rice Production Worldwide (Springer, 2017).
2. Carrijo, D. R., Lundy, M. E. & Linquist, B. A. Rice yields and water use under alternate wetting and drying irrigation: a meta-
analysis. Field Crop Res. 203, 173–180 (2017).
Scientific Reports | (2021) 11:10048 | https://doi.org/10.1038/s41598-021-89246-9 13
Vol.:(0123456789)You can also read