CLOSING THE LOOP ON PLASTIC POLLUTION IN DA NANG CITY, VIETNAM - Baseline Report - United Nations ...
←
→
Page content transcription
If your browser does not render page correctly, please read the page content below

1

CLOSING THE LOOP
ON PLASTIC POLLUTION
IN DA NANG CITY,
VIETNAM
Baseline Report
2   CLOSING THE LOOP ON PLASTIC POLLUTION IN DA NANG CITY, VIETNAM                            3

    Acknowledgement

    This report was prepared by the United Nations Economic and Social Commission
    for Asia and the Pacific (UN-ESCAP) in collaboration with the Department of Natural
    Resource and Environment (DONRE), Da Nang City and its development partners. The
    editorial team consists of:

    •   United Nations Economic and Social Commission for Asia and the Pacific (ESCAP) –
        Ms. Janet Salem, Mr. Andrew Charles, Mr. Alexander Lee-Emery, and Ms. Abigail Smith
        under Section Chief Mr. Curt Garrigan

    •   Institute for Global Environmental Strategies (IGES) – Dr. Premakumara Jagath
        Dickella Gamaralalage, Ms. Miho Hayashi and Dr. Ngoc-Bao Pham

    •   University of Leeds - Dr. Costas Velis (Principal Investigator) and Dr. Josh Cottom

    •   International Solid Waste Association (ISWA) - Ms Aditi Ramola

    •   University of Da Nang – Dr. Thi Kinh Kieu and Dr. Pham Phu Song Toan

    •   International Union for Conservation of Nature (IUCN) – Ms. Nguyen Thi Bich Hien

    This publication may be reproduced in whole or in part for educational or non-profit
    purposes without special permission from the copyright holder, provided that the source
    is acknowledged. The ESCAP Publications Office would appreciate receiving a copy of
    any publication that uses this publication as a source.

    No use may be made of this publication for resale or any other commercial purpose
    whatsoever without prior permission. Applications for such permission, with a state-
    ment of the purpose and extent of reproduction, should be addressed to the Secretary
    of the Publications Board, United Nations, New York. The mention of firm names and
    commercial products does not imply the endorsement of the United Nations.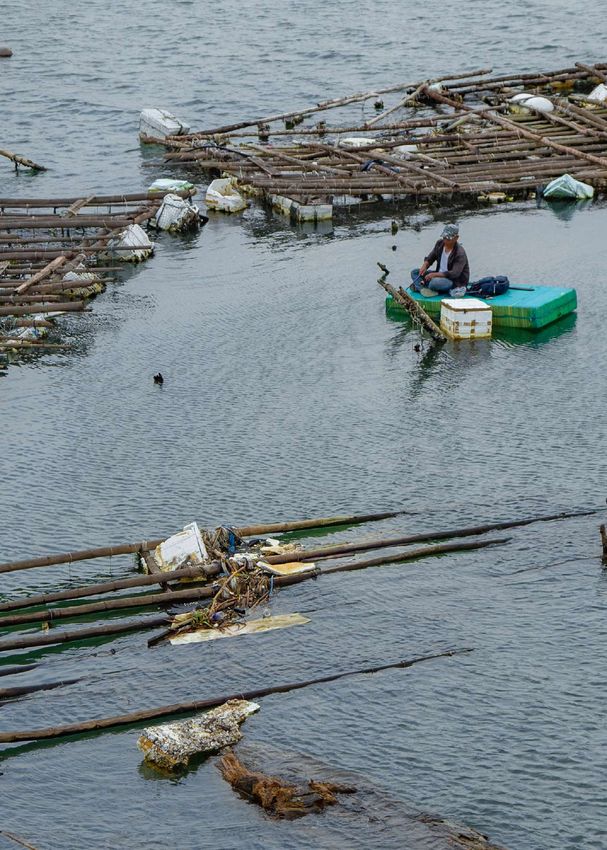
4   CLOSING THE LOOP ON PLASTIC POLLUTION IN DA NANG CITY, VIETNAM                                                                                       TABLE OF CONTENTS   5

    Table of Contents

                      Summary                                                           02   City Profile
                      Statement from Da Nang City                                 P10        2.1 Population                                                      P42
                      Key Findings on Plastic Waste in Da Nang City               P12        2.2 Environment                                                     P43
                      Plastic Management Recommendations                          P14        2.3 Economy                                                         P44
                      Policy Recommendations                                      P16

    01                Introduction
                                                                                        03   Status of Plastic Waste Management,
                                                                                             Leakage and Hotspots
                      1.1 Background                                              P20        3.1 Municipal Solid Waste (MSW) Generation                          P48
                      1.2 Aims                                                    P22            3.1.1 MSW Generation by District
                      1.3 Methodology                                             P24            3.1.2 MSW Generation by Source Activity
                              1.3.1 The Plastic Pollution Calculator (PPC) Tool              3.2 Plastic Waste Generation and Composition                        P54
                              1.3.2 A Review of Governance Aspects		                         3.3 Plastic Emissions to the Environment                            P57
                      1.4 Study Area                                              P38            3.3.1 Key Sources of Plastic Pollution
                      1.5 Project Coordination Team                               P39            3.3.2 Composition of Plastic Emissions to the Enviroment
                      1.5 Data Verification                                       P39            3.3.3 Plastic Emissions with Time
                                                                                                 3.3.4 Spatial Distribution of Plastic Pollution Emissions
                                                                                             3.4 River and Marine Plastic Pathways                               P68
                                                                                                 3.4.1 Key Pathways of River and Marine Plastic
                                                                                                 3.4.2 Pathways of River and Marine Plastic with Time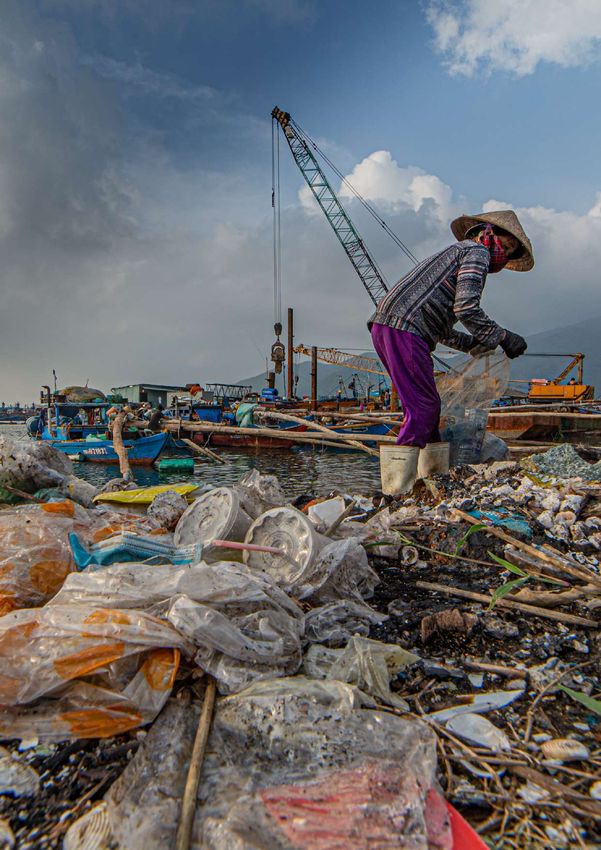
6   CLOSING THE LOOP ON PLASTIC POLLUTION IN DA NANG CITY, VIETNAM                                                                                                                        ABBREVIATION   7

                                                                                                    Abbreviation
                                                                                                    3Rs      Reduce, Reuse, Recycle
                      3.5 Fate of Plastic Waste					                                         P71    BC       Black Carbon

                              3.5.1 Plastic Recycling						                                         ASEAN    The Association of Southeast Asian Nations

                              3.5.2 Retained at Disposal Site					                                  CBO      Community Based Organization

                              3.5.3 Openly Burnt							                                             CO2      Carbon Dioxide

                              3.5.4 Retained on Land and Drains                                     CTL      Closing the Loop

                              3.5.5 River and Marine Plastic Pollution                              DEM      Digital Evaluation Model

                                                                                                    DOC      Department of Construction

                                                                                                    DONRE    Department of Natural Resources and Environment

                                                                                                    ESCAP    United Nations Economic and Social Commission for Asia and the Pacific

    04                A Review of Governance Aspects
                                                                                                    GDP

                                                                                                    IGES

                                                                                                    ISWA
                                                                                                             Gross Domestic Product

                                                                                                             Institute for Global Environmental Strategies

                                                                                                             International Solid Waste Association
                      4.1 Institutional Setup					                                           P84    IUCN     International Union for Conservation of Nature
                              4.1.1 National/ Provincial Institutions Responsible for 		            MFA      Material Flow Analysis
                                       Implementing Plastic Waste/ Marine Litter                    MONRE    Ministry of Natural Resources and Environment
                              4.1.2 Local (City) Institutions Responsible for Implementing          MSW      Municipal Solid Waste
                                       Waste Management and Marine Litter                           Mt       Metric tonne
                      4.2 Key Policies and Regulations			                                    P94    NGO      Non-Government Organization

                              4.2.1 National Policies and Legislations			                           PET      Polyethylene terephthalate (plastic drinking bottles are commonly made of)

                              4.2.2 City and Waste Management				                                   PPE      Personal Protection Equipment

                      4.3 Financial Capacity					                                            P99    PPC      Plastic Pollution Calculator

                      4.4 Digital Readiness in Da Nang City                                  P102   SDG      Sustainable Development Goals

                                                                                                    SWM      Solid Waste Management

                                                                                                    UOL      University of Leeds

                                                                                                    UNDP     United Nations Development Programme

    05                Conclusions and Recommendations
                                                                                                    URENCO

                                                                                                    VASI

                                                                                                    VEA
                                                                                                             Urban Environment Company

                                                                                                             Viet Nam Administration of Seas and Islands

                                                                                                             Viet Nam Environmental Administration
                      5.1       Management-Level Recommendations                             P107   VND      Vietnamese dồng
                      5.2       Policy-Level Recommendations                                 P110   WCSC     Waste Collection Service Charge

                                                                                                    WEPA     Waste Management and Environmental Promotion Agency
SUMMARY
8                                               9

    CLOSING THE LOOP ON PLASTIC POLLUTION
    IN DA NANG CITY, VIETNAM

    P10
           City Statement
    P12
           Key Findings on Plastic Waste in
           Da Nang City
    P14
           Plastic Management Recommendations
    P16
           Policy Recommendations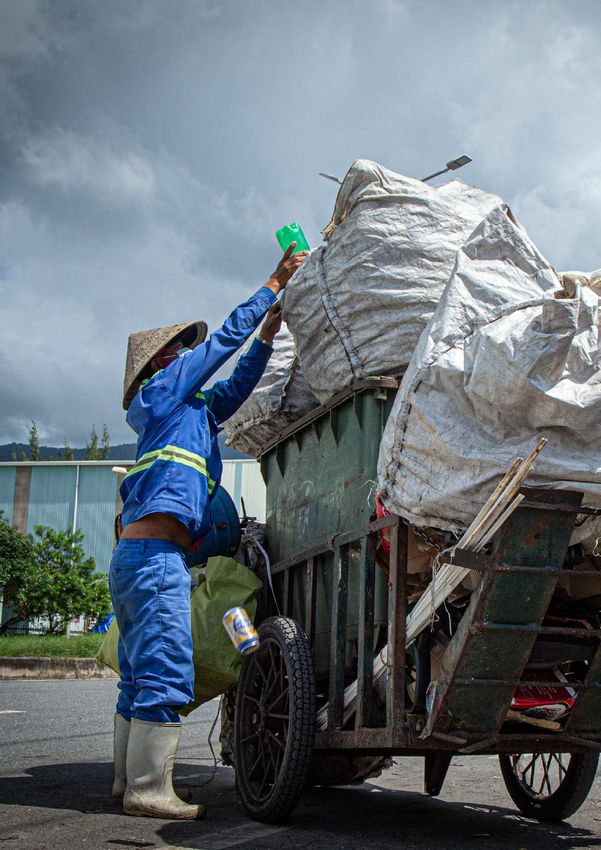
10   CLOSING THE LOOP ON PLASTIC POLLUTION IN DA NANG CITY, VIETNAM                                                                                                                             11

     City Statement
     Director of Department of Natural Resources and
     Environment (DONRE), Da Nang City

     With a population of about 1.1 million people, Da Nang City is a dynamic coastal city,        With technical support of many national and international organizations the Project
     which is rapidly developing in the central region of Viet Nam. Along with economic            ‘Closing the Loop: Innovation and Scaling Up to Solve the Problem of Plastic Pollution in
     growth, the amount of solid waste generated is constantly increasing. On average, the         Marine Areas in ASEAN Cities’ by the United Nations Social Commission of Asia and the
     City generates about 1,100 tons per day, of which plastic waste accounts for a large          Pacific (ESCAP), supported by the Government of Japan. Together, with the Institute for
     proportion and is expected to increase in coming years. If not strictly controlled, plastic   Global Environmental Strategy (IGES), University of Leeds and International Union for
     wastes will affect the quality of the environment, marine ecosystems and human health.        Conservation of Nature (IUCN) Da Nang City has created baseline research to identify
                                                                                                   plastic waste and potential sources of plastic leakage to the environment, establishing
     On 4 December 2019, the Government of Viet Nam issued the National Action Plan for
                                                                                                   highly feasible target actions.
     Management of Marine Plastic Litter by 2030 (Decision No. 1746/QD-TTg). The National
     Action Plan aims to prevent and reduce ocean plastic waste from waste sources on land         Promoting these very important results, the Department of Natural Resources and Envi-
     and activities at sea, to completely eliminate the use of single-use plastic products and     ronment of Da Nang City will continue to make efforts and coordinate with national and
     plastic bags from resorts, tourist attractions, accommodations and other tourist service      international organizations to effectively mobilize the participation of all organizations
     businesses along the coast to ensure no plastic wastes in marine protected areas.             and communities. The people of the city aim to minimize the amount of plastic waste,
                                                                                                   contributing to the construction of an Environmental City!
     Building on the Da Nang - An Environmental City Plan, in addition to a series of other
     development goals, the city’s Department of Natural Resources and Environment
     (DONRE) with the People’s Committee Danang City issued the following Action Plan to
                                                                                                                                                           Dr. Architect. To Van Hung
     Manage Marine Plastic Litter in Da Nang City by 2025, With A Vision Towards 2030 (KH
                                                                                                                         Director of Department of Natural Resources and Environment
     122/KH-UBND) on June 24, 2021.
                                                                                                                                                                Da Nang City, Vietnam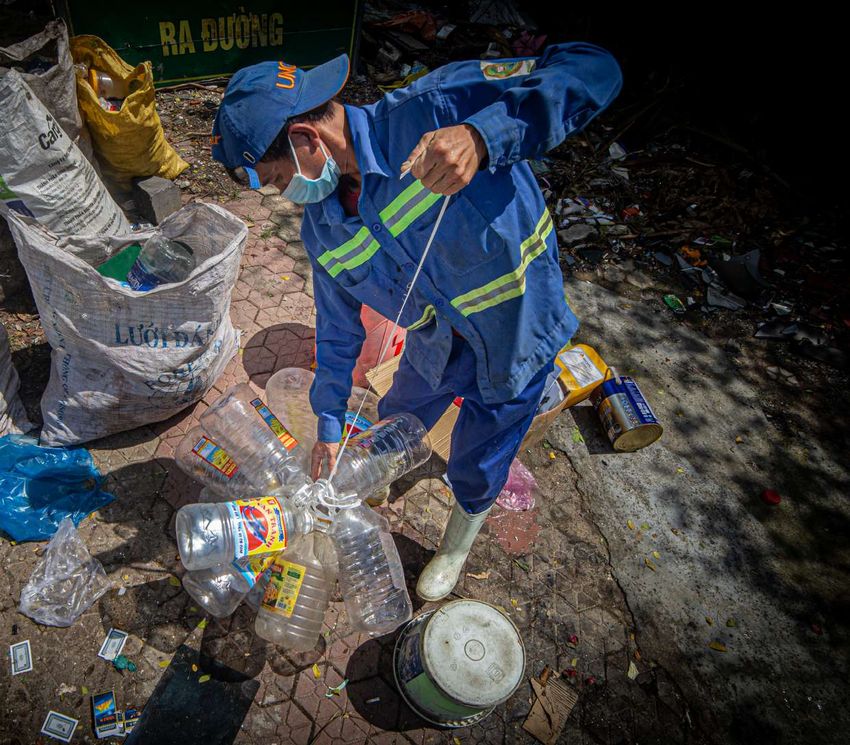
12   CLOSING THE LOOP ON PLASTIC POLLUTION IN DA NANG CITY, VIETNAM                                                                                                  KEY FINDINGS ON PLASTIC WASTE IN DA NANG CITY   13

     Key Findings on Plastic Waste in Da Nang City

                            Key results of the Plastic Pollution Calculator for                          •   Plastic pollution is a major problem in Da Nang City and requires immediate strat-
                                the case study of Da Nang City, Vietnam                                      egies and policy actions to mitigate the impact on the environment and economy.
                                                                                                             The majority of plastic waste generated is composed of single-use plastic bags (48%),
          WASTE GENERATION
                                                                                                             plastic films (18%) and plastic bottles (5.5%).
                                       •   449,000 tonnes/year
                                                                                                         •   Approximately 8.1% of the plastic waste from land-based sources enters the envi-
                                       •   1.08 kg/capita/day (national average = 0.33 kg/capita/day)1
                                                                                                             ronment, primarily through littering, uncollected waste and fly-tipping. 1.3% of this
                                       •   393 kg/capita/year                                                becomes marine litter, which may seem small, but is equivalent to 1,087 tonnes per
                                                                                                             year and many millions of plastic products.
        PLASTIC COMPOSITION                                                                              •   Lightweight plastic waste (i.e. plastic bags and films) is a particular problem as it is low
                                       •   83,000 tonnes of plastic waste is generated each year
                                                                                                             value, making it unappealing for recyclers and highly mobile in wind or waterways.
                                       •   18.5% of MSW is plastic (national average = 12.15%)1
                                                                                                         •   Although Viet Nam's The National Action Plan for Management of Marine Litter by
                                       •   Plastic bags make up 48% by mass of all plastic waste             2030 aims to reduce fishing gear littered in the ocean, Da Nang City does not have a
                                                                                                             clear strategy to combat this pollution.
                                       •   6,752 tonnes/year of plastic is emitted into the environ-
             WASTE TO THE                                                                                •   Da Nang City has established ambitious targets in their policies regarding waste
             ENVIRONMENT                   ment
                                                                                                             separation at source and 3R activities. However, progress has been limited to pilot
                                       •   Littering is the largest source of plastic pollution (47%)        areas, partly due to a lack of public awareness, cooperation and monitoring capacity.
                                           followed by uncollected waste (23%), fly tipping / illegal
                                                                                                         •   The City needs to lead structural interventions to reduce single-use plastic products.
                                           dumping (14%) and leakage whilst waiting for collection
                                                                                                             These will include measures like advanced monitoring systems and better sorting
                                           (11%).
                                                                                                             mechanisms at the source of waste, including residential communities, public insti-
           OPEN BURNING OF
                                       •   20 tonnes/year of plastic waste is openly burnt                   tutions, schools, retailers and agriculture and aquaculture businesses.
          UNCOLLECTED WASTE
                                       •   Releasing an estimated 57 tonnes of CO2 and 255 kg/year
                                           black carbon emissions

                                       •   The high global warming potential of black carbon means
                                           there are 619 tonnes/year CO2eq emissions

        PLASTIC TRANSPORTATION
                                       •   1,087 tonnes/year of plastic enters waterways
             TO WATERWAYS
                                       •   Whilst only 1.3% of MSW, this is equivalent to many
                                           millions of plastic items

                                       •   5,645 tonnes / year of plastic waste is retained
                                           uncontrolled on land or in drains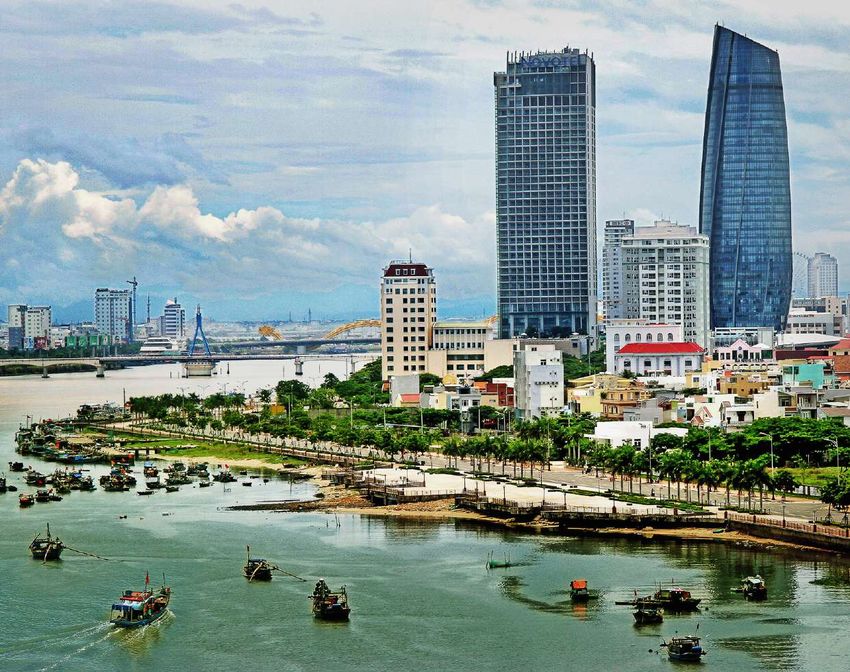
14 CLOSING THE LOOP ON PLASTIC POLLUTION IN DA NANG CITY, VIETNAM PLASTIC MANAGEMENT RECOMMENDATIONS 15
Plastic Management Recommendations
PLASTIC MANAGEMENT RECOMMENDATIONS
1. Reduce Use of Single-Use Plastics, including
3. Increase
Increase Source
recycling Separation
Plastic Bags and Plastic Bottles
Target high emissions Improve waste storage for Why? How?
Why? How? Why?
88% of all plastic waste ends up at the How?
Capacity building including by
plastics (plastic bags, other residential dwellings disposal site where it is retained (142,000 disseminating information on the status
plastic film,
Single-use drinkincluding
plastics bottles plastic Enhancement of waste separation ac- Intons),
Da Nang City,
whereas only
only 6.1%
10.1% of plastic
of plastic is Strengthen the implementation
of recycling activities in Kuala Lumpur, of
and single
bags, plastic use
films,food
and service
PET bottles tivity at source; research and technolo- is recycled.
currently recycled, compared to the sorting,
developcollection, research
digital applications onand apply
the status
Why?
are the most common marine plastic gy development on alternative material national average of 10-15%. The goal recycling technology
of individual andpromote
recycling, and techniques
Leakage whilst waste is waiting for
litter in Da Nang City. The National suchcollection
as biodegradable plastic open-source data sharing on recycling in
Why? estimated as joint through
second of Plan for Solid Waste Treatment with through business investment
Kuala Lumpur, Community based waste
and sup-
Action Plan for Management of Marine building networks and developing
highest emission source of plastic a Vision towards 2045, the City is to port from international cooperation
Largest sources of plastic waste management, implementation of source
Litter by 2030
generation; mandates
targeted under that 100%
Action Planof skills; development
alongside of regulations such
fly tipping. achieve 100% of waste separation at separation synchronously, neighborhood
single-use plastic
of the Roadmap in tourism
towards areas be
Zero Single- as bans, tax/levy for commercial sec- source by 2030. collection stations, awareness raising,
reduced,
Use Plasticsandin 75% of the total marine
Malaysia torsHow?
to limit the use of single-use plas- waste sorting units
plastic litter be reduced by 2030. tics. Improve the quantity and quality of
How? existing waste containers (right size,
MENT RECOMMENDATIONS
Reduce the usage of the plastic through easy loading to truck, lids securely
bans, tax/levy, support for alternatives, fastened, protection from animals/rain/
producing voluntary agreements in retail wind, durable, maintained).
and commercial sectors (e.g. restaurant,
2. Reduce Littering and
hawkers etc), and promoting Extended
Open Dumping, and 18
Increase Collection
Producer Responsibility.
ns Improve waste storage for
Why? How?
s, other residential dwellings
ttles Littering, inadequate waste collection Strengthen controls on littering and
Ensure all storm drains are
ervice and fly-tipping are the leading causes ensure waste bins in tourism areas;
Why? covered
of plastic pollution, particularly in the enforce legislation for waste collection
Leakage whilst waste is waiting for
tourist areas. 100% waste collection
second is and treatment at source, including res-
Reduce
collection littering
estimated and fly-
as joint
mandated by the Da
highest emission
tipping
NangofCity
source Plan for
plastic Why?
idential, institutional, commercial, and
aste
Action Plan Solid WasteflyTreatment
alongside tipping. and until 2030 industrial storm
Many areas.drains are open to the
and Da Nang City Socio-Economic environment, allow plastic items to
ro Single-
How?
Why? enter easily and into nearby waterways.
Development Master Plan to 2020,
Improve
First and the
secondquantity
with a Vision to 2030. and
largest quality
point of
sources
ofexisting waste containers (right size,
pollution. How?
easy loading to truck, lids securely Enclosing or covering storm drains,
stic through
How?
fastened, protection from animals/rain/ regular cleanup of drains, surveillance,
ternatives,
wind, durable,
Encourage maintained).
the public reporting on positioning of litter traps, regular clean
ents in retail
littering and fly-tipping, display signs ups, monitoring of street sweeping
. restaurant,
on fines, enforce penalties, increase the activities.
g Extended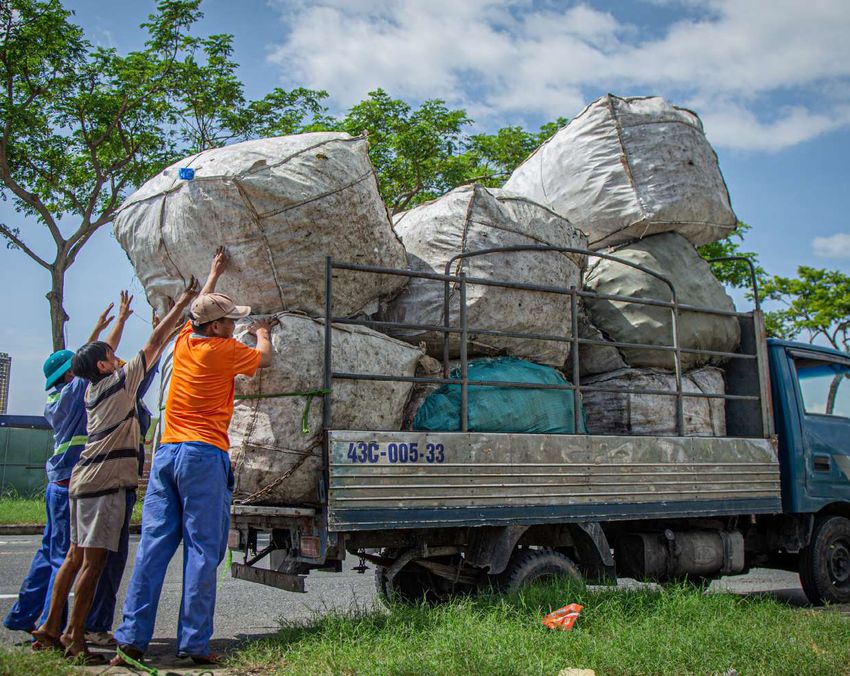
Implementation of policy Strengthen capacity of local
bodies
Why?
16 CLOSING THE LOOP ON PLASTIC POLLUTION IN DA NANG CITY, VIETNAM
A number of policy goals and action Why?
POLICY RECOMMENDATIONS 17
plans are in place and ready to translate SWCorp and DBKL is responsible for
into action on the ground. waste management.
POLICY RECOMMENDATIONS:
How? How?
A Kuala Lumpur Plastic Waste Short to medium term training
Management Action plan with programmes, strengthen institutional
a time-bound implementation set up.
Policy
POLICYRecommendations
POLICYRECOMMENDATIONS:
RECOMMENDATIONS: plan, coordination and monitoring
Cost recovery Use of digital tools, data
management
1. Implementation of Policy 3. Strengthen the Capacity of Local Bodies
Cost recovery
Why?
Implementation
Implementationof
Why? ofpolicy
policy Strengthen
How? capacityMove
Strengthencapacity of from waste
oflocal
local Public participation
Why?
Why? How?To increase the regularity of data
bodies management to 3Rs
bodies Current fees and charges do not cover updates, automate plastic waste
The National Action Plan for Manage- Update and complete the city waste Da Nang
plastic
Why? City management
waste government operations.
is respon- Provide continuous
monitoring training and
and management, and
Why?
Why? provide cost effective monitoring
ment of Marine Litter by 2030 requires segregation plan (Decision No. Why? 1577/ sible forand
Littering waste management.
fly-tipping are key District- awareness-raising on plastic wastetools.
AAnumber
numberof ofpolicy
policygoals
goalsand
andaction
action Why?
Why?
100%are
plans of abandoned fishing gear to be QD-UBND dated April 11, 2019); De- plastic waste through
Preventing How?
sources
and of plastic pollution, and source
ward-level institutions should build management for public officials and
plans are in place and ready totranslate
in place and ready to translate SWCorp
SWCorpand andDBKL
DBKLisisresponsible
responsible for
for
collected, reduce, reuse and recycling strategies separation
Increase is needed to
coverage of increase
existing fee, How?Support inspection of plas-
into action100%
intoaction on theof
onthe single-use plastic at
ground.
ground. velop andmanagement.
waste implement pilot projects to
waste management. will reduce waste management costs
capacity for
recycling.
feasible and sustainable employees.
tourism areas to be reduced, and 75% reduce plastic waste generation at all gradual increases as service improves,
action. Integration
tic packaging of the Digital
activities in cityTool developed
markets
and prevent pollution. cost saving in waste management under Closing the Loop into plastic
How?
of marine plastic litter to be reduced by
How? levels,
How?
How?including community groups, How? by individuals and organisations.
A
operations, polluter-pay-principles. waste action plan monitoring plans.
AKuala
KualaLumpur
2030. LumpurPlastic
PlasticWaste
Waste commercial
Short
Shortto sectors,term
tomedium
medium schools,
term tourism
How?
training
training Awareness raising campaigns, support
Management
Management Action planwith
Action plan with programmes,
facilities, strengthen
agri- and
programmes, institutional
aquaculture
strengthen and with other plans,
Coordinate
institutional to community programs.
aatime-bound
time-boundimplementation
implementation set up.
set up. facilities.
healthcare programmes to reduce single use
plan,
plan,coordination
coordinationandandmonitoring
monitoring plastics, awareness on responsible
consumption and production, increase
4. Public and Private Sector Participation
2. Move From Waste Management to Circular Informal and Private sector
BASELINE REPORT 19
Economy Solutions Why?
participation How?
Private sector involvement in plastic Continue to raise awareness of plastic
Move
Movefrom
fromwaste
waste Public
Publicparticipation
participation pollution mitigation could increase pollution with information, education
Why?
management How? Why?
managementtoto3Rs
3Rs operational efficiency and outreach to and communication materials and
Informal sector plastic a critical role
Establishing a circular economy pol- Support implementation of pilot proj- reduce the consumption of single-use guidelines at all levels. In particular, tar-
Why?
Why? in collection of plastic for recycling
icy with ambitious targets will create ects, including research and communi- plastic items by citizens
up toand businessesgeting residential communities, public
Why?
Why? Littering
Litteringand
andfly-tipping
fly-tippingare
arekey
key and can be scaled introduce
opportunities
Preventing for innovation and ex- cations, to
sources introduce new products
sources of plastic pollution, andsource
of plastic pollution, and and operational efficiency. procurement officials, school children,
Preventingplastic
plasticwaste
wastethrough
through source
perimentation
reduce,
reduce,reuse
reuseand with
and different
recycling
recycling circular
strategies
strategies promote lifestyle
separation
separation changes
isisneeded
needed to to prevent
toincrease
increase tourism facilities and agri- and aqua-
economy
will reducesolutions.
willreduce waste
wastemanagement
managementcosts costs recycling.
plastic waste generation.
recycling. How? cultures. Promote and incentivise the
and prevent pollution.
and prevent pollution. Establish clear scope and specifications development and use of reusable or
How?
How? in contracts, assess qualifications and easy-recyclable alternatives to sin-
How?
How? Awareness
Awarenessraising
raisingcampaigns,
campaigns,support
support monitor performance. Informal sector: gle-use plastic products.
Coordinate
Coordinatewith
withother
otherplans,
plans, to
tocommunity
communityprograms.
programs.
programmes
programmesto toreduce
reducesingle
singleuse
use
plastics, awareness on responsible
plastics, awareness on responsible 20
consumption
consumptionandandproduction,
production,increase
increase
BASELINE REPORT
CHAPTER 1
        18        CLOSING THE LOOP ON PLASTIC POLLUTION IN DA NANG CITY, VIETNAM                                                                                                         19

                                                                                                                                   CLOSING THE LOOP ON PLASTIC POLLUTION
                                                                                                                                   IN DA NANG CITY, VIETNAM
                     POLICY RECOMMENDATIONS:

                                        5. Resource Mobilisation

                       Cost recovery                                                   Use of digital tools, data
                      Why?                                                         How?
                                                                                       management
                      The current budget may limit the im-                         Mobilise domestic and international
                       Cost recovery
                      provement of plastic waste manage-                           resources for technical support and
                                                                                       Why?
                      ment operations. Circular economy                            technology development to reduce
                       Why?                                                            To increase the regularity of data
                      solutions  canand
                       Current fees   offset costs
                                        charges     andcover
                                                do not    help                     plastic waste automate
                                                                                       updates,  generation  and leakage.
                                                                                                          plastic  waste
                      extract
                       plastic maximum   value from
                               waste management      products
                                                  operations.                          monitoring and management, and
                      made of recycled plastic.
                       How?
                                                                                       provide cost effective monitoring tools.
                                                                                                                                   Introduction
NDATIONS:
                       Increase coverage of existing fee,                              How?
                       gradual increases as service improves,
                       cost saving in waste management
                                                                                       Integration of the Digital Tool developed
                                                                                       under Closing the Loop into plastic
                                                                                                                                   P20
                                                                                                                                         Background
                       operations, polluter-pay-principles.                            waste action plan monitoring plans.
                                        6. Use of Digital Tools, Data Management
                                                                                                                                   P22
                                                                                                                                         Aims
                                                                                                                                   P24
                                                                                                                                         Methodology
                      Use of digital tools, data
                      Why?
                      management
                                                                                   How?
                                                                                                                                           The Plastic Pollution Calculator (PPC) Tool
                      Regularity of data updates and moni-                         Integrate remote sensing with AI tech-
                                                                                                                                           A Review of Governance Aspects
                      toring mechanism can help track prog-                        nology developed under Closing the
                       Why?
                       Informal     and Private       sector                                                                               Data Collection
                      ress  and evaluate
                       To increase        solutions.
                                   the regularity of data                          Loop project into plastic waste moni-
                       participation                                               toring plans to monitor and map plas-
not cover              updates, automate plastic waste
perations.             monitoring and management, and                              tic waste hotspots from land to sea.
                                                                                                                                   P38
                                                                                                                                         Study Area
                       provide cost effective monitoring tools.
                       Why?
g fee,
                       Informal sector plastic a critical role
                       How?
                                                                                                                                   P39
                                                                                                                                         Project Coordination Team
                       in collection of plastic for recycling
 improves,
 ment
                       Integration of the Digital Tool developed
                       and can be scaled up to introduce
                       under Closing the Loop into plastic
                       operational efficiency.
                                                                                                                                   P39
                                                                                                                                         Data Verification
ciples.                waste action plan monitoring plans.

                       How?
                       Establish clear scope and specifications
                       in contracts, assess qualifications and
                       monitor performance. Informal sector:

sector       20
20 CLOSING THE LOOP ON PLASTIC POLLUTION IN DA NANG CITY, VIETNAM | CHAPTER 1 21
CHAPTER 1
Introduction
1.1 Background
Plastic pollution presents a tremendous environmental challenge and requires an
urgent global response. Without action, the annual flow of plastic into the oceans will
triple by 2040, reaching 29 million metric tonnes (Mt) per year1. Out of approximately
6,300 Mt of plastic waste had been generated as of 2015, only 9% of global plastic waste
is recycled, 12% is incinerated and the remaining 79% is piled in landfills or unmanaged
in cities, rivers, oceans and forests2. If current production, consumption and waste man-
agement trends continue, roughly 12,000 Mt of plastic waste will be ended up in landfills
or the natural environment by 2050. Fast-growing cities with weak waste management
systems in East Asia, South Asia and China are responsible for about 60% of plastic
waste leakage3. Ocean plastics cost the tourism, fishing, and shipping industries in the
Asia-Pacific region US $10.8 billion per year4.
The lack of effective policies, technologies and capacities to manage plastic waste at the
local level has regional and global implications. More actions are required to address
plastic application and waste management in the ASEAN region, influence consumer
behaviour and build a circular economy across the waste value chain. Tackling plastic
waste protects the oceans and creates social and economic development opportunities.
Within the framework of the 2030 Agenda, integrated approaches across Sustainable
Development Goals (SDGs) 11 (Sustainable Cities and Communities), 12 (Responsible
1
PEW Charitable Trusts and SystemIQ. 2020. Breaking the Plastic Wave: A Comprehensive Assessment of
Pathways Towards Stopping Ocean Plastic Pollution. https://www.pewtrusts.org/en/research-and-analysis/arti-
Consumption and Production) and 14 (Life below Water) with specific targets on plastic
cles/2020/07/23/breaking-the-plastic-wave-top-findings waste and pollution are urgently needed.
2
Geyer, R., Jambeck, J., Law, K. 2017. Production, use, and fate of all plastics ever made. Sci. Adv. 3.
https://advances.sciencemag.org/content/3/7/e1700782
3
Jambeck, J., Geyer, R., Wilcox, C., Siegler, T., Perryman, M, Andrady, A., Narayan, R., Law, K. 2015. Plastic waste
inputs from land into the ocean. Science. 347. 6223.
https://science.sciencemag.org/content/347/6223/768
4
McIlgorm, A., Raubenheimer, K., McIlgorm, D. 2020. Update of 2009 APEC report on Economic Costs of Marine
Debris to APEC Economies. A report to the APEC Ocean and Fisheries Working Group by the Australian National
Centre for Ocean Resources and Security (ANCORS), University of Wollongong. https://www.apec.org/Publica-
tions/2020/03/Update-of-2009-APEC-Report-on-Economic-Costs-of-Marine-Debris-to-APEC-Economies22 CLOSING THE LOOP ON PLASTIC POLLUTION IN DA NANG CITY, VIETNAM | CHAPTER 1 INTRODUCTION 23
1.2 Aims
Closing the Loop: Scaling up Innovation to Tackle Marine Plastic Pollution in Cities, a As shown in Figure 2, the project also builds local capacity and technical expertise,
project by the United Nations Economic and Social Commission for Asia and the Pacific supporting city governments and their partners to monitor and visualise plastic waste
(ESCAP) with support from the Government of Japan, aims to reduce the environmental and identify hotspots to improve management. It raises awareness of marine litter and
impact of cities in the ASEAN region by addressing marine plastic pollution. the solutions cities are taking to improve plastic value chain management, promote
behavioural change among consumers and industry and create enabling environments
In line with the ASEAN Framework of Action on Marine Debris, the G20 Osaka Blue Vision
for policy development.
and national policies and action plans, this project assists four cities: Da Nang, Viet
Nam; Kuala Lumpur, Malaysia; Surabaya, Indonesia and Nakhon Si Thammarat, Thailand
(Figure 1). These cities develop action plans to make plastic waste management more
circular and reduce plastic waste entering the marine environment from land-based
sources.
Baseline Status Reports Digital Mapping Tool City Action Plans
• Review policy and institu- • Data review • Define the action planning
tional environment scope and stakeholders.
• Design digital tool
• Capacity assessment of architecture and platform • Identify policy intervention
cities (e.g. waste manage- areas based on scientific
ment services and digital • Map marine plastic evidence
readiness) hotspots in 4 cities and
Da Nang, Viet Nam catchment areas • Develop local action plans
• Develop a plastic waste and investment strategies
flow using the PPC tool • Train, use, and apply the
digital tool
• Develop a plastic waste
flow model using the Plas-
Nakhon Si Thammarat, tic Pollution Calculator tool
Thailand
Kuala Lumpur, Malaysia Figure 2
Three elements to Circular Plastic Waste Management
Surabaya, Indonesia
Figure 1
Closing the Loop Project Pilot Cities24 CLOSING THE LOOP ON PLASTIC POLLUTION IN DA NANG CITY, VIETNAM | CHAPTER 1 25
1.3 Methodology
This baseline report presents and analyses the current plastic waste management
system in Da Nang City. Considering the importance of addressing both the physical
(hardware) components and the governance (software) features5 for sustainable waste
management, it covers data related to both aspects as shown in Figure 3. The structure
of the report consists of five sections; (1) introduction, (2) city profile, (3) physical assess-
ment (4) governance assessment, and (5) recommendations and conclusions.
Physical Assessment Governance Assessment
• Assessing plastic waste generation, • Evaluation of city and national
collection, recycling and treatment. policies related to plastic waste
management.
• Using the Plastic Pollution Calculator
(PPC) developed by the University of • Assessment of stakeholder
participation, financial sustainability To analyse the components identified above, a local partner (IUCN) was first designated
Leeds and ISWA the City quantifies
plastic pollution. and digital readiness for managing and a local research team has been established with members who are familiar with local
plastic waste in the city. situation. They functioned both as a leading researcher and as a coordinator who consult
with and collect information from the city authorities and key stakeholders. The following
data collection methods have been used.
Figure 3
Data collection
Desk Research
A desk review includes collecting secondary information and data from existing resourc-
es. Here, relevant data and information were collected from open sources, the govern-
ment published data and other reports from stakeholders.
5
Scheinberg, Anne, 2004, Integrated Sustainable Waste Management-the Concept, WASTE, the Netherlands26 CLOSING THE LOOP ON PLASTIC POLLUTION IN DA NANG CITY, VIETNAM | CHAPTER 1 INTRODUCTION 27
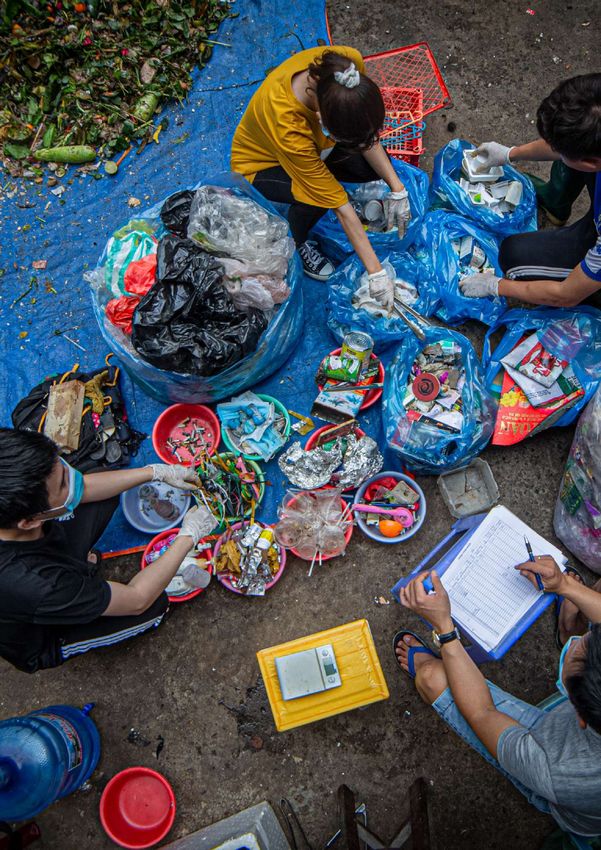
Field Surveys and Observations
A field survey including observations was carried out to understand the current situation
and challenges for MSW management and plastic waste management in the city. Due to
the lack of secondary data on plastic waste generation, a field sampling survey was con-
ducted from October to November 2021. The field survey collected primary data from
different sources such as households (multi- and single-family dwellings), rural areas,
public areas, commercial areas, institutional areas, formal waste transfer stations, recy-
cling activities, and at disposals sites. Table 1 summarises the number and category of
sectors selected for the sample survey. First, solid waste was collected randomly in front
of the houses before waste collection. Each sample was then labelled and transferred
by cart to the gathering point. For other waste sources, waste was collected and trans-
ferred by cart or truck. Due to a large amount of waste from the markets, the coning and
quartering method was used to reduce the sample size to about 200 kg for sorting. The
coordinates of the samples are recorded for positioning on the map. The waste compo-
sition is illustrated in Table 2.
Waste sources Sub-waste sources Number of samples Remarks Waste component Description
1 Household Small size 30 Single floor 1 Organic waste Food waste, kitchen waste
Middle size 30 2 floors 2 Garden waste Leaves, flowers
Big size 30 > 2 floors 3 Paper and Cardboard All kinds of paper and Cardboard
2 Food (Restaurants) 3 4 Metals All kinds of metal
Drink 3 5 Glass All kinds of glass
Accommodation 3 6 Plastics The detail in Table 3
3 Commercial Traditional market 2 7 Textiles All kinds of textle
sectors 8 Covid-related Mark, protect clothes
4 Institutional Schools 3 9 Other Rubber, leather, wood, ceramic,…
sectors People's Committee 3
office Table 2
5 Informal Itinerant buyer2 3 The main composition of waste
collected waste Waste pickers 3
Table 1
The waste sources of sampling survey28 CLOSING THE LOOP ON PLASTIC POLLUTION IN DA NANG CITY, VIETNAM | CHAPTER 1 INTRODUCTION 29
Interviews
After sorting the main components of waste, the composition of the types of plastic An open-ended questionnaire was also used to gather information from the key stake-
waste was identified and measured under 12 components based on the PPC as summa- holders including managers of URENCO, the staffs of local environmental departments
rized in Table 3. about the municipal waste management system and current waste management prac-
tice at sources. Both formal (03) and informal private sectors (03) dealing in plastic waste,
Waste component Description and NGOs that conduct awareness raising activities and skill-up trainings to promote
1 Plastic bags Carrier bags, refuse bags, dog poo bags, dry cleaner bags 3Rs of plastic waste were also included.
2 Sanitary products Plastic cotton buds, wet wipes, nappies (diapers), feminine hy-
giene products, etc.
3 Other plastic films Film packing, film lids, crisp packets, sweet wrappers, cling film,
Mapping method
bubble wrap, shrink wrap, newspaper sleeves, cereal box liners,
bread bags, plastic sheeting, sachets, pouch
The distribution of residents along the water body and the coast by the distance was
4 PET bottles Bottles made of PET: e.g. typically water bottles, soda bottles,
described in the cadastral map of Da Nang city.
clear, Soap bottles, clear spray bottles. Note this should include
the bottle, Cap when attached.
5 Other non-PET bottles Typically HDPE but maybe other polymers. Milk bottles, shampoo
bottles, household cleaning bottles, multi-use drink bottles. Note
this should include the bottle cap when attached.
6 Pots, tubs & trays Dense plastic food packaging including meat trays, margarine
tubs, yoghurt pots, salad trays, cookie trays, etc.
7 Expanded Polystyrene EPS cups, plates, takeaway containers (clamshells), packaging
insulation.
8 Single-use foodservice Straw, disposable plastic cutlery, coffee stirrers, disposable cups,
coffee lids.
9 Cigarette butts Cigarette butts
10 Other small dense items Small non-food packaging: toothpaste tubes, blister packaging
(all dimensions ≤20 cm) etc.
Small non-packaging items: stationery, lighters, combs, plastic
spools, small toys, tape dispensers, etc.
11 Other large dense items (at Buckets, pipes, plastic chairs, storage containers, crates, large
least one dimension >20 cm) plant pots etc.
12 Covid related PPE Plastic face masks, plastic gloves, plastic gowns
Table 3
Plastic composition30 CLOSING THE LOOP ON PLASTIC POLLUTION IN DA NANG CITY, VIETNAM | CHAPTER 1 INTRODUCTION 31
1.3.1 Plastic Pollution Calculator (PPC) Tool
Material Flow Analysis Approach
The study applied the Plastic Pollution Calculator6, an international waste modelling
methodology developed by the International Solid Waste Association (ISWA) and the
University of Leeds, at a district level. It uses a comprehensive Material Flow Analysis
(MFA) approach to quantify plastic pollution sources, sinks and pathways (Figure 4).
This method integrates the many different factors controlling plastic pollution, including
waste composition, topography, infrastructure quality, local socio-economic conditions,
climate and waste management practices. A digital elevation model and flow routing
algorithm are then applied to map the pathways that plastic waste enters the environ-
ment, including modelling surface runoff and entry points.
Calculation of Plastic Emissions into the Environment
As shown in Figure 4, all major components of the solid waste management system
are modelled so that the plastic item flows are balanced across each process. Acknowl-
edging the challenge in calculating plastic waste emissions to the environment due
to variations in time and space/location, the PPC uses conceptual models to relate all
factors important in estimating plastic emissions based on available data and expert
opinion. The relationships are assigned a number to estimate the quantitative influence
based on available data and expert opinion and are converted to mathematical algo-
rithms. Input data on waste management infrastructure, practices and other influencing
factors are then combined to estimate the likely amount of plastic waste emitted into
the environment. The transfer coefficients, an ability to be moved by wind or surface
runoff, probability of collection for recycling, and likelihood or becoming entangled in
vegetation once released in the environment, are also calculated for each plastic item
type within the MFA.
Figure 4
6
https://plasticpollution.leeds.ac.uk/wp-content/uploads/sites/89/2020/07/Plastic-Pollution-Calculator-Summa-
ry.pdf Material Flow Conceptual Framework of the Plastic Pollution Calculator (PPC)32 INTRODUCTION 33
Limitations of the PPC
The PPC functions by performing the MFA Similarly, even when data was available,
to map plastic waste flows across each reliability was occasional lacking leading to
district in the City, with emissions of plastic potential irregularities in the results. For
waste determined by analysing the waste example, the waste generated by house-
management infrastructure, practices, holds was calculated to be significantly
and linking it to the PPC conceptual mod- lower than the total waste arriving at the
els. However, this approach relies on suffi- landfill. Whilst this is possible, it is thought
cient reliable data available to perform the that potential inconsistencies between the
MFA. For the case of Da Nang City, some literature data used for household waste
input data was not directly available and generation rates and the official data of
as such had to either assumed using prox- waste arriving at landfill may lead to this
Spatial Distribution of Plastic Emissions and Leakage ies or estimated using expert opinion from difference being exaggerated. Whilst it
the local teams guided by University of would have been preferable not to use
The PPC is applied at sub-city-district or Each of these five grids are ultimately over- Leeds. Examples of input data that proved literature data for the household waste
neighborhood level assuming that lowest laid to provide an overall spatial represen- particularly difficult to obtain included generation rates, and instead use the waste
administrate areas have relatively homo- tation (hotspot map) of plastic emissions understanding the amounts of littering, characterisation study performed here,
geneous features for key plastic waste at the sub-district level. The PPC also iden- dumping and open burning present. this was not possible due to Covid-19 re-
emission factors (e.g. waste manage- tifies the important factors influencing the strictions. These restrictions meant house-
ment infrastructure, socio-economic and likelihood of a plastic item being trans- hold surveys could not be undertaken
geographical characteristics). This allows ported in the environment (e.g. distance to ascertain household size, and therefore
a reasonably accurate picture of plastic to waterways, meteorological conditions, per capita generation.
flows across a whole city or region (also and the geographical and built landscape).
accounting for any transboundary flows). A conceptual model is created to estimate
However, districts or neighborhoods are plastic emissions entering waterways by
even not entirely homogenous, thus, the assigning a relative weighting to each fac-
PPC estimates the spatial distribution tor depending on its perceived influence
of plastic emissions within a district by and relationship with other variables. The
allocating each emission source to one PPC uses a digital elevation model (DEM)
of five grids, including Residential activity and flow routing algorithms to map the
grid (e.g. population density), Non-res- routes that plastic waste emitted into the
idential activity grid (e.g. shops, tourist environment would travel due to surface
sites, parks), All activity grid (e.g. combined runoff and the locations where plastic
residential and non-residential activi- released into the environment may even-
ties), Roads grid and Waste infrastructure tually reach waterways and the ocean.
grid (e.g. dumpsites, transfer stations).34 CLOSING THE LOOP ON PLASTIC POLLUTION IN DA NANG CITY, VIETNAM | CHAPTER 1 INTRODUCTION 35
1.3.2 A Review of Governance Aspects
Other limitations of the study revolve around the assumption that the waste manage- One of the major reasons to the failure of solid waste management in the cites is poor
ment within a district is homogeneous. This is required in order to simply describe governance due to lack of the following: 1) existing solid waste management policies
the waste management system. Although efforts have been made to account for any and regulations; 2) financial capacity to introduce new SWM technology/ infrastructure;
differences in waste management by allowing this to be specified for each land use, some 3) appropriate institutions and capacities; 4) the development of private sector and recy-
variance is still likely. For example, compactor trucks were reported as the main method cling industries; 5) finance and cost recovery systems; 6) strategic planning/ directions,
used to collect waste from households, however, it is also known that in some hard to looking at waste management as an end-of-pipe issue; 7) political will; and 8) stakehold-
access areas, auto-rickshaws may be used instead. Within this study, only the dominant er participation and partnership7. This is not exceptional for plastic waste management
waste management practice is assigned. Similarly, behavioural practices such as dump- in developing cities. In examining governance aspects, we focused on proactive policies
ing of waste in rivers is known to be highly spatially dependent. Within the PPC however, and sound institutions, stakeholder participation and inclusivity, financial sustainability,
probabilities of direct dumping to water are assigned based on the average distance of and the digital readiness8.
the population within that district to waterways, and therefore does not account for the
specific locations within the district which may lack waste collection services.
Lastly, whilst the provided interventions are linked to the plastic pollution source, items,
pathways and sinks in Da Nang, we were unable to assign an estimated impact of these
interventions due to sensitivity analysis being required in order to account for the com-
plex relationship that upstream and downstream interventions may show, and which
was out of scope for this project.
7
Marshall and Farahbakhsh 2013; McDougall et al. 2001; Premakumara and Maeda 2014
8
Wilson et, al, 201536 CLOSING THE LOOP ON PLASTIC POLLUTION IN DA NANG CITY, VIETNAM | CHAPTER 1 INTRODUCTION 37
Proactive Policies and Sound Institutions Digital Readiness
Are there adequate national and local policies, legal frameworks, and enforce- How is Da Nang City applying new digital technologies to enhance waste gover-
ment mechanisms to tackle plastic pollution in Da Nang City? nance and citizen engagement?
Strong policies and sound institutions are key to a sustainable plastic waste manage- Having an appropriate digital system in the cities opens new ways to prevent, reduce and
ment system. Without them, plastic waste management systems will not work well over even eliminate waste from specific sectors and streams, to advance resource recovery,
the long term. to achieve high standards of treatment and disposal, to substantially reduce pollution
and environmental impacts. At the same time, it provides new tools to stimulate stake-
holders’ interaction, awareness and citizens’ participation, to apply the “polluter pays”
and the “extended producer responsibility” principle towards smart cities.
Stakeholder Participation and Inclusivity
How are local stakeholders involved in the plastic waste value chain in Da Nang
City, and to what degree are they included in policy planning implementation
and evaluation?
Even though the municipal governments are responsible for managing solid waste,
they cannot provide effective service in isolation. Sustainable plastic waste management
systems need to incorporate all key stakeholders in planning, implementing, and
monitoring the changes, particularly three main groups of stakeholders: the service
providers, including both formal and informal sectors; the users, who are the clients of
the supplied service; and the external agents in the enabling environment, including
national and local government, who organize the boundary conditions and make change
possible.
Financial Sustainability
Are city waste management services adequately resourced, including ensuring
cost recovery and long-term financial planning?
Securing financial sustainability in solid waste management is a major concern for cities.
In developing cities, solid waste management in general represents a significant propor-
tion of their total recurrent budget. In spite of relatively high costs, collection coverage
is often low and disposal standards remain poor.38 CLOSING THE LOOP ON PLASTIC POLLUTION IN DA NANG CITY, VIETNAM | CHAPTER 1 INTRODUCTION 39
1.4 Study Area 1.5 Project Coordination Team
Noting that plastic leakage into waterways is a transboundary issue it is necessary to Organisational Structure for the Project Coordination
understand leakage across administrative boundaries. For the purposes of determining
plastic leakage from land-based sources within Da Nang City, this study determined to
analyse the issue of plastic leakage within the following 7 districts of Da Nang City with
make up the Study Area including: Hai Chau, Cam Le, Son Tra, Thanh Khe, Ngu Hanh Son,
Lien Chieu and Hoa Vang. In this Baseline Report, the Study Area will also be referred to
as “Da Nang City” or simply, “the City”.
1.6 Data verification
The study also organised a stakeholder workshop on 1st March 2021 inviting experts
representing officials, academic, and other civil society groups to discuss and verify the
data and key findings of the baseline report.CHAPTER 2
40 41
CLOSING THE LOOP ON PLASTIC POLLUTION
IN DA NANG CITY, VIETNAM
City Profile
P42
Population
P43
Environment
P44
Economy42 CLOSING THE LOOP ON PLASTIC POLLUTION IN DA NANG CITY, VIETNAM | CHAPTER 2 43
CHAPTER 2
City Profile
2.1 Population
Da Nang City is the largest urban center and the economic hub in the central part of
Viet Nam. It has a total land area of 1,285 sq.km9, located on the Coast of Eastern Sea at
the mouth of the Han River. Da Nang City is a dynamic port with approximately 90km of
coastline. The total population of Da Nang City was approximately 1.14 million people in
2019, increasing 2.4% since 2018. 87.2% of the population live in the urban districts and
12.8% in the rural district. The average population density in Da Nang City is 1,165 peo-
ple/km2, which is lower than Ho Chi Minh (4,363 people/km2) and Ha Noi (2,398 people/
km2).
2.2 Environment
Da Nang City consists of both a coastal plain and mountainous lands. The high and
steep mountainous area concentrates in the West and Northwest part of the city with
a height of about 700 - 1,500 m. The East and Southeast part of the city covers the low
plains bordering to the East Sea, where most urban activities are concentrated.
In Da Nang City, all seven districts are contiguous with the riverbanks or the coastlines.
Even though the natural area is limited, the river network is quite spread and join the
downstream of Vu Gia – Thu Bon River. The river system is short and slightly steep,
flowing from the Northwest to the sea with three main branches, namely Han, Tuy
Loan and Cu De rivers. The local natural conditions have brought advantages for local
socio-economic development. According to the Department of Natural Resource and
Environment (DONRE), more than 30% of the population in each district has occupied
within 500m from the waterways or the coast, in which Son Tra and Ngu Hanh Son
account for the percentages of 60.8% and 48.1%, respectively. This indicates the
advantages of nature to the lives and livelihoods of local communities, namely the
development of tourism activities, economic trade in the vicinity. Undeniably, this also
9
DONRE. 2019. Report of Environmental Situation of Da Nang in 2019 – Theme: “SWM” brings potential risks of water and ocean pollution from municipal solid waste.44 CLOSING THE LOOP ON PLASTIC POLLUTION IN DA NANG CITY, VIETNAM | CHAPTER 2 CITY PROFILE 45
2.3 Economy
Over the past decade, Da Nang City has recorded remarkable progress in achieving Taking advantages of strategic location, economic incentives and growing workforce,
economic development with an average annual GDP growth rate of 10%. The City Da Nang City has attracted substantial foreign investment projects in the past years. In
is expected to account for 2.8% of the national GDP and is estimated to reach a per 2020, the City granted 14 investment licenses to foreign investment projects with the
capita GDP of US $4,500 – 5,000 at the end of 202010. Da Nang City’s economy historically total committed capital of more than US$1.68 million, mainly in the fields of food, ser-
has been dominated by the industrial and construction sectors. However, this has now vices, information technology and foreign language training13. The City is also expecting
transitioned towards the trade and service sectors, accounting for 56.17% in 201811. domestic and foreign investment in 57 key projects by 2025. These projects included
The tourism sector reached a remarkable growth rate of 13.4% in 2019 though COVID-19 education, healthcare, tourism-services-commerce, culture and sports, information
greatly impacted this in 202012. The tourism activities primarily concentrate on Son Tra, technology-industrial infrastructure, high-tech industry, environmental improvement,
Ngu Hanh Son and Thanh Khe districts along the river and coastline. Hai Chau district transport-infrastructure-logistics and high-tech agriculture.
is the administrative center, Lien Chieu and Cam Le districts focus more on developing
According to the land-use, the industrial zones are concentrated along the North-West
industrial activities. Hoa Vang is the main agricultural area of the City.
bay and the eastern bank of the Han River. The business districts and high-density
residential zones can be found on the western bank. The increase of urbanization and
the rapid development of the tourism industry have increased the risks of solid waste,
including plastics, being released into the waterways. Therefore, it is essential to assess
the pollution hotspots, the capacity of the local MSW management system and evalu-
ates the risk of plastic leakage from source-to-sea in Da Nang. These assessments will
provide inputs to identify practical actions for reducing the leakage of plastic waste into
the sea and protect the marine environment.
10
Da Nang government. 2019. Statistical Year-Book of Da Nang city.
11
DONRE. 2019. Report of Environmental Situation of Da Nang in 2019 – Theme: “SWM”
12
VGP News - Online Newspaper of the Government, December 2019
http://news.chinhphu.vn/Home/Da-Nang-strives-to-welcome-98-million-tourists-next-year/201912/38381.vgp
VGP News - Online Newspaper of the Government, February 2020
13
http://news.chinhphu.vn/Home/Da-Nang-licenses-14-foreigninvested-projects-in-January/20202/38688.vgpCHAPTER 3
46 47
CLOSING THE LOOP ON PLASTIC POLLUTION
IN DA NANG CITY, VIETNAM
Status of Plastic Waste
Management, Leakage and
Hotspots
P48
Municipal Solid Waste (MSW) Generation
MSW Generation by District
MSW Generation by Source Activity
P54
Plastic Waste Generation and Composition
P57
Plastic Emissions to the Environment
Key Sources of Plastic Pollution
Composition of Plastic Emissions to the Environment
Plastic Emissions with Time
Spatial Distribution of Plastic Pollution Emissions
P68
River and Marine Plastic Pathways
Key Pathways of River and Marine Plastic
Pathways of River and Marine Plastic with Time
P71
Fate of Plastic Waste
Plastic Recycling
Retained at Disposal Site
Openly Burnt
Retained on Land and Drains
River and Marine Plastic Pollution48 CLOSING THE LOOP ON PLASTIC POLLUTION IN DA NANG CITY, VIETNAM | CHAPTER 3 STATUS OF PLASTIC WASTE MANAGEMENT, LEAKAGE AND HOTSPOTS 49
CHAPTER 3
Status of Plastic Waste
450
400
Management, Leakage
350
Voume of MSW (Mt)
300
and Hotspots
250
200
150
100
3.1 Municipal Solid Waste (MSW) 50
Generation 0
2016 2017 2018 2019 2020
Figure 5
Volume of Municipal Solid Waste generated per year in Da Nang City
Municipal waste generation in Da Nang City has been steadily increasing alongside
strong economic development. The average municipal solid waste (MSW) generation
rate increased by 15-16% from 2016 to 202014. As of 2019, MSW generation in the City
was approximately 1,177 tonnes per day, yet dropped 8% to 1,078 tonnes per day in In total 449,000 tonnes of municipal solid waste (MSW) is generated in Da Nang each
2020 due to the impacts of COVID-19. Based on a regular development forecast, the City year. Only by accounting for all this waste can we accurately map the waste flows. With
will generate 1,794 tonnes per day by 2030 and 2,450 tonnes per day by 2045. While a residential population of just over one million people, this equates to an average
waste management collection, transport and treatment services have improved to cover waste generation rate of 1.08 kg per person per day. These waste generation rates are
an average of 95% of waste generated in Da Nang City in the last five years, it is still not calculated to account for all sources of waste, including those which are typically not
enough to solve their plastic pollution problem. measured (e.g. litter that goes uncollected). This figure is substantially higher than
values for the country as a whole, with the World Bank What a Waste 2.0 report suggest-
ing a 2016 waste generation rate of 0.33 kg/capita/day15. However, large urban cities are
known to have higher waste generation rates, with comparable waste generation rates
found in Ho Chi Minh and Hanoi16,17.
15
KAZA, S., L. YAO, P. BHADA-TATA and F.V. WOERDEN. What a Waste 2.0: A Global Snapshot of Solid Waste
Management to 2050. Urban Development Series, Washington, DC: World Bank, 2018
16
VERMA, R.L., G. BORONGAN and M. MEMON. Municipal Solid Waste Management in Ho Chi Minh City, Viet
Nam, Current Practices and Future Recommendation. Procedia Environmental Sciences, 2016, 35, pp.127-139.
17
TSAI, F.M., T.-D. BUI, M.-L. TSENG and K.-J. WU. A causal municipal solid waste management model for sus-
Da Nang Department of Natural Resources and Environment (DONRE), 2021. The current state of environ-
14
tainable cities in Vietnam under uncertainty: A comparison. Resources, Conservation and Recycling, 2020, 154,
ment in Da Nang city in the period 2016 - 2020. p.104599.50 CLOSING THE LOOP ON PLASTIC POLLUTION IN DA NANG CITY, VIETNAM | CHAPTER 3 STATUS OF PLASTIC WASTE MANAGEMENT, LEAKAGE AND HOTSPOTS 51
3.1.1 MSW Generation by District 3.1.2 MSW Generation by Source Activity
MSW generation across the districts within the study area of Da Nang is spatially diverse, The MSW generating activities that produce this waste can be thought of broadly as res-
with the more urban district generating higher quantities of MSW than the larger Hòa idential waste, commercial waste, institutional waste (e.g. schools, healthcare and public
Vang rural district. Of the urban districts, Hải Châu, Thanh Khê, Sơn Trà and Liên Chiểu administration) and other waste (e.g. street sweepings, litter that remains uncollected,
generate the most amount of MSW. This outcome results from having larger popula- flushing of sanitary waste, recyclables sold directly to the informal sector etc.). Figure 7
tions combined with higher waste generation rates as seen in Figure 6. shows that residential waste accounts for 46% of MSW generation, with a further 39%
of MSW being generated by commercial activities. Institutional establishments produce
about 5% of waste, whilst the remaining 10% of waste originates from other activities.
For comparison, we also reviews the result of the solid waste management project in
Thanh Khe district (an urban district of Da Nang city) funded by WWF18. According to this
sample study, the MSW generation by source is as shown in Figure 8: households (50%),
business sectors (20%), markets (12%), institutions (12%) and, others (6%). It has been
found out that the waste generation from residential sector is relatively low in the PPC
result. There may involve counting issue between residential and commercial waste as
most common form of housing in Da Nang City is combination of shops at the ground
floor and houses at the upper floors19.
Figure 6
MSW generation within the study area Figure 7
MSW generated by sectors in Thanh Khe district
18
The City of Da Nang, Vietnam joined WWF's Plastic Smart Cities (https://plasticsmartcities.org/blogs/media/
vietnam-now-counts-three-plastic-smart-cities-commitments)
19
VETTER-GINDELE, J., A. BRAUN, G. WARTH, T.T.Q. BUI, F. BACHOFER and L.J.R. ELTROP. Assessment of House-
hold Solid Waste Generation and Composition by Building Type in Da Nang, Vietnam. 2019, 8(4), p.171.You can also read


