Clinico-biological features of T-cell acute lymphoblastic leukemia with fusion proteins

Page created by Danny Peterson
 
CONTINUE READING
Clinico-biological features of T-cell acute lymphoblastic leukemia with fusion proteins
Blood Cancer Journal                                                                                                                                  www.nature.com/bcj

                  ARTICLE                  OPEN

                  Clinico-biological features of T-cell acute lymphoblastic
                  leukemia with fusion proteins
                  Thomas Steimlé1,18, Marie-Emilie Dourthe1,2,18, Marion Alcantara 1,2,3, Aurore Touzart1, Mathieu Simonin1,2,3,4,5, Johanna Mondesir1,
                  Ludovic Lhermitte 1, Jonathan Bond6, Carlos Graux7, Nathalie Grardel8, Jean-Michel Cayuela9, Isabelle Arnoux10,
                  Virginie Gandemer11, Marie Balsat12, Norbert Vey 13, Elizabeth Macintyre 1, Norbert Ifrah14, Hervé Dombret15, Arnaud Petit 4,5,
                                                                                                   ✉
                  André Baruchel2,15, Philippe Ruminy16, Nicolas Boissel15,16,17 and Vahid Asnafi 1

                  © The Author(s) 2022

                      T-cell acute lymphoblastic leukemias (T-ALL) represent 15% of pediatric and 25% of adult ALL. Since they have a particularly poor
                      outcome in relapsed/refractory cases, identifying prognosis factors at diagnosis is crucial to adapting treatment for high-risk
                      patients. Unlike acute myeloid leukemia and BCP ALL, chromosomal rearrangements leading to chimeric fusion-proteins with
                      strong prognosis impact are sparsely reported in T-ALL. To address this issue an RT-MPLA assay was applied to a consecutive series
                      of 522 adult and pediatric T-ALLs and identified a fusion transcript in 20% of cases. PICALM-MLLT10 (4%, n = 23), NUP214-ABL1 (3%,
                      n = 19) and SET-NUP214 (3%, n = 18) were the most frequent. The clinico-biological characteristics linked to fusion transcripts in a
1234567890();,:

                      subset of 235 patients (138 adults in the GRAALL2003/05 trials and 97 children from the FRALLE2000 trial) were analyzed to identify
                      their prognosis impact. Patients with HOXA trans-deregulated T-ALLs with MLLT10, KMT2A and SET fusion transcripts (17%, 39/235)
                      had a worse prognosis with a 5-year EFS of 35.7% vs 63.7% (HR = 1.63; p = 0.04) and a trend for a higher cumulative incidence of
                      relapse (5-year CIR = 45.7% vs 25.2%, HR = 1.6; p = 0.11). Fusion transcripts status in T-ALL can be robustly identified by RT-MLPA,
                      facilitating risk adapted treatment strategies for high-risk patients.

                      Blood Cancer Journal (2022)12:14 ; https://doi.org/10.1038/s41408-022-00613-9

                  INTRODUCTION                                                                               the abnormal expression of specific transcription factors (TF)
                  T-cell acute lymphoblastic leukemia (T-ALL) is an aggressive                               (TAL1; LMO1/2; TLX1/3; LYL1; HOXA; MEF2C) and their blocked
                  hematological cancer arising from the transformation of T cell                             differentiation at specific stages of maturation [1, 7, 8]. Aberrant TF
                  precursors arrested at specific stages of differentiation [1, 2]. T-ALL                     expression can be due to their juxtaposition to T Cell Receptor
                  represent 15% of pediatric and 25% of adult ALL. Despite modern                            (TCR) loci or to somatic mutations in their enhancer regions. A
                  poly-chemotherapy protocols, followed by allogeneic hemato-                                number of additional, recurrent genetic abnormalities are found,
                  poietic stem cell transplantation (HSCT) in high-risk cases,                               including the loss of major tumor suppressive pathways (e.g.,
                  outcome of pediatric and adult patients with T-ALL remains poor,                           inactivating mutations of PTEN and of the CDKN2A tumor
                  particularly in primary refractory and relapsed cases. After a                             suppressor locus) and activation of oncogenic pathways (e.g.,
                  transient initial response, about 20–30% of pediatric [3–5] and                            activating mutations in NOTCH1/FBXW7, IL7R/JAK pathway,
                  40% of adult T-ALL patients relapse [6] with a 5-years overall                             epigenetic regulators, cell cycle, PI3K, and RAS signaling) [9–12].
                  survival (OS) below 20%. Understanding the mechanisms leading                              Acquisition and selection of these molecular alterations entails the
                  to treatment failure is therefore crucial to identify patients at high                     complex clonal evolution at the cellular level that occurs during
                  risk and adapt treatment in order to improve long term prognosis.                          T-ALL progression. Unlike acute myeloid leukemia (AML) and
                  Cytogenetic and global transcriptomic analyses led to the                                  B-Cell Precursor acute lymphoblastic leukemia (BCP-ALL), which
                  classification of T-ALL into molecular subgroups characterized by                           harbor numerous translocations leading to chimeric protein

                  1
                   Université de Paris (Descartes), Institut Necker-Enfants Malades (INEM), Institut national de la santé et de la recherche médicale (Inserm) U1151, and Laboratory of Onco-
                  Hematology, Assistance Publique-Hôpitaux de Paris, Hôpital Necker Enfants-Malades, Paris, France. 2Department of Pediatric Hematology and Immunology, Robert Debré
                  University Hospital (AP-HP), Université de Paris, Paris, France. 3Center for Cancer Immunotherapy, INSERM U932, Institut Curie, PSL Research University, Paris, France.
                  4
                   Department of Pediatric Hematology and Oncology, Assistance Publique-Hôpitaux de Paris (AP-HP), GH HUEP, Armand Trousseau Hospital, Paris, France. 5Sorbonne
                  Universités, UPMC Univ Paris 06, UMRS 938, CDR Saint-Antoine, GRC n°07, GRC MyPAC, Paris, France. 6Systems Biology Ireland, School of Medicine, University College Dublin,
                  Dublin, Ireland. 7Department of Hematology, Université catholique de Louvain, CHU UCL Namur - site Godinne, Yvoir, Belgium. 8Laboratory of Hematology, CHRU Lille, Lille,
                  France and U1172, INSERM, Lille, France. 9Laboratory of Hematology and EA 3518 University Hospital Saint-Louis, AP-HP and Université de Paris, Paris, France. 10Hematology
                  Laboratory, Marseille University Hospital Timone, Marseille, France. 11Department of Pediatric Hematology and Oncology, University Hospital of Rennes, Rennes, France.
                  12
                     Service d’hématologie clinique, Hôpital Lyon Sud, Marseille, France. 13Aix-Marseille Univ, Inserm, CNRS, Institut Paoli-Calmettes, CRCM, Marseille, France. 14PRES LUNAM, CHU
                  Angers service des Maladies du Sang et CRCINA INSERM, Angers, France. 15Institut de Recherche Saint-Louis, Université de Paris, EA-3518 Paris, France. 16Inserm U1245, Centre
                  Henri Becquerel, Université de Rouen, IRIB, Rouen, France. 17AP-HP, Hôpital Saint Louis, Unité d’Hématologie Adolescents et Jeunes Adultes, Paris, France. 18These authors
                  contributed equally: Thomas Steimlé, Marie-Emilie Dourthe. ✉email: vahid.asnafi@aphp.fr

                  Received: 2 September 2021 Revised: 1 January 2022 Accepted: 6 January 2022
Clinico-biological features of T-cell acute lymphoblastic leukemia with fusion proteins
T. Steimlé et al.
2
    fusions [13, 14] such abnormalities are more rarely reported in                 cause in first CR. Relapse and death in CR were considered as
    large series of T-ALLs [15–20]. Recurrent chimeric protein fusions              competitive events. Univariate analyses assessing the impact of
    in T-ALL include rearrangements of KMT2A (AFDN (AF6), MLLT1,                    categorical and continuous variables were performed with a Cox model.
    ELL), SET-NUP214, ABL1 (NUP214-ABL1, BCR-ABL1), MLLT10 (PICALM,                 Statistical analyses were performed with STATA software (STATA 12.0
    DDX3X, NAP1L1, XPO1), and the ETS family (SPI and ETV6). Given                  Corporation, College Station, TX) for survival and R software for others
                                                                                    (v4.0.2). All p values were two-sided, with p < 0.05 denoting statistical
    their individual low frequency, the clinico-biological features of              significance.
    T-ALLs harboring chimeric fusions within a comprehensive series
    remains elusive.
       To address this issue, we designed and developed an RT-MPLA                  RESULTS
    assay allowing identification of the majority of known fusion                    RT-MLPA detect an unexpected 20% incidence of fusion
    transcripts leading to chimeric proteins in T-ALLs. Applying this               proteins in T-ALLs
    panel to a comprehensive, consecutive series of 522 adult and                   A series of 522 T-ALL, all systematically screened for PICALM-
    pediatric T-ALLs, we here report an unexpected overall incidence                MLLT10, SET-NUP214, and NUP214-ABL1 by RT/qPCR, were
    of 20% of fusion transcript. Their mutational landscape, associated             evaluated for fusion transcripts by RT-MLPA. Fusion transcripts
    clinico-biological features and prognostic impact on patients                   were detected in 104/522 (20%) cases (Table 1, S3A, B), leading to
    enrolled in the French GRAALL protocol for adult patients and the               the identification of 99/104 fusion partners by pyrosequencing
    FRALLE 2000T protocol for pediatric patients are described.                     (Fig. 1A). Among the 5 unresolved cases 2 PICALM-MLLT10, 1
                                                                                    NUP214-ABL1 and 1 KMT2A-MLLT1 were identified by RT/qPCR.
                                                                                    Only one t(11;16) involving KMT2A identified by cytogenetics and
    METHODS                                                                         called “KMT2A-?” remained only partially identified. Importantly,
    T-ALL samples and clinical trials                                               among fusion transcripts systematically screened by RT/qPCR, no
    Diagnostic peripheral blood (PB) or bone marrow (BM) samples from a
    consecutive series of 522 T-ALL patients, with RNA available, 206 children      false negative or false positive RT-MLPA case was observed.
    and 316 adults, were screened for fusion transcripts (fig. S1). Sample
    collection and analyses were obtained with informed consent in                  Fusion transcripts are individually rare in T-ALL
    accordance with the Declaration of Helsinki with approval from the              Among identified transcripts PICALM-MLLT10 (4%, n = 23), (Fig. 1A, B),
    institutional review boards of institutions that participated in this study.    NUP214-ABL1 (3%, n = 19) and SET-NUP214 (3%, n = 18) were the
    Diagnosis of T-ALL was based on the World Health Organization 2008              most frequently detected. All others fusion transcripts were rare
    criteria revised in 2016, defined by expression of cytoplasmic and/or            (
T. Steimlé et al.
                                                                                                                                                                                                                                                                                                                                                                                                                                                                                                                                                                                                                                                                                           3
                                                                                                                                                                                                                                                                                                                                                                                                                                                                                                                                                                                                                     were TLX3 deregulated (p < 0.05), and a minority were TLX1

                                                                                                                                                                                                                                                                                                                                                                                                All means are compared against the Negative group with Wilcoxon test or Student test depending on the Shapiro test result. All proportions are compared against the Negative group with Pearson’s χ2 test or for
                                                                                                                                                                                                                                                                                                                                                                                                small values with the Fisher exact test. Results with p ≤ 0.05 are displayed in bold. Immature T-ALL are TCR- and cTCRβ-. αβ-lineage T-ALL are TCRαβ or preαβ (TCR-) but with cTCRβ+ . γδ-lineage T-ALL are TCRγδ.
                                                                                                                                                                                                                                                                                                                                                                                                                                                                                                                                                                                                                     deregulated [29]. This group harbored significantly more RAS

                                                                                                                                                                                                   39% (n = 206)

                                                                                                                                                                                                                                                  34% (n = 139)
                                                                                                                                                                                                                                                                  57% (n = 235)
                                                                                                                                                                                                                                                                                  21% (n = 109)

                                                                                                                                                                                                                                                                                                                                  30% (n = 155)

                                                                                                                                                                                                                                                                                                                                                                                47% (n = 244)
                                                                                                                                                                                                                                                                                                                                                  12% (n = 63)
                                                                                                                                                                                                                                                                                                                                                                 14% (n = 73)
                                                                                                                                                                                                                                   9% (n = 39)
                                                                                                                                                                                25.4 (1–78)
                                                                                                                                                                                                                                                                                                                                                                                                                                                                                                                                                                                                                     signaling genes mutations/deletions (50%, p < 0.01) (Table 2;
                                                                                                                                                                                                                                                                                                                                                                                                                                                                                                                                                                                                                     Fig. 2). Among the two BCR-ABL1 transcripts, both were p190, one
                                                                                                         522
                                                                                                         All

                                                                                                                                                                                                                                                                                                                                                                                                                                                                                                                                                                                                                     e6a2 and one e1a2.

                                                                                                                                                                                                                                                                                                                                                                                                                                                                                                                                                                                                                     ETS family recombinome
                                                                                                                                                                                                                                                                                                                                                                                                                                                                                                                                                                                                                     ETS fusion transcripts were detected only in 1% of T-ALLs, all of

                                                                                                                                                                                                   39% (n = 162)

                                                                                                                                                                                                                                                                  64% (n = 214)

                                                                                                                                                                                                                                                                                                                                                                                55% (n = 231)
                                                                                                                                                                                                                                                                                                                                                                                                                                                                                                                                                                                                                     which were pediatric cases, (Fig. 1D) with an incidence of 3% in

                                                                                                                                                                                                                                   10% (n = 34)
                                                                                                                                                                                                                                                  26% (n = 85)

                                                                                                                                                                                                                                                                                  20% (n = 85)

                                                                                                                                                                                                                                                                                                                                  20% (n = 82)
                                                                                                                                                                                                                                                                                                                                                  14% (n = 60)
                                                                                                                                                                                                                                                                                                                                                                 14% (n = 57)
                                                                                                                                                                                25.9 (1–78)
                                                                                                                                                                                                                                                                                                                                                                                                                                                                                                                                                                                                                     the pediatric cohort. They included ETV6-NCOA2 (n = 3), STMN1-
                                                                                                         Negative

                                                                                                                                                                                                                                                                                                                                                                                                                                                                                                                                                                                                                     SPI1 (n = 2), and TCF7-SPI1 (n = 1) transcripts. All SPI1 break-
                                                                                                                       80%
                                                                                                         418

                                                                                                                                                                                                                                                                                                                                                                                                                                                                                                                                                                                                                     points involved exon 3 [17] and all ETS domains were conserved
                                                                                                                                                                                                                                                                                                                                                                                                                                                                                                                                                                                                                     in the fusion transcripts. No specific phenotype or transcription
                                                                                                                                                                                                                                                                                                                                                                                                                                                                                                                                                                                                                     factor (HOXA9, TLX1 nor TLX3) overexpression was observed
                                                                                                                                                                                                                                                                                                                                                                                                                                                                                                                                                                                                                     within this subgroup (Table 1). Targeted sequencing identified
                                                                                                                                                                                                                                                                                                                                                                                                                                                                                                                                                                                                                     significantly more cell cycle gene mutations (33%, p = 0.03)
                                                                                                                                              NUP98-RAP1GDS1 (3)

                                                                                                                                                                                                                                                                                                                                                                                                                                                                                                                                                                                                                     (Fig. 2; Table 2).
                                                                                                                                              P2RY8-CRLF2 (1)
                                                                                                                    Other n = 5 (1%)

                                                                                                                                              PCM1-FLT3 (1)

                                                                                                                                                                                                                                                                                                                                                                                                                                                                                                                                                                                                                     Clinico-biological characteristics of fusion transcripts in
                                                                                                                                                                                                   60% (n = 3)

                                                                                                                                                                                                                                   33% (n = 1)
                                                                                                                                                                                                                                                  33% (n = 1)
                                                                                                                                                                                                                                                                  33% (n = 1)
                                                                                                                                                                                                                                                                                  40% (n = 2)

                                                                                                                                                                                                                                                                                                                                  60% (n = 3)

                                                                                                                                                                                                                                                                                                                                                                                40% (n = 2)
                                                                                                                                                                                18.8 (8–34)

                                                                                                                                                                                                                                                                                                                                                                                                                                                                                                                                                                                                                     GRAALL and FRALLE treated T-ALL
                                                                                                         Positive

                                                                                                                                                                                                                                                                                                                                                                                                                                                                                                                                                                                                                     We then investigated the clinico-biological characteristics linked
                                                                                                         104

                                                                                                                                                                                                                                                                                                                                                                                                                                                                                                                                                                                                                     to fusion transcripts in a subset of 235 patients, including 138
                                                                                                                                                                                                                                                                                                                                                    0
                                                                                                                                                                                                                                                                                                                                                                   0

                                                                                                                                                                                                                                                                                                                                                                                                                                                                                                                                                                                                                     adults enrolled in the GRAALL-2003/05 trials and 97 children
                                                                                                                                                                                                                                                                                                                                                                                                                                                                                                                                                                                                                     enrolled in the FRALLE-2000T trial. A fusion transcript was
                                                                                                                                                                                                                                                                                                                                                                                                                                                                                                                                                                                                                     observed in 27% of adults and 22% of children and the overall
                                                                                                                                                                                                                                                                                                                                                                                                                                                                                                                                                                                                                     incidence of fusion transcripts in these cohorts was 25% (58/235).
                                                                                                                                              ETV6-NCOA2 (3)
                                                                                                                                              STMN1-SPI1 (2)
                                                                                                                    ETS n = 6 (1%)

                                                                                                                                                                                                   100 % (n = 6)

                                                                                                                                                                                                                                                                                                                                                                                                                                                                                                                                                                                                                        The incidence of ABL1 fusion was 6% (15/235). Patient outcome
                                                                                                                                                                                                                                                                                                                                                                                100% (n = 6)
                                                                                                                                              TCF7-SPI1 (1)

                                                                                                                                                                                                                                                                  67 % (n = 2)
                                                                                                                                                                                                                                   33% (n = 1)

                                                                                                                                                                                                                                                                                  50% (n = 3)

                                                                                                                                                                                                                                                                                                                                                                                                                                                                                                                                                                                                                     in this group did not differ significantly from negative cases
                                                                                                                                                                                4.5 (1–8)

                                                                                                                                                                                                                                                                                                                                                                                                                                                                                                                                                                                                                     (Table 3). Despite lower CR rates (66.7%) at the end of induction
                                                                                                                                                                                                                                                                                                                                                                                                                                                                                                                                                                                                                     patients did not receive more frequent allogeneic HSCT and
                                                                                                                                                                                                                                                    0

                                                                                                                                                                                                                                                                                                                                    0
                                                                                                                                                                                                                                                                                                                                                    0
                                                                                                                                                                                                                                                                                                                                                                   0

                                                                                                                                                                                                                                                                                                                                                                                                                                                                                                                                                                                                                     prognosis was not significantly (Table S4) different, with only a
  Biological characteristics of T acute lymphoblastic leukemia according to fusion transcripts status.

                                                                                                                                                                                                                                                                                                                                                                                                                                                                                                                                                                                                                     trend for shorter 5-year EFS (40% vs 60.2%, HR = 1.81; 95%
                                                                                                                                                                                                                                                                                                                                                                                                                                                                                                                                                                                                                     CI [0.9–3.6]; p = 0.09) (Fig. 3).
                                                                                                                                                                                                                                                                                                                                                                                                                                                                                                                                                                                                                        The incidence of HOXA trans-deregulated T-ALL with identified
                                                                                                                                              NUP214-ABL1 (19)
                                                                                                                    ABL1 n = 22 (4%)

                                                                                                                                                                                                                                                                                                                                                                                                                                                                                                                                                                                                                     fusion transcripts was 17% (39/235) distributed as follows: MLLT10
                                                                                                                                              ETV6-ABL1 (1)

                                                                                                                                                                                                                                                                                                                                                                 73% (n = 16)

                                                                                                                                                                                                                                                                                                                                                                                                                                                                                                                                                                                                                     fusions in 20 patients (9%), KMT2A fusions in 11 patients (5%), SET
                                                                                                                                              BCR-ABL1 (2)

                                                                                                                                                                                                   55% (n = 12)

                                                                                                                                                                                                                                                                  67% (n = 10)

                                                                                                                                                                                                                                                                                                                                                                                14% (n = 3)
                                                                                                                                                                                                                                                  27% (n = 4)

                                                                                                                                                                                                                                                                                  32% (n = 7)

                                                                                                                                                                                                                                                                                                                                                  14% (n = 3)
                                                                                                                                                                                23.1 (4–61)

                                                                                                                                                                                                                                   7% (n = 1)

                                                                                                                                                                                                                                                                                                                                  5% (n = 1)

                                                                                                                                                                                                                                                                                                                                                                                                                                                                                                                                                                                                                     fusions in 8 patients (3%). Compared to the negative group,
                                                                                                                                                                                                                                                                                                                                                                                                                                                                                                                                                                                                                     patients with one of these 3 fusion transcripts were older with
                                                                                                                                                                                                                                                                                                                                                                                                                                                                                                                                                                                                                     lower white blood cell counts (WBC). Overall, these patients have
                                                                                                                                                                                                                                                                                                                                                                                                                                                                                                                                                                                                                     worse prognosis with a 5-year EFS of 35.7% vs 63.7% (HR = 1.63;
                                                                                                                                                                                                                                                                                                                                                                                                                                                                                                                                                                                                                     95% CI [1.02–2.6]; p = 0.04) and a trend for higher CIR (5-year
                                                                                                                                                                                                                                                                                                                                                                                                                                                                                                                                                                                                                     CIR = 45.7% vs 25.2%, HR = 1.6; 95% CI [0.9–2.9]; p = 0.11) (Fig.
                                                                                                                                                                                                                                                                                                                                                                                                                                                                                                                                                                                                                     S3). However, 5-year OS was not significantly different (59.3% vs
                                                                                                                    KMT2A/SET n = 34 (7%)

                                                                                                                                                                                                                                                                                                                                                                                                                                                                                                                                                                                                                     71.4%, HR1.26; 95% CI [0.7–2.2]; p = 0.43). This outcome cannot be
                                                                                                                                              KMT2A-AFDN (10)
                                                                                                                                              KMT2A-MLLT1 (4)

                                                                                                                                                                                                                                                                                                                                                                                                                                                                                                                                                                                                                     explained by a significantly increased rate of allogeneic HSCT in
                                                                                                                                              SET-NUP214 (18)

                                                                                                                                                                                                                                                                                                                                  100% (n = 34)
                                                                                                                                              KMT2A-ELL (1)

                                                                                                                                                                                                                                                                                                                                                                                                                                                                                                                                                                                                                     this subgroup (36.1% vs 26.3%, p = 0.23).
                                                                                                                                                                                                                                                  81% (n = 22)
                                                                                                                                                                                                                                                                  15% (n = 4)
                                                                                                                                              KMT2A-? (1)

                                                                                                                                                                                                   24% (n = 8)

                                                                                                                                                                                                                                                                                  21% (n = 7)
                                                                                                                                                                                27.9 (8–63)

                                                                                                                                                                                                                                   4% (n = 1)

                                                                                                                                                                                                                                                                                                                                                                                                                                                                                                                                                                                                                        When comparing each of these three fusions groups with their
                                                                                                                                                                                                                                                                                                                                                                                                                                                                                                                                                                                                                     respective negative group, different patterns of treatment
                                                                                                                                                                                                                                                                                                                                                                                                                                                                                                                                                                                                                     response and prognosis were identified. KMT2A fusions have no
                                                                                                                                                                                                                                                                                                                                                    0
                                                                                                                                                                                                                                                                                                                                                                   0
                                                                                                                                                                                                                                                                                                                                                                                  0

                                                                                                                                                                                                                                                                                                                                                                                                                                                                                                                                                                                                                     impact on treatment response and prognosis. On the contrary,
                                                                                                                                                                                                                                                                                                                                                                                                                                                                                                                                                                                                                     patients with SET fusions were all corticosteroid-resistant with a
                                                                                                                                                                                                                                                                                                                                                                                                                                                                                                                                                                                                                     higher rate of MRD positivity (71.4%) at the end of induction (data
                                                                                                                                                                                                                                                                                                                                                                                                                                                                                                                                                                                                                     not shown) and higher 5-year CIR (75% vs 27.2%, p = 0.17).
                                                                                                                                              PICALM-MLLT10 (23)

                                                                                                                                                                                                                                                                                                                                                                                                                                                                                                                                                                                                                     Despite good initial treatment response, patients with MLLT10
                                                                                                                    MLLT10 n = 37 (7%)

                                                                                                                                              NAP1L1-MLLT10 (4)
                                                                                                                                              DDX3X-MLLT10 (8)

                                                                                                                                              XPO1-MLLT10 (2)

                                                                                                                                                                                                                                                                                                                                                                                                                                                                                                                                                                                                                     fusions demonstrated a worse outcome, with shorter 5-year EFS
                                                                                                                                                                                                                                                  84% (n = 27)

                                                                                                                                                                                                                                                                                                                                  95% (n = 35)
                                                                                                                                                                                                   41% (n = 15)

                                                                                                                                                                                                                                                                                                                                                                                                                                                                                                                                                                                                                     (24% vs 62.4%, HR = 2.33; 95% CI [1.3–4.1]; p = 0.003) and shorter
                                                                                                                                                                                                                                                                  12% (n = 4)
                                                                                                                                                                                                                                                                                  14% (n = 5)
                                                                                                                                                                                23.4 (3–44)

                                                                                                                                                                                                                                                                                                                                                                                5% (n = 2)
                                                                                                                                                                                                                                   3% (n = 1)

                                                                                                                                                                                                                                                                                                                                                                                                                                                                                                                                                                                                                     5-year OS (45.7% vs 71.6%, HR = 1.94; 95% CI [0.99–3.8]; p = 0.052)
                                                                                                                                                                                                                                                                                                                                                                                                                                                                                                                                                                                                                     (Fig. 3; table S4). This poor outcome remained on EFS and OS
                                                                                                                                                                                                                                                                                                                                                                                                                                                                                                                                                                                                                     analysis of adult patients only (HR = 2.18; 95% CI [1.14–4.18]; p =
                                                                                                                                                                                                                                                                                                                                                    0
                                                                                                                                                                                                                                                                                                                                                                   0

                                                                                                                                                                                                                                                                                                                                                                                                                                                                                                                                                                                                                     0.02 and HR = 2.19; 95%CI [1.07–4.51]; p = 0.03 respectively) (Fig.
                                                                                                                                                                                                                                                                                                    Homeobox Genes Deregulation

                                                                                                                                                                                                                                                                                                                                                                                                                                                                                                                                                                                                                     S4) and persists as a trend in children only in terms of EFS (HR =
                                                                                                                                                                                                                                                                                                                                                                                                                                                                                                                                                                                                                     2.81; 95% CI [0.99–8]; p = 0.052).
                                                                                                                                                                                                                                                                                                                                                                                                                                                                                                                                                                                                                        ETS-family (n = 2) and NUP98 (n = 2) fusions were only
                                                                                                                                                                                Age mean (range)

                                                                                                                                                                                                                                                                                                                                                                                                                                                                                                                                                                                                                     identified in pediatric patients. Despite high MRD at the end of
                                                                                                                                                                                                     Pediatric cases

                                                                                                                                                                                                                                                                                    Not available
                                                                                                                    Fusion groups

                                                                                                                                                                                                                                                                                                                                                                                                                                                                                                                                                                                                                     induction (>10−4) for both patients with NUP98 rearrangements,
                                                                                                                                                                                                                                                                  αβ-lineage
                                                                                                                                                                                                                                                  γδ-lineage
                                                                                                                                                                                                                                     Immature
                                                                                                                                                                   Population
                                                                                                                                            Transcripts

                                                                                                                                                                                                                       Phenotype

                                                                                                                                                                                                                                                                                                                                                                                  Negative
                                                                                                         RT-MLPA
 Table 1.

                                                                                                                                                                                                                                                                                                                                                                                                                                                                                                                                                                                                                     only 1 patient required allogeneic HSCT. In contrast to previous
                                                                                                                                                                                                                                                                                                                                    HOXA9
                                                                                                                                                                                                                                                                                                                                                    TLX1
                                                                                                                                                                                                                                                                                                                                                                   TLX3

                                                                                                                                                                                                                                                                                                                                                                                                                                                                                                                                                                                                                     report [17], all four patients had favorable outcome and remained
                                                                                                                                                                                                                                                                                                                                                                                                                                                                                                                                                                                                                     in CR with a median follow up of 4.5 years (R, 3.4–6.7).

Blood Cancer Journal (2022)12:14
T. Steimlé et al.
4

    Fig. 1 Identified fusion transcripts and incidence. A Histogram of identified transcripts, assigned to fusion groups. On top of each bars the
    percentage of all cases. PICALM-MLLT10 (4%), SET-NUP214 (3.4%), and NUP214-ABL1 (3.4%) are the most recurrent. B Circos plot representing the
    fusion transcripts. C Schematic representation of MLLT10 fused polypeptide chains with relevant domains. OM-LZ and nuclear addressing
    signals are always conserved. D Histograms of incidence of cases by age classes and fusion groups (absolute count on y axis). ETS fusion group
    is constituted with only pediatric cases. ENTH epsin N-terminal homology, NES nuclear export domain, PZP pregnancy zone protein.

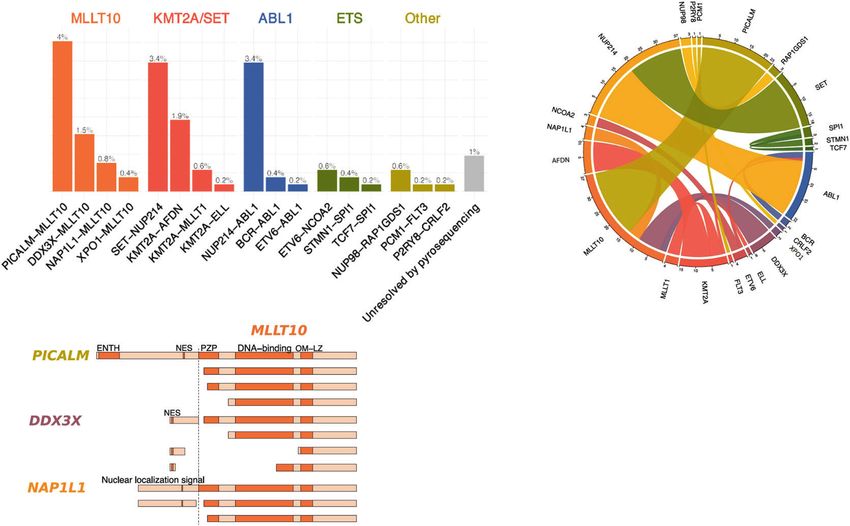
    Fig. 2 Mutational landscape according to fusion transcript group. Oncoplot depicting the genetic anomalies observed in each fusion
    transcript group. Genes are classified by functional groups. Each potent mutation is represented in yellow. Each line is a sequenced gene, each
    column a case.

    DISCUSSION                                                                PI3-AKT signaling pathways. However, contrary to BCP -ALL or
    Last decade transcriptomic and genomic studies identified                  AML, prognostic biomarkers identified in large prospective
    biological subgroups of T-ALL and uncovered major oncogenic               studies are yet lacking or debated to stratify patients at first line
    and tumor suppressor pathways [1]. This molecular character-              and adapt treatment.
    ization provided a strong rationale for targeted therapies in               In 522 consecutive adult and pediatric T-ALL RT-MLPA identified an
    T-ALL, such as drugs directed against JAK, NOTCH1, BCL-2 or               unexpected 20% incidence of chimeric fusion protein. Fusion

                                                                                                    Blood Cancer Journal (2022)12:14
T. Steimlé et al.
                                                                                                                                                                                                                                                                                                                                                                                                                      5
                                                           Total                                                                                                                                                                                                                                                                              transcripts were correlated with their respective immunophenotypic,

                                                                                                                                                  180
                                                                                       29
                                                                                                      34
                                                                                                                     20
                                                                                                                                                                                                                                                                                                                                              transcriptional and mutational landscapes, resulting in an unprece-

                                                                                                                                    6
                                                                                                                                                                                                                                                                                                                                              dented global overview.
                                                                                                                                                                                                                                                                                                                                                 MLLT10 (10p12) (previously AF10) is a frequent 5′ and 3′ partner
                                                           Ras signaling

                                                                                                                   50% (n = 10)
                                                                                                    32% (n = 11)

                                                                                                                                                20% (n = 36)
                                                                                                                                                                                                                                                                                                                                              in chimeric fusion proteins harbored by T-ALL (8–10%) [30].
                                                                                     24% (n = 7)

                                                                                                                                  33% (n = 2)                                                                                                                                                                                                 Published fusion partners include: PICALM (11q14) [31], XPO1
                                                                                                                                                                                                                                                                                                                                              (2p15) [32], NAP1L1 (12q21) [11], NUP98 (11p15) [33], DDX3X
                                                                                                                                                                                                                                                                                                                                              (Xp11) [19], and HNRNPH1 (5q35) [19]. Within T-ALL, the most
                                                                                                                                                                                                                                                                                                                                              frequent 5′ partner is PICALM, with an incidence of 4–9%
                                                                                                                                                                                                                                                                                                                                              [2, 34, 35]. MLLT10 translocations are associated with HOXA
                                                                                                                                                                                                                                                                                                                                              overexpression [36] and TCRγ/δ lineage orientation [2]. MLLT10
                                                           PI3K/Akt signaling

                                                                                                                                                                                                                                                                                                                                              contains a OM-LZ domain, known to bind to the epigenetic factor
                                                                                                                                                                                                                                                                                                                                              histone methyltransferase DOT1L [37, 38]. Direct fusion of DOT1L
                                                                                                                                                                All proportions are compared against the Negative group with Pearson’s χ2 test or for small values with the Fisher exact test. Results with p ≤ 0.05 are displayed in bold.
                                                                                                                                                19% (n = 35)

                                                                                                                                                                                                                                                                                                                                              to MLLT10 results in leukemic transformation and upregulation of
                                                                                     24% (n = 7)
                                                                                                    21% (n = 7)

                                                                                                                                  17% (n = 1)
                                                                                                                   5% (n = 1)

                                                                                                                                                                                                                                                                                                                                              HOXA9 [37]. The outcome of cases harboring MLLT10 fusion
                                                                                                                                                                                                                                                                                                                                              proteins is insufficiently described. Published studies are limited to
                                                                                                                                                                                                                                                                                                                                              children, with a trend for a pejorative outcome [35, 39]. In our
                                                                                                                                                                                                                                                                                                                                              series this unfavorable outcome was confirmed, with a shorter EFS
                                                                                                                                                                                                                                                                                                                                              and OS in the entire cohort and in the adult cohort highlighting
                                                                                                                                                                                                                                                                                                                                              the requirement alternative treatment in these cases. Same trends
                                                           Transcription factors

                                                                                                                                                                                                                                                                                                                                              were observed in children but not reached significance because of
                                                                                                                                                                                                                                                                                                                                              low number of patients. Preclinical data showed an antiprolifera-
                                                                                                                                                                                                                                                                                                                                              tive effect of demethylating agents via DOT1L in a model of
                                                                                     52% (n = 15)
                                                                                                    35% (n = 12)

                                                                                                                                                37% (n = 67)
                                                                                                                   45% (n = 9)
                                                                                                                                  17% (n = 1)

                                                                                                                                                                                                                                                                                                                                              transformed PICALM-MLLT10 cells [40].
                                                                                                                                                                                                                                                                                                                                                 Rearrangements involving KMT2A (11q23) [41] (previously MLL)
                                                                                                                                                                                                                                                                                                                                              are also recurrent in T-ALL with reported occurrence of 5–8%
                                                                                                                                                                                                                                                                                                                                              [7, 42]. Consistent with previous reports, the most frequent 3′
                                                                                                                                                                                                                                                                                                                                              partners in our T-ALL cohort were: AFDN (6q27) [43] (previously
                                                                                                                                                                                                                                                                                                                                              AF6) and MLLT1 (19p13, previously ENL) [44]. Of note, none of our
                                                           IL7R/JAK/STAT signaling

                                                                                                                                                                                                                                                                                                                                              34 cases with KMT2A fusion demonstrated KMT2A-AFF1 (previously
                                                                                                                                                                                                                                                                                                                                              MLL-AF4), or KMT2A-MLLT3 (previously MLL-AF9) fusions, com-
                                                                                                                                                                                                                                                                                                                                              monly observed in BCP-ALL and AML respectively. KMT2A
                                                                                                                                                                                                                                                                                                                                              rearranged T-ALLs over-express HOXA and are arrested in an early
                                                                                                                                                                                                                                                                                                                                              differentiation step after commitment to the γδ-lineage [1, 45].
                                                                                     3% (n = 1)
                                                                                                    3% (n = 1)
                                                                                                                   5% (n = 1)
                                                                                                                                  17% (n = 1)
                                                                                                                                                1% (n = 1)

                                                                                                                                                                                                                                                                                                                                              The prognosis of KMT2A- rearrangements in T-ALL was unclear.
                                                                                                                                                                                                                                                                                                                                              Contrary to BCP-ALL, KMT2A-MLLT1 in T-ALL has been reported to
                                                                                                                                                                                                                                                                                                                                              be favorable in children [46]. In keeping with this, in our series,
                                                                                                                                                                                                                                                                                                                                              patients with KMT2A rearrangements do not demonstrate worse
                                                                                                                                                                                                                                                                                                                                              outcome neither in terms of initial response to treatment neither
                                                                                                                                                                                                                                                                                                                                              in terms of relapse.
                                                           Epigenetic factors

                                                                                                                                                                                                                                                                                                                                                 SET-NUP214 (previously TAF1-CAN) is a recurrent chimeric
                                                                                                                                                                                                                                                                                                                                              protein found in 3–10% of T-ALLs [18, 47]. Most SET-NUP214
                                                                                                                                                57% (n = 102)
                                                                                     76% (n = 22)
                                                                                                    59% (n = 20)
                                                                                                                   60% (n = 12)
                                                                                                                                  67% (n = 4)

                                                                                                                                                                                                                                                                                                                                              chimeric proteins result from a cryptic deletion at chromosomic
                                                                                                                                                                                                                                                                                                                                              9q34, leading to loss of one ABL1 allele [48]. SET-NUP214
                                                                                                                                                                                                                                                                                                                                              induces HOXA deregulation by interacting with XPO1, DOT1L
                                                                                                                                                                                                                                                                                                                                              and the HOXA promoter [18, 49, 50]. As confirmed here, this
  Genetic profile according to fusion transcripts status.

                                                                                                                                                                                                                                                                                                                                              recombination occurs in T-ALL from the γδ-lineage that are
                                                                                                                                                                                                                                                                                                                                              associated with a poor outcome [20]. Patients with SET-NUP214
                                                                                                                                                76% (n = 136)

                                                                                                                                                                                                                                                                                                                                              chimeric protein have significantly poor initial treatment
                                                                                     41% (n = 12)
                                                                                                    41% (n = 14)
                                                                                                                   80% (n = 16)
                                                                                                                                  67% (n = 4)

                                                                                                                                                                                                                                                                                                                                              response and a trend for a higher risk of relapse without
                                                           Cell cycle

                                                                                                                                                                                                                                                                                                                                              significant prognostic impact on EFS or OS. Thus, the need of
                                                                                                                                                                                                                                                                                                                                              intensifying treatment protocol in these patients is still matter
                                                                                                                                                                                                                                                                                                                                              of debate.
                                                                                                                                                                                                                                                                                                                                                 In T-ALL, ABL1 (9q34) is predominantly rearranged with NUP214
                                                                                                                                                                                                                                                                                                                                              (4–6%, 9q34) by episomal amplification in association with TLX1/3
                                                           Notch signaling

                                                                                                                                                                                                                                                                                                                                              deregulation [51, 52]. Other, rare reported, 3′ partners include BCR
                                                                                                                                                79% (n = 143)

                                                                                                                                                                                                                                                                                                                                              (22q11), EML1 (14q32) [53], and ETV6 (12p13) [54]. All confer
                                                                                     59% (n = 17)
                                                                                                    53% (n = 18)
                                                                                                                   75% (n = 15)
                                                                                                                                  67% (n = 4)

                                                                                                                                                                                                                                                                                                                                              constitutive activation of the tyrosine kinase domain of ABL1, with
                                                                                                                                                                                                                                                                                                                                              downstream LCK mediated proliferation [55] which could be
                                                                                                                                                                                                                                                                                                                                              targeted by tyrosine kinase inhibitors (TKI) such as dasatinib or
                                                                                                                                                                                                                                                                                                                                              bosutinib [56, 57]. The clinical impact of these translocations is
                                                                                                                                                                                                                                                                                                                                              debated, with a trend for a relatively pejorative impact [58]. In our
                                                                                                                                                                                                                                                                                                                                              series no prognosis impact of this rearrangement was demon-
                                                           Fusion Group

                                                                                                                                                                                                                                                                                                                                              strated. However, due to this potentially targetable rearrangement
                                                                                                      KMT2A/SET

                                                                                                                                                                                                                                                                                                                                              these patients could benefit from the opportunity to add tyrosine
                                                                                                                                                  Negative
                                                                                       MLLT10
 Table 2.

                                                                                                                                                                                                                                                                                                                                              kinase inhibitors to standard therapy [29].
                                                                                                                     ABL1

                                                                                                                                                                                                                                                                                                                                                 The ETS family of proteins are TF containing an ETS DNA-
                                                                                                                                    ETS

                                                                                                                                                                                                                                                                                                                                              binding domain [59] which are detected in pediatric T-ALL, fused

Blood Cancer Journal (2022)12:14
T. Steimlé et al.
6
     Table 3.    Clinical characteristics and treatment response in GRAALL and FRALLE treated patients according to fusion transcript status.
    Fusion groups         Negative n =       ABL1 n =          KMT2A/SET                   MLLT10 n = 20 (9%)           ETS             other n = 2 (1%)   All n = 235
                          177 (75%)          15 (6%)           n = 19 (8%)                                              n = 2 (1%)
    Transcripts                              NUP214-           SET-NUP214 (8)              PICALM-MLLT10 (16)           ETV6-           NUP98-
                                             ABL1 (14)                                                                  NCOA2 (1)       RAP1GDS1 (2)
                                             BCR-ABL1 (1)      KMT2A-AFDN (5)              NAP1L1-MLLT10 (1)            TCF7-SPI1 (1)
                                                               KMT2A-MLLT1 (4)              DDX3X-MLLT10 (2)
                                                               KMT2A-ELL (1)                  XPO-MLLT10 (1)
                                                               KMT2A-? (1)
    Clinical subsets
     Age, median          19.9 (1.1–59)      15.9 (4.9–40.4)            27.5 (8.5–44.6)              29.8 (5.8–45.6)    4.6–4.2         12–12.8             21 (1.1–58.9)
     (range), y
     WBC, median          84.9 (2.8–788)       98 (12–980)             29.2 (2.8–195)                 28 (1.2–352)      16–641          24.3–49            73.2 (1.2–980)
     (range)
     CNS                   20 (11)              3 (20)                       1 (5.3)                    4 (20)          0               0                   28 (11.9)
     involvement (%)
     Male, n (%)          134 (76)             12 (80)                   15 (79)                      12 (60)           1 (50)          2 (100)            176 (74.9)
    Treatment response, n (%)
     Poor steroid          84 (47.4)           11 (73.3)                 16 (84.2)                    14 (70.0)         1 (50)          0                  126 (53.6)
     response
     CR                   161 (91)             10 (66.7)                 19 (100)                     17 (85.0)         2 (100)         2 (100)            211 (89.8)
     MRD > 10–4            38 (29)              5 (55.6)                     8 (53.3)                   7 (58.3)        0               2 (100)             59 (34.3)
     Allo HSCT             37 (22)              2 (20)                       7 (36.8)                   6 (35.3)        0               1 (50)              59 (28)
     All subgroups characteristics are compared with the negative group. All results with p value ≤ 0.05 are displayed in bold.
     allo HSCT allogeneic hematopoietic stem cell transplantation, CNS central nervous system, CR complete remission, MRD minimal residual disease, WBC white
     blood cell.

    Fig. 3 Clinical impact of the fusion transcripts group. A–D Event-Free Survival (EFS) and (E–H) Overall Survival (OS) according to fusion
    transcripts status in GRAALL and FRALLE treated patients.

    in-frame to different 3′ or 5′ partners. SPI1 (11p11.2 encoding                       targetable rearrangement such as ABL1 [57] (with tyrosine kinase
    PU.1) is fused in the 3′ position with STMN1 (1p36) or TCF7 (5q31)                    inhibitor) or KMT2A (with Dot1l or menin inhibitor) [40, 60] or who
    and ETV6 (12p13) is fused in 5′ with NCOA2 (8q13). SPI1 fusions                       have poor prognosis and require treatment adaptation. However,
    transcripts have been described in 4% of one pediatric T-ALL                          RT-MLPA only allows detection of known fusion transcripts. New
    series, when they demonstrated a distinct gene expression profile                      fusion transcripts detected by T-ALL RNA sequencing can easily be
    and a poor outcome [17]. In contrast to this, all 4 FRALLE 2000T                      added to the RT-MLPA, thus providing a complement and extension
    treated patients in our series had a favorable outcome.                               to RNA-Seq approaches. In addition, the excellent specificity of this
       RT-MLPA has the capacity to easily detect many rearrangements                      method was already demonstrated on a previous cohort of 540
    and its fast turnaround time and superior exhaustivity and reduced                    patients with acute leukemia, confirming virtually all (98%) fusion
    cDNA consumption could make it an interesting alternative to RT-                      transcripts detected by RT-PCR and Sanger sequencing [26]. As such,
    PCR. Such a screening strategy will also identify patients with                       it is well adapted to routine clinical screening in Acute Leukemia.

                                                                                                                     Blood Cancer Journal (2022)12:14
T. Steimlé et al.
                                                                                                                                                                                        7
REFERENCES                                                                                         overexpressing adult T-cell acute lymphoblastic leukemia: a Group for Research
 1. Ferrando AA, Neuberg DS, Staunton J, Loh ML, Huard C, Raimondi SC, et al. Gene                 in Adult Acute Lymphoblastic Leukemia study. Haematologica. 2016;101:732–40.
    expression signatures define novel oncogenic pathways in T cell acute lym-                26.   Ruminy P, Marchand V, Buchbinder N, Larson T, Joly B, Penther D, et al. Multi-
    phoblastic leukemia. Cancer Cell. 2002;1:75–87.                                                plexed targeted sequencing of recurrent fusion genes in acute leukaemia. Leu-
 2. Asnafi V, Radford-Weiss I, Dastugue N, Bayle C, Leboeuf D, Charrin C, et al. CALM-              kemia. 2016;30:757–60.
    AF10 is a common fusion transcript in T-ALL and is specific to the TCRgamma-              27.   Deshpande AJ, Rouhi A, Lin Y, Stadler C, Greif PA, Arseni N, et al. The clathrin-
    delta lineage. Blood. 2003;102:1000–6.                                                         binding domain of CALM and the OM-LZ domain of AF10 are sufficient to induce
 3. Pui C-H, Yang JJ, Hunger SP, Pieters R, Schrappe M, Biondi A, et al. Childhood                 acute myeloid leukemia in mice. Leukemia. 2011;25:1718–27.
    Acute Lymphoblastic Leukemia: Progress Through Collaboration. J Clin Oncol.              28.   Graux C, Stevens-Kroef M, Lafage M, Dastugue N, Harrison CJ, Mugneret F, et al.
    2015;33:2938–48.                                                                               Heterogeneous patterns of amplification of the NUP214-ABL1 fusion gene in
 4. Pui C-H, Robison LL, Look AT. Acute lymphoblastic leukaemia. Lancet.                           T-cell acute lymphoblastic leukemia. Leukemia. 2009;23:125–33.
    2008;371:1030–43.                                                                        29.   Hagemeijer A, Graux C. ABL1 rearrangements in T-Cell acute lymphoblastic leu-
 5. Hocking J, Schwarer AP, Gasiorowski R, Patil S, Avery S, Gibson J, et al. Excellent            kemia. Genes Chromosom Cancer. 2010;49:299–308.
    outcomes for adolescents and adults with acute lymphoblastic leukemia and                30.   Forgione MO, McClure BJ, Yeung DT, Eadie LN, White DL. MLLT10 rearranged
    lymphoma without allogeneic stem cell transplant: the FRALLE-93 pediatric                      acute leukemia: incidence, prognosis, and possible therapeutic strategies. Genes,
    protocol. Leuk Lymphoma. 2014;55:2801–7.                                                       Chromosomes Cancer. 2020;59:709–21.
 6. Huguet F, Leguay T, Raffoux E, Thomas X, Beldjord K, Delabesse E, et al. Pediatric-      31.   t(10;11)(p13–14;q14–21): A New Recurrent Translocation in T-Cell Acute Lym-
    Inspired Therapy in Adults With Philadelphia Chromosome–Negative Acute                         phoblastic Leukemias. Groupe Français de Cytogénétique Hématologique
    Lymphoblastic Leukemia: The GRAALL-2003 Study. JCO. 2009;27:911–8.                             (GFCH). Genes Chromosom Cancer.1991;3:411–5.
 7. Graux C, Cools J, Michaux L, Vandenberghe P, Hagemeijer A. Cytogenetics and              32.   Bond J, Bergon A, Durand A, Tigaud I, Thomas X, Asnafi V, et al. Cryptic XPO1-
    molecular genetics of T-cell acute lymphoblastic leukemia: from thymocyte to                   MLLT10 translocation is associated with HOXA locus deregulation in T-ALL. Blood.
    lymphoblast. Leukemia. 2006;20:1496–510.                                                       2014;124:3023–5.
 8. Van Vlierberghe P, Pieters R, Beverloo HB, Meijerink JP. Molecular-genetic insights      33.   Romana SP, Radford-Weiss I, Ben Abdelali R, Schluth C, Petit A, Dastugue N, et al.
    in paediatric T-cell acute lymphoblastic leukaemia. Br J Haematol.                             NUP98 rearrangements in hematopoietic malignancies: a study of the Groupe
    2008;143:153–68.                                                                               Francophone de Cytogénétique Hématologique. Leukemia. 2006;20:696–706.
 9. Fattizzo B, Rosa J, Giannotta JA, Baldini L, Fracchiolla NS. The Physiopathology of      34.   Ben Abdelali R, Asnafi V, Petit A, Micol J-B, Callens C, Villarese P, et al. The
    T- Cell Acute Lymphoblastic Leukemia: focus on Molecular Aspects. Front Oncol.                 prognosis of CALM-AF10-positive adult T-cell acute lymphoblastic leukemias
    2020;10. https://doi.org/10.3389/fonc.2020.00273.                                              depends on the stage of maturation arrest. Haematologica. 2013;98:1711–7.
10. Liu Y, Easton J, Shao Y, Maciaszek J, Wang Z, Wilkinson MR, et al. The genomic           35.   Lo Nigro L, Mirabile E, Tumino M, Caserta C, Cazzaniga G, Rizzari C, et al.
    landscape of pediatric and young adult T-lineage acute lymphoblastic leukemia.                 Detection of PICALM-MLLT10 (CALM-AF10) and outcome in children with
    Nat Genet. 2017;49:1211–8.                                                                     T-lineage acute lymphoblastic leukemia. Leukemia. 2013;27:2419–21.
11. Zhang J, Ding L, Holmfeldt L, Wu G, Heatley SL, Payne-Turner D, et al. The genetic       36.   Dik WA, Brahim W, Braun C, Asnafi V, Dastugue N, Bernard OA, et al. CALM-AF10+
    basis of early T-cell precursor acute lymphoblastic leukaemia. Nature.                         T-ALL expression profiles are characterized by overexpression of HOXA and BMI1
    2012;481:157–63.                                                                               oncogenes. Leukemia. 2005;19:1948–57.
12. Belver L, Ferrando A. The genetics and mechanisms of T cell acute lymphoblastic          37.   Okada Y, Feng Q, Lin Y, Jiang Q, Li Y, Coffield VM, et al. hDOT1L Links Histone
    leukaemia. Nat Rev Cancer. 2016;16:494–507.                                                    Methylation to Leukemogenesis. Cell. 2005;121:167–78.
13. Yang JJ, Park TS, Wan TSK. Recurrent Cytogenetic Abnormalities in Acute Myeloid          38.   Okada Y, Jiang Q, Lemieux M, Jeannotte L, Su L, Zhang Y. Leukaemic transfor-
    Leukemia. In: Wan TSK, editors. Cancer Cytogenetics: Methods and Protocols.                    mation by CALM-AF10 involves upregulation of Hoxa5 by hDOT1L. Nat Cell Biol.
    New York, NY:Springer; 2017. p. 223–45.                                                        2006;8:1017–24.
14. Schwab C, Harrison CJ. Advances in B-cell Precursor Acute Lymphoblastic Leu-             39.   van Grotel M, Meijerink JP, Beverloo HB, Langerak AW, Buys-Gladdines JG,
    kemia Genomics. Hemasphere. 2018;2:e53.                                                        Schneider P, et al. The outcome of molecular-cytogenetic subgroups in pediatric
15. Chen B, Jiang L, Zhong M-L, Li J-F, Li B-S, Peng L-J, et al. Identification of fusion           T-cell acute lymphoblastic leukemia: a retrospective study of patients treated
    genes and characterization of transcriptome features in T-cell acute lympho-                   according to DCOG or COALL protocols. Haematologica. 2006;91:1212–21.
    blastic leukemia. PNAS. 2018;115:373–8.                                                  40.   Chen L, Deshpande AJ, Banka D, Bernt KM, Dias S, Buske C, et al. Abrogation of
16. Matlawska-Wasowska K, Kang H, Devidas M, Wen J, Harvey RC, Nickl CK, et al. MLL                MLL–AF10 and CALM–AF10-mediated transformation through genetic inactiva-
    rearrangements impact outcome in HOXA-deregulated T-lineage acute lym-                         tion or pharmacological inhibition of the H3K79 methyltransferase Dot1l. Leu-
    phoblastic leukemia: a Children’s Oncology Group Study. Leukemia.                              kemia. 2013;27:813–22.
    2016;30:1909–12.                                                                         41.   McCabe NR, Kipiniak M, Kobayashi H, Thirman M, Gill H, Rowley JD, et al. DNA
17. Seki M, Kimura S, Isobe T, Yoshida K, Ueno H, Nakajima-Takagi Y, et al. Recurrent              rearrangements and altered transcripts of the MLL gene in a human T-all cell line
    SPI1 (PU.1) fusions in high-risk pediatric T cell acute lymphoblastic leukemia. Nat            karpas 45 with a t(X;II) (q13;q23) translocation. Genes Chromosom Cancer.
    Genet. 2017;49:1274–81.                                                                        1994;9:221–4.
18. Van Vlierberghe P, van Grotel M, Tchinda J, Lee C, Beverloo HB, van der Spek PJ,         42.   Hayette S, Tigaud I, Maguer-Satta V, Bartholin L, Thomas X, Charrin C, et al.
    et al. The recurrent SET-NUP214 fusion as a new HOXA activation mechanism in                   Recurrent involvement of the MLL gene in adult T-lineage acute lymphoblastic
    pediatric T-cell acute lymphoblastic leukemia. Blood. 2008;111:4668–80.                        leukemia. Blood. 2002;99:4647–9.
19. Brandimarte L, Pierini V, Di Giacomo D, Borga C, Nozza F, Gorello P, et al. New          43.   Tanabe S, Zeleznik-Le NJ, Kobayashi H, Vignon C, Espinosa R, LeBeau MM, et al.
    MLLT10 gene recombinations in pediatric T-acute lymphoblastic leukemia. Blood.                 Analysis of the t(6;11)(q27;q23) in leukemia shows a consistent breakpoint in AF6
    2013;121:5064–7.                                                                               in three patients and in the ML-2 cell line. Genes Chromosom Cancer.
20. Ben Abdelali R, Roggy A, Leguay T, Cieslak A, Renneville A, Touzart A, et al. SET-             1996;15:206–16.
    NUP214 is a recurrent γδ lineage-specific fusion transcript associated with cor-          44.   Peterson JF, Baughn LB, Pearce KE, Williamson CM, Benevides Demasi JC, Olson
    ticosteroid/chemotherapy resistance in adult T-ALL. Blood. 2014;123:1860–3.                    RM, et al. KMT2A (MLL) rearrangements observed in pediatric/young adult
21. Asnafi V, Beldjord K, Boulanger E, Comba B, Le Tutour P, Estienne MH, et al.                    T-lymphoblastic leukemia/lymphoma: a 10-year review from a single cytogenetic
    Analysis of TCR, pT alpha, and RAG-1 in T-acute lymphoblastic leukemias                        laboratory. Genes Chromosom Cancer. 2018;57:541–6.
    improves understanding of early human T-lymphoid lineage commitment. Blood.              45.   Ferrando AA, Armstrong SA, Neuberg DS, Sallan SE, Silverman LB, Korsmeyer SJ,
    2003;101:2693–703.                                                                             et al. Gene expression signatures in MLL-rearranged T-lineage and B-precursor
22. Delabesse E, Bernard M, Landman-Parker J, Davi F, Leboeuf D, Varet B, et al.                   acute leukemias: dominance of HOX dysregulation. Blood. 2003;102:262–8. Epub
    Simultaneous SIL-TAL1 RT-PCR detection of all tal(d) deletions and identification               2003 Mar 13
    of novel tal(d) variants. Br J Haematol. 1997;99:901–7.                                  46.   Rubnitz JE, Camitta BM, Mahmoud H, Raimondi SC, Carroll AJ, Borowitz MJ, et al.
23. Asnafi V, Beldjord K, Libura M, Villarese P, Millien C, Ballerini P, et al. Age-related         Childhood acute lymphoblastic leukemia with the MLL-ENL fusion and t(11;19)
    phenotypic and oncogenic differences in T-cell acute lymphoblastic leukemias                   (q23;p13.3) translocation. J Clin Oncol. 1999;17:191–6.
    may reflect thymic atrophy. Blood. 2004;104:4173–80.                                      47.   Chae H, Lim J, Kim M, Park J, Kim Y, Han K, et al. Phenotypic and genetic
24. Ballerini P, Blaise A, Busson-Le Coniat M, Su XY, Zucman-Rossi J, Adam M, et al.               characterization of adult T-cell acute lymphoblastic leukemia with del(9)(q34);
    HOX11L2 expression defines a clinical subtype of pediatric T-ALL associated with                SET-NUP214 rearrangement. Ann Hematol. 2012;91:193–201.
    poor prognosis. Blood. 2002;100:991–7.                                                   48.   Quentmeier H, Schneider B, Röhrs S, Romani J, Zaborski M, MacLeod RA, et al.
25. Bond J, Marchand T, Touzart A, Cieslak A, Trinquand A, Sutton L, et al. An early               SET-NUP214 fusion in acute myeloid leukemia- and T-cell acute lymphoblastic
    thymic precursor phenotype predicts outcome exclusively in HOXA-                               leukemia-derived cell lines. BioMed Central. 2009;2:1–5.

Blood Cancer Journal (2022)12:14
T. Steimlé et al.
8
    49. Oka M, Mura S, Otani M, Miyamoto Y, Nogami J, Maehara K, et al. Chromatin-                recherche translationnelle en cancérologie dans le cadre du Plan cancer 2009–2013 ».
        bound CRM1 recruits SET-Nup214 and NPM1c onto HOX clusters causing aber-                  This work was supported by grants to Necker laboratory from the “Association
        rant HOX expression in leukemia cells. eLife. 2019;8:e46667.                              Laurette Fugain”, Association pour la Recherche contre le Cancer (Equipe labellisée),
    50. Saito S, Cigdem S, Okuwaki M, Nagata K. Leukemia-Associated Nup214 Fusion                 Institut National du Cancer PRT-K 18–071 and the Fédération Leucémie espoir and
        Proteins Disturb the XPO1-Mediated Nuclear-Cytoplasmic Transport Pathway and              Horizon Hemato.
        Thereby the NF-κB Signaling Pathway. Mol Cell Biol. 2016;36:1820–35.
    51. Vanden Bempt M, Demeyer S, Broux M, De Bie J, Bornschein S, Mentens N, et al.
        Cooperative Enhancer Activation by TLX1 and STAT5 Drives Development of                   AUTHOR CONTRIBUTIONS
        NUP214-ABL1/TLX1-Positive T Cell Acute Lymphoblastic Leukemia. Cancer Cell.               VA, TS, PR, MA, and MED conceived the study and oversaw the project; MA, MS, AT,
        2018;34:271–.e7.                                                                          JM, LL, JB, CG, NG, JMC, IA, VG, NI, HD, AB, AP, PR, and NB provided study materials or
    52. Burmeister T, Gökbuget N, Reinhardt R, Rieder H, Hoelzer D, Schwartz S. NUP214-           patients; TS, MA, and VA performed molecular analyses; TS, MED, and VA collected
        ABL1 in adult T-ALL: the GMALL study group experience. Blood. 2006;108:3556–9.            and assembled data; NB, TS, and MED performed statistical analysis; TS, MED, NB, and
    53. De Keersmaecker K, Graux C, Odero MD, Mentens N, Somers R, Maertens J, et al.             VA analyzed and interpreted data; TS, MED, EM, NB, and VA wrote the paper; all
        Fusion of EML1 to ABL1 in T-cell acute lymphoblastic leukemia with cryptic t(9;14)        authors approved the paper.
        (q34;q32). Blood. 2005;105:4849–52.
    54. Schlieben S, Borkhardt A, Reinisch I, Ritterbach J, Janssen JW, Ratei R, et al.
        Incidence and clinical outcome of children with BCR/ABL-positive acute lym-
        phoblastic leukemia (ALL). A prospective RT-PCR study based on 673 patients               COMPETING INTERESTS
        enrolled in the German pediatric multicenter therapy trials ALL-BFM-90 and                The authors declare no competing interests.
        CoALL-05-92. Leukemia. 1996;10:957–63.
    55. Keersmaecker KD, Porcu M, Cox L, Girardi T, Vandepoel R, Beeck JO de et al.
        NUP214-ABL1-mediated cell proliferation in T-cell acute lymphoblastic leukemia            ADDITIONAL INFORMATION
        is dependent on the LCK kinase and various interacting proteins. 2014;99:85–93.           Supplementary information The online version contains supplementary material
    56. Graux C, Cools J, Melotte C, Quentmeier H, Ferrando A, Levine R, et al. Fusion of         available at https://doi.org/10.1038/s41408-022-00613-9.
        NUP214 to ABL1 on amplified episomes in T-cell acute lymphoblastic leukemia.
        Nat Genet. 2004;36:1084–9.                                                                Correspondence and requests for materials should be addressed to Vahid Asnafi.
    57. Quintás-Cardama A, Tong W, Manshouri T, Vega F, Lennon PA, Cools J, et al.
        Activity of tyrosine kinase inhibitors against human NUP214-ABL1-positive T cell          Reprints and permission information is available at http://www.nature.com/
        malignancies. Leukemia. 2008;22:1117–24.                                                  reprints
    58. Ballerini P, Landman-Parker J, Cayuela JM, Asnafi V, Labopin M, Gandemer V, et al.
        Impact of genotype on survival of children with T-cell acute lymphoblastic leu-           Publisher’s note Springer Nature remains neutral with regard to jurisdictional claims
        kemia treated according to the French protocol FRALLE-93: the effect of TLX3/             in published maps and institutional affiliations.
        HOX11L2 gene expression on outcome. Haematologica. 2008;93:1658–65.
    59. Wasylyk B, Hahn SL, Giovane A. The Ets family of transcription factors. In: Christen P,
        Hofmann E, editors. EJB Reviews 1993. Berlin, Heidelberg:Springer;1994. p. 7–18.
    60. Klossowski S, Miao H, Kempinska K, Wu T, Purohit T, Kim E, et al. Menin inhibitor
        MI-3454 induces remission in MLL1-rearranged and NPM1-mutated models of                                      Open Access This article is licensed under a Creative Commons
        leukemia. J Clin Investig. 2020;130:981–97.                                                                  Attribution 4.0 International License, which permits use, sharing,
                                                                                                  adaptation, distribution and reproduction in any medium or format, as long as you give
                                                                                                  appropriate credit to the original author(s) and the source, provide a link to the Creative
    ACKNOWLEDGEMENTS                                                                              Commons license, and indicate if changes were made. The images or other third party
    The authors would like to thank all participants in the GRAALL-2003 and GRAALL-               material in this article are included in the article’s Creative Commons license, unless
    2005 study groups, the SFCE and the investigators of the 16 SFCE centers involved in          indicated otherwise in a credit line to the material. If material is not included in the
    collection and provision of data and patient samples, and V. Lheritier for collection of      article’s Creative Commons license and your intended use is not permitted by statutory
    clinical data. The GRAALL was supported by grants P0200701 and P030425/                       regulation or exceeds the permitted use, you will need to obtain permission directly
    AOM03081 from the Programme Hospitalier de Recherche Clinique, Ministère de                   from the copyright holder. To view a copy of this license, visit http://creativecommons.
    l’Emploi et de la Solidarité, France and the Swiss Federal Government in Switzerland.         org/licenses/by/4.0/.
    Samples were collected and processed by the AP-HP “Direction de Recherche
    Clinique” Tumor Bank at Necker-Enfants Malades. MED was supported by “CARPEM”.
                                                                                                  © The Author(s) 2022
    MS was supported by « Action Leucémie » and « Soutien pour la formation à la

                                                                                                                                Blood Cancer Journal (2022)12:14
You can also read