CLINICAL-ALIMENTARY TRACT
←
→
Page content transcription
If your browser does not render page correctly, please read the page content below
Gastroenterology 2020;158:1250–1261

              CLINICAL—ALIMENTARY TRACT
              Prevalence of Gastroesophageal Reflux Disease and Proton
              Pump Inhibitor-Refractory Symptoms
              Sean D. Delshad,1,2,* Christopher V. Almario,1,3,4,5,* William D. Chey,6 and
              Brennan M. R. Spiegel1,3,4
              1
               Cedars-Sinai Center for Outcomes Research and Education (CS-CORE), Los Angeles, California; 2Department of Medicine,
CLINICAL AT

              David Geffen School of Medicine at UCLA, Los Angeles, California; 3Division of Digestive and Liver Diseases, Cedars-Sinai
              Medical Center, Los Angeles, California; 4Division of Health Services Research, Cedars-Sinai Medical Center, Los Angeles,
              California; 5Division of Informatics, Cedars-Sinai Medical Center, Los Angeles, California; and 6Division of Gastroenterology,
              Michigan Medicine, Ann Arbor, Michigan

                                                                              women, Latino individuals, and participants with irritable
                            See editorial on page 1211.                       bowel syndrome or Crohn’s disease were more likely to
                                                                              have continued symptoms, even when taking PPIs. CON-
              BACKGROUND & AIMS: There are few data on the preva-             CLUSIONS: Using a population-based survey, we found GERD
              lence of gastroesophageal reflux disease (GERD) in the           symptoms to be common: 2 of 5 participants have had GERD
              United States. We performed a population-based study to         symptoms in the past and 1 of 3 had symptoms in the past
              determine the prevalence of GERD symptoms and persis-           week. We also found that half of PPI users have persistent
              tent GERD symptoms despite use of proton pump inhibitors        symptoms. Given the significant effect of GERD on quality of
              (PPIs). METHODS: We conducted the National Gastrointes-         life, further research and development of new therapies are
              tinal Survey in 2015 using MyGiHealth, an app that guides       needed for patients with PPI-refractory GERD symptoms.
              participants through National Institutes of Health gastro-
              intestinal Patient-Reported Outcomes Measurement Infor-
                                                                              Keywords:     Heartburn;      Regurgitation;      Esophagus;      North
              mation System surveys. Primary outcomes were prevalence
                                                                              America.
              of GERD symptoms in the past and persistence of GERD
              symptoms (heartburn or regurgitation 2 or more days in
              past week) among participants taking PPIs. Population
              weights were applied to the data and multivariable              *Authors share co-first authorship.
              regression was used to adjust for confounding. RESULTS:
                                                                              Abbreviations used in this paper: AEGIS, Automated Evaluation of
              Among 71,812 participants, 32,878 (44.1%) reported hav-         Gastrointestinal Symptoms; CI, confidence interval; GERD, gastroesoph-
              ing had GERD symptoms in the past and 23,039 (30.9%)            ageal reflux disease; GI, gastrointestinal; IBS, irritable bowel syndrome;
                                                                              NIH, National Institutes of Health; OR, odds ratio; PPI, proton pump in-
              reported having GERD symptoms in the past week. We also         hibitor; PROMIS, Patient-Reported Outcomes Measurement Information
              found that 35.1% of those who had experienced GERD              System; PW, population-weighted.
              symptoms were currently on therapy (55.2% on PPIs,                  Most current article
              24.3% on histamine-2 receptor blockers, and 24.4% on
                                                                                                     © 2020 by the AGA Institute
              antacids). Among 3229 participants taking daily PPIs,                                        0016-5085/$36.00
              54.1% had persistent GERD symptoms. Younger individuals,                       https://doi.org/10.1053/j.gastro.2019.12.014
April 2020 Prevalence of GERD and PPI-Refractory GERD Symptoms 1251
G astroesophageal reflux disease (GERD) involves
classic symptoms of heartburn and/or regurgita-
tion.1 It is a highly prevalent disease with significant eco-
WHAT YOU NEED TO KNOW
BACKGROUND AND CONTEXT
nomic impact and reduction in patient health-related quality There are few data on the prevalence of gastroesophageal
of life.2–5 Although there are a number of available effective reflux disease (GERD) symptoms in the United States.
prescription and over-the-counter therapies, 45% of
NEW FINDINGS
patients on a proton pump inhibitor (PPI) experience
persistent GERD symptoms despite treatment.6 A population-based survey found GERD symptoms to be
common: 44.1% of participants reported having had
Previous estimates of the prevalence of weekly GERD
GERD symptoms in the past and 30.9% reported having
symptoms in the United States range from 18% to 28%.7 GERD symptoms in the last week. Half of users of
These estimates, however, are based largely on 2 pop- proton pump inhibitors have persistent symptoms.
CLINICAL AT
ulations: residents of Olmstead County, Minnesota, and
LIMITATIONS
employees of the Houston Veterans Affairs Medical Center.7
Neither group is representative of the current US These findings are based on a survey completed by
demographics, as Olmstead County is 90% white7 and the patients; results could be subject to bias.
Houston Veterans Affairs employee population is 43% Af- IMPACT
rican American.8 Another US population-based study of Given the significant effects of GERD on quality of life,
21,128 adults found that 22% and 16% of Americans further research and development of new therapies are
experienced heartburn and regurgitation within the past needed for patients with proton pump inhibitor-
month, respectively.9 Of note, although this study was con- refractory GERD symptoms.
ducted nationally, the cohort was 82% non-Hispanic white;
data from the US Census Bureau’s American Community “none of these” option: heartburn, acid reflux, or gastroesoph-
Survey in 2017 shows that 61% of the population is non- ageal reflux; abdominal pain; bloating/gas; constipation; diar-
Hispanic white.10 As GERD prevalence varies with race/ rhea; disrupted swallowing; fecal incontinence; nausea and
ethnicity, these prior studies may provide inaccurate vomiting. We chose these symptoms based on the National
estimates of the current prevalence of GERD symptoms in Institutes of Health (NIH) Patient-Reported Outcomes Mea-
the United States.11 surement Information System (PROMIS) framework.17–19 For
Given the significant impact of heartburn and regurgi- each reported GI symptom, AEGIS guided respondents through
tation on health-related quality of life and health care uti- corresponding GI PROMIS questionnaires to measure
lization, along with the evolving demographics of the United severity20; the GERD PROMIS item bank and other questions
States, it is important to understand the current burden and related to “heartburn, acid reflux, or gastroesophageal reflux”
distribution of GERD symptoms in the US population. are presented in the Supplementary Material. Participants also
Moreover, the high prevalence of persistent GERD symp- were presented questions regarding demographics, socioeco-
toms despite PPI therapy (referred to as “PPI-refractory nomic status, and medical comorbidities.
We aimed to recruit a representative sample of Americans
GERD symptoms” in this article) also highlights the need for
for the National GI Survey by enacting quotas for age, sex, and
a better understanding of the predictors of the disease and
region of country (Northeast, South, Midwest, and West). We
response to therapies as we aim to reduce its overall burden
partnered with Cint, a survey research firm that uses a reward
and maximize benefits from future adjunctive, novel thera- system to incentivize respondents to participate in surveys.
pies. Therefore, the aims of this study were to determine the Potential respondents were sent an e-mail through Cint
prevalence and predictors of GERD and PPI-refractory GERD research panels inviting them to complete an online survey.
symptoms in a large, representative sample of community- Along with the link to the survey, the e-mail also included the
dwelling Americans. following templated text, which was subject to editing from
individual research panels: “Based on the information stored in
your [research panel] profile, we believe we have a survey that
Materials and Methods you will qualify and earn from. The survey takes approximately
15 minutes and if you successfully complete it, your account
Study Design, Data Source, and Study will be credited with [incentive].” Cint’s reward symptom is
Population based on the length of the interview and requires certain
In October 2015, our group conducted the “National thresholds to be met before panelists can redeem rewards. This
Gastrointestinal (GI) Survey,” a population-based audit of GI structure is meant to encourage long-term participation and
symptoms in more than 71,000 community-dwelling Ameri- discourage professional respondents who seek to take surveys
cans.12–15 The survey was administered via MyGiHealth, a only for financial gain.
mobile app that uses AEGIS (Automated Evaluation of GI Participant recruitment for the National GI Survey occurred
Symptoms), an automated algorithm that has previously been from October 14, 2015, to November 4, 2015. Survey initiations
described in detail.16 AEGIS asked users to “Select any symp- were distributed by Cint until we reached our sample size goal
tom(s) you experienced in the past week” and “Please check of approximately 70,000 respondents, allowing us to create a
any of these GI symptom(s) that you have EVER experienced.” dataset with robust explanatory power and for examining the
Answer options included the following 8 symptoms as well as a prevalence and predictors of both common as well as less1252 Delshad et al Gastroenterology Vol. 158, No. 5
common GI symptoms. Users who clicked the survey link in the population estimates10,21; the actual weights used in the ana-
invitation were brought to a home page asking them to lyses were previously described elsewhere.13,14 This was done
complete a “GI Survey”; no specific mentions of GERD were to adjust for over- and undersampling of subgroups in the
made on the initial screen. All individuals 18 years of age National GI Survey, thereby decreasing bias due to nonresponse
were included in the study. and underrepresented groups in the population.
A 2-tailed P value of less than .05 was considered statistically
significant. We performed population-weighted (PW) multivari-
Outcomes
able regression models to adjust for potentially confounding
Our primary outcome was prevalence of having had GERD
factors and to calculate adjusted P values, odds ratios (ORs), and
symptoms (heartburn, acid reflux, or gastroesophageal reflux)
95% confidence intervals (CIs). These regression models were
in the past, categorized by having ever experienced GERD
performed on our primary and secondary outcomes, adjusted by
symptoms, GERD symptoms within the past 7 days, and
relevant demographic, socioeconomic, medication, and comor-
CLINICAL AT
troublesome GERD symptoms as determined by a modified
bidity variables described previously. We used logistic and linear
Montreal definition (heartburn or regurgitation occurring 2
multivariable regression models for binary and continuous
days in the past week).1 To determine whether respondents
outcomes, respectively. This study was approved by the Cedars-
met the Montreal definition, we leveraged 2 items from PROMIS
Sinai Institutional Review Board (Pro54744).
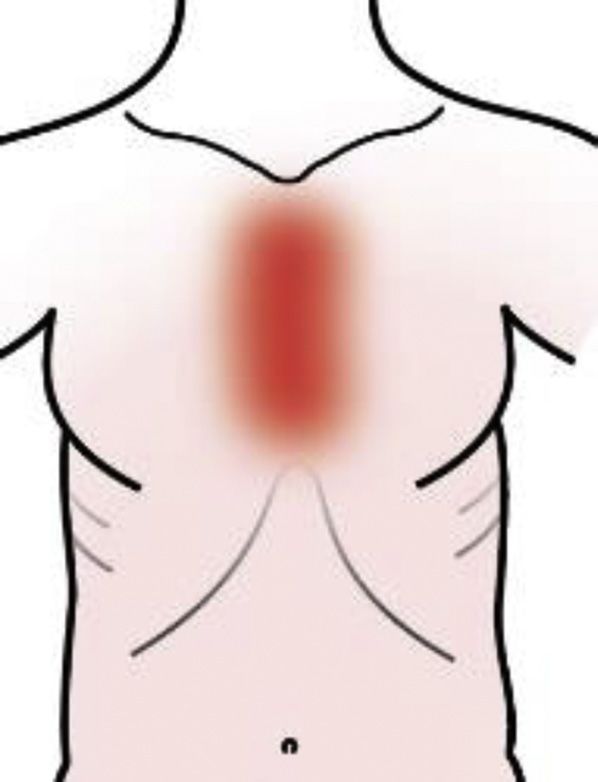
(Supplementary Material): heartburn: In the past 7 days, how
often did you feel burning in the red area shown in the picture
(behind the breastbone)?; regurgitation: In the past 7 days, how
often did you have regurgitation—that is, food or liquid coming
Results
back into your throat or mouth without vomiting? Answer Study Cohort
options for both questions included never, 1 day, 2 to 6 days, In all, 1.3 million individuals were invited to complete
once a day, or more than once a day. Of note, although the the National GI Survey with the opportunity to participate in
Global Consensus Group states that in population-based studies the study up until at least 70,000 surveys were completed.
troublesome GERD symptoms can be determined by the pres- Ultimately, 124,674 (9.4%) individuals accessed the survey,
ence of mild symptoms on 2 days a week or moderate/severe of whom 71,812 (57.6%) completed the questionnaires and
symptoms occurring 1 day a week, our survey only assessed were included in the study. Table 1 lists the demographic
for the former, hence our use of a modified Montreal definition. information of the study cohort.
As a secondary outcome, we assessed for GERD symptom
severity as determined by PROMIS in those who reported GERD
in the past week.13,19,20 Another secondary outcome was GERD Symptoms Within the Past 7 Days Among
prevalence of PPI-refractory GERD symptoms, defined as Overall Cohort
heartburn or regurgitation for 2 days in the past week among Among 71,812 participants, we found that 32,878 (PW
those currently taking a daily PPI. 44.1%) had ever experienced GERD symptoms in the past
and 23,039 (PW 30.9%) reported being symptomatic in the
Covariates past week. Table 2 summarizes the predictors of having had
We also examined participants’ medication use, de- GERD symptoms in the past week. When compared with
mographics, and past medical history. Respondents were asked individuals aged 18 to 29 years, those 30 to 59 years of age
which medicines they were currently taking for their GERD had increased odds for reporting recent esophageal symp-
symptoms and frequency of use (Supplementary Material): PPI toms; no significant difference was seen for the 60-year-
(dexlansoprazole, esomeprazole, lansoprazole, omeprazole, old group. Women and those who identified as non-Hispanic
pantoprazole, rabeprazole); histamine-2 receptor blocker white were more likely to have had recent GERD symptoms.
(cimetidine, famotidine, ranitidine); antacids (eg, Tums, Rolaids, Increasing levels of education as well as nonsingle marital
Mylanta, Maalox); other medicine. Demographic information status were associated with significantly higher odds for
elicited via the survey included age, gender, race/ethnicity, having experienced GERD symptoms in the past week. In-
education, marital status, employment status, and income level. dividuals with income levels from $50,001 to $100,000
Participants also were asked to identify comorbid conditions were more likely to report recent GERD symptoms as
that had been “diagnosed by a doctor and can affect the GI
compared with those with income levels $50,000;
system,” including irritable bowel syndrome (IBS), chronic
conversely, those making $200,001 were less likely to
idiopathic constipation, cancer of the GI tract, celiac disease,
have such symptoms. Moreover, those with specific
cirrhosis, Crohn’s disease, ulcerative colitis, diabetes, endome-
comorbidities, including IBS, Crohn’s disease, diabetes,
triosis, gallstones, human immunodeficiency virus/acquired
immunodeficiency syndrome, pancreatitis, peptic ulcer disease, endometriosis, gallstones, peptic ulcer disease, and thyroid
and thyroid disease. disease were also more likely to experience GERD symp-
toms within the past 7 days.
Statistical Analysis
All statistical analyses were performed in Stata 13.1 (Sta- Troublesome GERD Symptoms (Modified
taCorp LP, College Station, TX). We used data from the 2010 US Montreal Definition) Among Overall Cohort
Census (age, sex) and 2015 US Census Bureau’s American We found that 13,881 (PW 18.0%) out of 71,812 in-
Community Survey (race/ethnicity) to create population dividuals met the modified Montreal definition for trouble-
weights and applied them to the sample data to produce some GERD symptoms (heartburn or regurgitation forApril 2020 Prevalence of GERD and PPI-Refractory GERD Symptoms 1253
Table 1.National GI Survey Participant Demographics from the regression on having Montreal-defined GERD
(N ¼ 71,812) symptoms. Similar to the regression on GERD symptoms in
the past 7 days, female gender, nonsingle marital status, and
Variable n Actual % PW %a
total household income level from $50,001 to $100,000 were
Age, y associated with increased odds for having Montreal-defined
18–29 23,962 33.4 26.5 GERD symptoms. However, unlike the prior analysis, only
30–39 19,284 26.9 20.8 those 30 to 49 years of age had increased odds for trouble-
40–49 11,854 16.5 15.5 some GERD symptoms vs those who were 18 to 29 years old;
50–59 10,808 15.1 15.6 no difference was seen for the 50- to 59-year-old group.
60 5904 8.2 21.5
Moreover, we also found that participants who were 60
Gender
Female 42,696 59.5 51.0 years of age had decreased odds for Montreal-defined GERD
CLINICAL AT
Male 29,116 40.5 49.0 symptoms when compared with those 18 to 29 years old. As
Race/ethnicity for race/ethnicity, non-Hispanic blacks and Asians remained
Non-Hispanic white 50,943 70.9 62.0 at lower odds for having bothersome symptoms vs non-
Non-Hispanic black 6353 8.9 12.0 Hispanic whites, whereas no differences were seen for the
Latino 8255 11.5 18.0 Latino and other racial/ethnic groups. Education level,
Asian 3914 5.5 6.0
Other 2347 3.3 2.0
although predictive of GERD symptoms in the past week, was
Education level largely not associated with Montreal-defined GERD. With
Did not graduate high school 2862 4.0 4.2 respect to specific comorbidities, those that were predictive
High school graduate 15,295 21.3 21.5 of GERD in the past week remained positively associated with
Some college 22,282 31.0 30.9 Montreal-defined GERD symptoms, with cirrhosis being a
College graduate 24,020 33.4 32.7 new addition.
Graduate degree 7353 10.2 10.7
Marital status
Single 19,120 26.6 24.5 GERD Symptom Severity Among Those Who
Divorced, separated, or widowed 8592 12.0 16.1
Married or in long-term relationship 44,100 61.4 59.4
Were Symptomatic in the Past 7 Days
Employment status We show findings from the regression on GERD PROMIS
Unemployedb 24,680 34.4 40.3 percentile scores among individuals who were symptomatic in
Employed or full-time student 47,132 65.6 59.7 the past week in Table 3. Latino and Asian individuals had
Total household income significantly higher GERD PROMIS scores vs non-Hispanic
$0–50,000 35,725 49.7 50.0 whites. Those who were nonsingle and had IBS, celiac dis-
$50,001–100,000 22,226 31.0 30.7
ease, cirrhosis, Crohn’s disease, diabetes, endometriosis, and
$100,001–200,000 7582 10.6 10.3
$200,001 1110 1.5 1.7 thyroid disease also had more severe symptoms. Moreover,
Prefer not to say 5169 7.2 7.4 individuals who reported current PPI, histamine-2 receptor
Irritable bowel syndrome 2958 4.1 3.8 blocker, and antacid use also had worse symptoms. Conversely,
Chronic idiopathic constipation 276 0.4 0.4 increasing age, male gender, and higher education levels were
Gastrointestinal cancer 407 0.6 0.8 associated with significantly lower GERD PROMIS scores.
Celiac disease 755 1.1 0.9
Cirrhosis 450 0.6 0.7
Crohn’s disease 553 0.8 0.8 GERD Medication Use
Ulcerative colitis 627 0.9 1.1
Among the 32,878 individuals who reported ever expe-
Diabetes 4508 6.3 8.6
Endometriosis 1680 2.3 2.0
riencing presumptive GERD, we had data on medication use
Gallstones 3058 4.3 4.5 from 29,274 respondents. Among the 29,274, we found that
HIV/AIDS 233 0.3 0.4 9234 individuals (PW 35.1%) were currently taking a
Pancreatitis 539 0.8 0.8 medicine to manage their symptoms. Those on therapy
Peptic ulcer disease 1172 1.6 1.7 reported taking the following: PPI, 4935 (PW 55.2%);
Thyroid disease 3483 4.9 5.2 histamine-2 receptor blocker, 2286 (PW 24.3%); antacids,
2370 (PW 24.4%); other, 217 (PW 2.6%). Table 4 lists the
AIDS, acquired immunodeficiency syndrome; HIV, human frequency of use of each medicine class. Most of those on a
immunodeficiency virus. PPI reported taking it daily (PW 68.1%), whereas more
a
PWs based on recent US Census data for age, sex, and intermittent use was noted among those using histamine-2
race/ethnicity were applied to the sample data to produce receptor blockers and antacids.
population estimates; the actual weights used in the analyses
were previously described elsewhere.13,14
b
Includes those who reported being unemployed, on disability, Persistent GERD Symptoms While on a Daily PPI
on leave of absence from work, retired, or homemaker. Among those taking a daily PPI (n ¼ 3229), 1858 (PW
54.1%) noted persistent, troublesome GERD symptoms
2 days in the past week): heartburn only, 6751 (PW 47.5%); (heartburn or regurgitation for 2 days in the past week).
both heartburn and regurgitation, 5426 (PW 39.8%); regur- Symptomatic individuals reported the following symptoms
gitation only, 1704 (PW 12.6%). Table 2 presents findings even while on a PPI: both heartburn and regurgitation, 8771254 Delshad et al Gastroenterology Vol. 158, No. 5
Table 2.Predictors of GERD Symptoms in Past 7 Days and GERD as Determined by a Modified Montreal Definition
(N ¼ 71,812)
Had GERD symptoms Had GERD symptoms using
in past 7 days modified Montreal definition
Variable (n ¼ 23,039) OR [95% CI]a (n ¼ 13,881)b OR [95% CI]a
Age, y
18–29 6215 (25.2) reference 3875 (15.6) reference
30–39 6660 (33.7) 1.34 [1.28–1.40] 4284 (21.7) 1.33 [1.25–1.40]
40–49 4364 (35.3) 1.40 [1.32–1.49] 2657 (21.4) 1.26 [1.17–1.34]
50–59 3945 (35.3) 1.33 [1.25–1.42] 2180 (19.2) 1.03 [0.95–1.10]
60 1855 (28.9) 0.98 [0.86–1.11] 885 (13.9) 0.68 [0.57–0.81]
CLINICAL AT
Gender
Female 14,575 (33.0) reference 8979 (19.8) reference
Male 8464 (28.7) 0.88 [0.83–0.93] 4902 (16.0) 0.84 [0.79–0.90]
Race/ethnicity
Non-Hispanic white 17,708 (33.8) reference 10,614 (19.4) reference
Non-Hispanic black 1413 (22.6) 0.62 [0.57–0.69] 860 (13.0) 0.68 [0.61–0.76]
Latino 2425 (30.8) 0.89 [0.79–1.00] 1569 (19.5) 1.02 [0.89–1.16]
Asian 805 (19.2) 0.53 [0.46–0.60] 411 (9.1) 0.48 [0.41–0.56]
Other 688 (28.2) 0.81 [0.72–0.92] 427 (17.5) 0.94 [0.81–1.10]
Education level
Did not graduate high school 692 (21.1) reference 487 (14.6) reference
High school graduate 4906 (31.0) 1.43 [1.24–1.64] 3078 (18.8) 1.16 [1.00–1.35]
Some college 7526 (33.0) 1.52 [1.32–1.74] 4652 (19.2) 1.15 [1.00–1.33]
College graduate 7779 (30.9) 1.33 [1.16–1.53] 4491 (17.5) 0.99 [0.85–1.15]
Graduate degree 2136 (28.5) 1.20 [1.03–1.41] 1173 (15.6) 0.90 [0.74–1.09]
Marital status
Single 4619 (23.5) reference 2665 (13.3) reference
Divorced, separated, or widowed 2957 (32.2) 1.27 [1.14–1.42] 1828 (18.3) 1.39 [1.23–1.57]
Married or in long-term relationship 15,463 (33.6) 1.35 [1.28–1.43] 9388 (19.8) 1.43 [1.34–1.52]
Employment status
Unemployedc 8390 (31.1) reference 5165 (17.6) reference
Employed or full-time student 14,649 (30.8) 1.00 [0.94–1.07] 8716 (18.2) 1.02 [0.94–1.11]
Total household income
$0–50,000 11,535 (30.4) reference 7155 (18.2) reference
$50,001–100,000 7775 (34.5) 1.12 [1.05–1.19] 4661 (20.2) 1.10 [1.02–1.18]
$100,001–200,000 2498 (32.4) 1.01 [0.93–1.10] 1400 (18.1) 0.95 [0.86–1.05]
$200,001 276 (25.3) 0.81 [0.66–0.99] 162 (14.1) 0.80 [0.64–0.99]
Prefer not to say 955 (18.6) 0.57 [0.49–0.68] 503 (8.0) 0.43 [0.38–0.50]
Irritable bowel syndrome 1590 (54.7) 2.19 [1.85–2.59] 1103 (36.3) 2.11 [1.76–2.54]
Chronic idiopathic constipation 135 (44.4) 1.24 [0.78–1.99] 110 (35.0) 1.66 [0.99–2.79]
Gastrointestinal cancer 123 (28.9) 0.85 [0.43–1.67] 91 (22.2) 1.17 [0.49–2.78]
Celiac disease 268 (33.8) 1.00 [0.82–1.22] 190 (24.2) 1.11 [0.89–1.39]
Cirrhosis 169 (37.4) 1.22 [0.89–1.69] 132 (29.4) 1.60 [1.11–2.31]
Crohn’s disease 232 (42.2) 1.34 [1.05–1.70] 183 (32.6) 1.69 [1.31–2.18]
Ulcerative colitis 257 (43.4) 1.50 [0.89–2.52] 176 (26.3) 1.34 [0.76–2.36]
Diabetes 1806 (35.3) 1.16 [1.04–1.30] 1139 (20.0) 1.14 [1.01–1.29]
Endometriosis 808 (44.6) 1.21 [1.05–1.39] 561 (30.5) 1.31 [1.13–1.51]
Gallstones 1536 (48.4) 1.63 [1.40–1.90] 1031 (31.1) 1.63 [1.37–1.94]
HIV/AIDS 67 (28.5) 0.83 [0.45–1.52] 45 (17.8) 0.77 [0.32–1.81]
Pancreatitis 270 (44.7) 1.20 [0.94–1.53] 194 (30.6) 1.28 [1.00–1.64]
Peptic ulcer disease 743 (57.0) 2.33 [1.76–3.07] 530 (38.1) 2.23 [1.79–2.77]
Thyroid disease 1,500 (40.6) 1.25 [1.10–1.42] 974 (25.0) 1.31 [1.14–1.49]
NOTE. Data are presented as n (PW %).
AIDS, acquired immunodeficiency syndrome; HIV, human immunodeficiency virus.
a
The logistic regression model included all variables listed in the table above.
b
Defined as heartburn or regurgitation occurring 2 days in the past week.
c
Includes those who reported being unemployed, on disability, on leave of absence from work, retired, or homemaker.
(PW 48.0%); heartburn only, 792 (PW 42.3%); regurgita- divorced, separated, widowed, or married, and had IBS and
tion only, 189 (PW 9.7%). Crohn’s disease had higher odds for remaining symptomatic
Table 5 presents predictors of PPI-refractory GERD while on a PPI. Conversely, those with GI cancer and
symptoms. Individuals who were younger, female, Latino, ulcerative colitis were less likely to have PPI-refractoryApril 2020 Prevalence of GERD and PPI-Refractory GERD Symptoms 1255
symptoms. No significant associations were largely seen defined GERD when compared with women. Prior data in
between persistent symptoms and concomitant use of the literature has been equivocal on this point, as some
histamine-2 receptor blockers and antacids. studies indicate a higher prevalence of GERD in men, others
in women, and others demonstrate no difference at all.30–32
Similarly, although some studies have demonstrated an
Discussion association of GERD with increasing age, other studies have
In this population-based survey, we found that GERD not.30 In our present study, we found that increasing age is
symptoms are very common in the community. More than 2 of associated with increased odds for GERD symptoms up to a
5 Americans have experienced heartburn or regurgitation in point, after which the risk decreases. Namely, when
the past, whereas nearly 1 of 3 experienced these symptoms compared to 18- to 29-year-olds, those 30 to 49 years of age
in the past week. In addition, among those managing their have a higher prevalence of troublesome, Montreal-defined
GERD symptoms, whereas those aged 60 years have a
CLINICAL AT
symptoms with a daily PPI, we found that more than half still
have persistent, troublesome GERD symptoms. lower prevalence. As for race/ethnicity, there are also mixed
Our prevalence of presumptive GERD is largely in line findings. One study showed that black individuals may
with prior estimates from other US cross-sectional and experience more heartburn and Asian individuals less
population-based studies. Namely, the prevalence of weekly heartburn as compared with white individuals,33 whereas
GERD symptoms from past studies conducted in the 1990s another study demonstrated no difference in GERD preva-
and early 2000s ranged from 18% to 28% with a sample lence among black and white individuals.8 Although our
size-weighted mean of 20%,7 whereas we found that 31% of study confirmed that Asian individuals have a lower prev-
respondents in our study reported GERD symptoms in the alence of GERD symptoms, our finding that GERD is also less
past week. Although it is difficult to make direct compari- common among non-Hispanic black vs non-Hispanic white
sons in the prevalence rates given the varying definitions of individuals is counter to prior findings.8,33 Further research
GERD and different populations,7 our data suggest that the examining the etiologies behind disparities in GERD symp-
prevalence of GERD symptoms may be increasing.22 This toms with age, gender, and race/ethnicity are needed.
increasing burden is likely related in large part to the Prior studies have demonstrated a higher prevalence of
obesity epidemic. At the time of the National GI Survey in GERD among those with IBS34–36 and diabetes,37–39 which
2015, approximately 40% of Americans were obese (as was confirmed with our study. We also found that those
compared with 30% in 1999),23,24 and obesity has been with IBS and diabetes have more severe GERD symptoms as
shown to increase the odds of GERD up to 3-fold.25–27 This measured by NIH PROMIS vs those without the disorders.
is problematic, as GERD leads to decrements in quality of Moreover, we noted a higher prevalence of GERD symptoms
life, mental health, and social function.2–4 It is also associ- among those with other comorbidities, most of which have
ated with significant health care utilization, as GERD is the not been previously reported or rigorously studied: Crohn’s
second leading physician diagnosis among the GI disorders, disease, endometriosis, and thyroid disease. Individuals
with more than 5.5 million office and emergency room visits with these diagnoses also have higher GERD PROMIS scores.
in 2014.5 Aside from determining the prevalence and predictors of
Aside from examining the prevalence of GERD symptoms GERD symptoms, we also systematically assessed medica-
in the past week, we also determined how many individuals tion use. For those managing their condition with daily PPIs,
in the community have such symptoms as determined by a we noted that 54% still have persistent GERD symptoms,
modified Montreal definition1; this allows for a more pre- which is comparable to previous observational estimates in
cise, criterion-definition of GERD. Here, we found that 18% primary care and community-based settings (45%, range
of individuals reported either heartburn or regurgitation at 30% to 60%).6 With respect to independent predictors of
least 2 days of the week, which the Global Consensus Group PPI-refractory GERD symptoms, we found that Latino
considers troublesome. The prevalence of GERD symptoms individuals are 2.44-times more likely to have persistent
using the modified Montreal definition is much higher in our symptoms while on PPIs when compared with non-Hispanic
study than a previous US population study, which found that white individuals. The reason behind this finding is unclear,
6% and 3% of respondents experienced heartburn and but may be secondary to physiologic or even cultural eti-
regurgitation, respectively, at least twice per week.9 To our ologies. Women6 and those with IBS40 have been previously
knowledge, the only other studies that used the Montreal noted to be more likely to have PPI-refractory GERD, which
definition examined non-US populations, with prevalence our study confirmed. Associations have also been found
rates of 3% and 16% in China28 and Japan,29 respectively. between PPI-refractory symptoms and stress,41 anxiety,
These rates are lower than that noted in our study, and the somatization, and functional GI disorders.42,43 The increased
true difference is likely even more pronounced, as we used a prevalence of functional and psychosomatic disorders
modified Montreal definition that did not include moderate- among women may account in part for their increased odds
to-severe symptoms of heartburn or regurgitation occurring of persistent GERD symptoms while on PPIs, as seen in our
1 day a week; our study was only able to assess for those study.43 With regard to age, a Japanese study found that
who had either symptom to any degree on 2 days a week. older age was more associated with PPI-resistance,44 which
In our study, we found a number of predictors of GERD is contrary to our findings. The higher prevalence of PPI-
symptoms. For instance, men were less likely to have had refractory GERD symptoms among younger individuals in
both GERD symptoms in the past week and Montreal- our population may again be explained by the higher1256 Delshad et al Gastroenterology Vol. 158, No. 5
Table 3.Predictors of GERD Severity Among Those Symptomatic in the Past Week (n ¼ 19,435)
GERD PROMIS
Variable percentile score (0–100)a b coefficientb P valueb
Age, y
18–29 56.7 [55.9–57.5] reference reference
30–39 55.6 [54.8–56.3] 2.52April 2020 Prevalence of GERD and PPI-Refractory GERD Symptoms 1257
Table 3. Continued
GERD PROMIS
Variable percentile score (0–100)a b coefficientb P valueb
Antacid use
Not taking 51.5 [50.7–52.2] reference reference
Less than daily use 52.6 [49.9–55.2] 4.441258 Delshad et al Gastroenterology Vol. 158, No. 5
Table 5.Predictors of Persistent GERD Symptoms Among Table 5. Continued
Those Taking a Daily PPI (n ¼ 3229)
Persistent GERD
Persistent GERD symptoms while
symptoms while on daily PPI
on daily PPI Variable (n ¼ 1858)a OR [95% CI]b
Variable (n ¼ 1858)a OR [95% CI] b
Histamine-2 receptor
Age, y blocker use
18–29 213 (64.9) reference Not taking 1789 (53.5) reference
30–39 451 (69.2) 1.18 [0.86–1.63] Less than daily use 21 (71.1) 1.52 [0.57–4.09]
40–49 448 (60.3) 0.76 [0.56–1.05] Daily use 32 (74.2) 2.37 [0.96–5.86]
50–59 481 (52.3) 0.56 [0.40–0.77] Unknown frequency 16 (70.4) 2.06 [0.66–6.41]
CLINICAL AT
60 265 (45.6) 0.46 [0.31–0.69] of use
Gender Antacid use
Female 1270 (57.6) reference Not taking 1789 (53.6) reference
Male 588 (49.4) 0.78 [0.62–0.99] Less than daily use 33 (56.7) 1.30 [0.57–2.96]
Race/ethnicity Daily use 20 (72.4) 1.81 [0.67–4.92]
Non-Hispanic white 1544 (51.1) reference Unknown frequency 16 (97.2) 29.79 [3.46–256.57]
Non-Hispanic black 92 (45.9) 0.83 [0.51–1.34] of use
Latino 150 (72.8) 2.44 [1.42–4.20]
Asian 22 (62.8) 1.13 [0.47–2.69]
Other 50 (51.7) 0.92 [0.53–1.59] NOTE. Data are presented as n (PW %).
Education level AIDS, acquired immunodeficiency syndrome; HIV, human
Did not graduate high 66 (64.7) reference immunodeficiency virus.
school
a
Defined as heartburn or regurgitation occurring 2 days in
High school graduate 444 (53.9) 0.66 [0.33–1.29] the past week among those on a daily PPI.
b
Some college 634 (55.7) 0.73 [0.37–1.41] The logistic regression model included all variables listed in
College graduate 550 (51.9) 0.62 [0.32–1.22] the table above.
c
Graduate degree 164 (52.1) 0.67 [0.30–1.46] Includes those who reported being unemployed, on
Marital status disability, on leave of absence from work, retired, or
Single 245 (52.4) reference homemaker.
Divorced, separated, 349 (55.9) 1.55 [1.05–2.29]
or widowed any discrepancies would be consistent with misclassifications
Married or in long- 1264 (53.7) 1.37 [1.02–1.84] made in clinical practice where a diagnosis of GERD is typi-
term relationship cally based on patient-reported symptoms without confir-
Employment status matory, objective pH or impedance testing. Along the same
Unemployedc 923 (49.7) reference lines, there may have been misclassification since our GI
Employed or full-time 935 (59.9) 1.27 [0.96–1.67]
symptom screener question solely defined GERD as “heart-
student
Total household burn, acid reflux, or gastroesophageal reflux” and did not
income specifically mention regurgitation. Although some re-
$0–50,000 1013 (57.5) reference spondents may have equated “gastroesophageal reflux” with
$50,001–100,000 584 (53.5) 0.81 [0.61–1.07] regurgitation, we nonetheless may have underestimated the
$100,001–200,000 180 (48.7) 0.65 [0.45–0.93] prevalence of GERD, particularly for those who only experi-
$200,001 24 (57.4) 0.94 [0.40–2.22] ence regurgitation symptoms. Another limitation is that we
Prefer not to say 57 (33.9) 0.41 [0.24–0.69]
did not assess whether respondents were taking PPIs
Irritable bowel 263 (62.8) 1.39 [1.03–1.88]
syndrome correctly (ie, 30–60 minutes before a meal), whether use of
Chronic idiopathic 41 (64.7) 1.17 [0.45–3.05] the PPI was guided by a physician or was self-administered
constipation (ie, over-the-counter), or if they engaged in lifestyle modifi-
Gastrointestinal cancer 12 (23.7) 0.21 [0.09–0.48] cations; this may have led to an overestimation of PPI-
Celiac disease 25 (64.2) 0.98 [0.39–2.48] refractory symptoms. Finally, our study did not collect data
Cirrhosis 20 (44.6) 0.68 [0.31–1.48]
on some demographic and lifestyle factors that can affect
Crohn’s disease 47 (86.1) 5.16 [2.22–12.00]
Ulcerative colitis 35 (42.0) 0.49 [0.28–0.87]
GERD symptom prevalence, such as body mass index, waist
Diabetes 254 (48.9) 0.83 [0.61–1.14] circumference, and alcohol and tobacco use; this will be
Endometriosis 120 (57.1) 0.95 [0.60–1.51] addressed in our forthcoming National GI Survey 2. We also
Gallstones 226 (54.9) 1.02 [0.68–1.51] did not examine the impact of GERD symptoms on quality of
HIV/AIDS 10 (54.9) 2.20 [0.17–28.97] life or health care utilization, as the primary goal of the Na-
Pancreatitis 50 (58.7) 1.27 [0.65–2.46] tional GI Survey was to assess the prevalence and distribution
Peptic ulcer 157 (60.1) 1.19 [0.82–1.73]
of the 8 cardinal GI symptoms. Further research updating our
disease
Thyroid disease 215 (55.3) 1.23 [0.86–1.75] understanding of the burden imposed by GERD is warranted.
In conclusion, in this large population-based survey of
community-dwelling Americans, we found that GERDApril 2020 Prevalence of GERD and PPI-Refractory GERD Symptoms 1259
symptoms are very common, with 2 of 5 having ever had 10. The Henry J; Kaiser Family Foundation. Population
such symptoms in the past and 1 of 3 experiencing symp- distribution by race/ethnicity. 2017. Available at: http://
toms in the past week. We also found an uneven distribution kff.org/other/state-indicator/distribution-by-raceethnicity/
of GERD symptoms, as women, non-Hispanic white in- ?currentTimeframe¼0&sortModel¼%7B%22colId%22:%
dividuals, and those with comorbidities such as IBS, Crohn’s 22Location%22,%22sort%22:%22asc%22%7D. Accessed
disease, diabetes, and endometriosis, among others, are June 26, 2019.
more likely to be symptomatic. In addition, we noted that 11. Neumann CS, Cooper BT. Ethnic differences in gastro-
more than half of those on daily PPI therapy continue to oesophageal reflux disease. Eur J Gastroenterol
experience persistent heartburn and/or regurgitation Hepatol 1999;11:735–739.
symptoms. Because of the significant impact of GERD on 12. Almario CV, Almario AA, Cunningham ME, et al. Old
quality of life and its considerable economic burden, further farts - fact or fiction? Results from a population-based
survey of 16,000 Americans examining the association
CLINICAL AT
research is needed to further explore these associations, as
well as guide the development of novel therapies for those between age and flatus. Clin Gastroenterol Hepatol
with PPI-refractory GERD symptoms. 2017;15:1308–1310.
13. Almario CV, Ballal ML, Chey WD, et al. Burden of
gastrointestinal symptoms in the United States: results
of a nationally representative survey of over 71,000
Supplementary Material Americans. Am J Gastroenterol 2018;113:1701–1710.
Note: To access the supplementary material accompanying 14. Menees SB, Almario CV, Spiegel BMR, et al. Preva-
this article, visit the online version of Gastroenterology at lence of and factors associated with fecal incontinence:
www.gastrojournal.org, and at https://doi.org/10.1053/j. results from a population-based survey. Gastroenter-
gastro.2019.12.014. ology 2018;154:1672–1681.e3.
15. Shah ED, Almario CV, Spiegel BMR, et al. Lower and
upper gastrointestinal symptoms differ between in-
References dividuals with irritable bowel syndrome with constipation
1. Vakil N, van Zanten SV, Kahrilas P, et al. The Montreal or chronic idiopathic constipation. J Neurogastroenterol
definition and classification of gastroesophageal reflux Motil 2018;24:299–306.
disease: a global evidence-based consensus. Am J 16. Almario CV, Chey W, Kaung A, et al. Computer-gener-
Gastroenterol 2006;101:1900–1920; quiz 1943. ated vs. physician-documented history of present illness
2. Eslick GD, Talley NJ. Gastroesophageal reflux disease (HPI): results of a blinded comparison. Am J Gastro-
(GERD): risk factors, and impact on quality of life-a enterol 2015;110:170–179.
population-based study. J Clin Gastroenterol 2009; 17. Nagaraja V, Hays RD, Khanna PP, et al. Construct validity of
43:111–117. the Patient-Reported Outcomes Measurement Information
3. Ofman JJ. The economic and quality-of-life impact of System gastrointestinal symptom scales in systemic scle-
symptomatic gastroesophageal reflux disease. Am J rosis. Arthritis Care Res (Hoboken) 2014;66:1725–1730.
Gastroenterol 2003;98:S8–S14. 18. Spiegel BM. Patient-reported outcomes in gastroenter-
4. Revicki DA, Wood M, Maton PN, et al. The impact of ology: clinical and research applications.
gastroesophageal reflux disease on health-related qual- J Neurogastroenterol Motil 2013;19:137–148.
ity of life. Am J Med 1998;104:252–258. 19. Spiegel BM, Hays RD, Bolus R, et al. Development of the
5. Peery AF, Crockett SD, Murphy CC, et al. Burden and NIH Patient-Reported Outcomes Measurement Infor-
cost of gastrointestinal, liver, and pancreatic diseases in mation System (PROMIS) gastrointestinal symptom
the United States: update 2018. Gastroenterology 2019; scales. Am J Gastroenterol 2014;109:1804–1814.
156:254–272.e11. 20. HealthMeasures. Obtain & administer measures.
6. El-Serag H, Becher A, Jones R. Systematic review: 2018. Available at: http://www.healthmeasures.net/
persistent reflux symptoms on proton pump inhibitor explore-measurement-systems/promis/obtain-admini-
therapy in primary care and community studies. Aliment ster-measures. Accessed July 17, 2018.
Pharmacol Ther 2010;32:720–737. 21. Howden LM, Meyer JA. Age and sex composition: 2010.
7. El-Serag HB, Sweet S, Winchester CC, et al. Update on 2011. Available at: http://www.census.gov/prod/cen2010/
the epidemiology of gastro-oesophageal reflux disease: briefs/c2010br-03.pdf. Accessed September 13, 2016.
a systematic review. Gut 2014;63:871–880. 22. El-Serag HB. Time trends of gastroesophageal reflux
8. El-Serag HB, Petersen NJ, Carter J, et al. disease: a systematic review. Clin Gastroenterol Hepatol
Gastroesophageal reflux among different racial groups in 2007;5:17–26.
the United States. Gastroenterology 2004;126:1692– 23. Hales CM, Fryar CD, Carroll MD, et al. Trends in obesity
1699. and severe obesity prevalence in US youth and adults by
9. Camilleri M, Dubois D, Coulie B, et al. Prevalence and sex and age, 2007–2008 to 2015–2016. JAMA 2018;
socioeconomic impact of upper gastrointestinal disor- 319:1723–1725.
ders in the United States: results of the US Upper 24. Flegal KM, Carroll MD, Ogden CL, et al. Prevalence and
Gastrointestinal Study. Clin Gastroenterol Hepatol 2005; trends in obesity among US adults, 1999–2008. JAMA
3:543–552. 2010;303:235–241.1260 Delshad et al Gastroenterology Vol. 158, No. 5
25. El-Serag HB, Graham DY, Satia JA, et al. Obesity is an 41. Wright CE, Ebrecht M, Mitchell R, et al. The effect of
independent risk factor for GERD symptoms and psychological stress on symptom severity and percep-
erosive esophagitis. Am J Gastroenterol 2005; tion in patients with gastro-oesophageal reflux.
100:1243–1250. J Psychosom Res 2005;59:415–424.
26. Locke GR 3rd, Talley NJ, Fett SL, et al. Risk factors 42. Guillemot F, Ducrotte P, Bueno L. Prevalence of func-
associated with symptoms of gastroesophageal reflux. tional gastrointestinal disorders in a population of
Am J Med 1999;106:642–649. subjects consulting for gastroesophageal reflux disease
27. Corley DA, Kubo A. Body mass index and gastro- in general practice. Gastroenterol Clin Biol 2005;29:243–
esophageal reflux disease: a systematic review and 246.
meta-analysis. Am J Gastroenterol 2006;101:2619–2628. 43. Drossman DA, Li Z, Andruzzi E, et al. U.S. householder
28. He J, Ma X, Zhao Y, et al. A population-based survey of survey of functional gastrointestinal disorders. Preva-
the epidemiology of symptom-defined gastroesophageal lence, sociodemography, and health impact. Dig Dis Sci
CLINICAL AT
reflux disease: the Systematic Investigation of Gastroin- 1993;38:1569–1580.
testinal Diseases in China. BMC Gastroenterol 2010;10:94. 44. Takeshima F, Hashiguchi K, Onitsuka Y, et al. Clinical
29. Ohara S, Kawano T, Kusano M, et al. Survey on the characteristics of patients with gastroesophageal reflux
prevalence of GERD and FD based on the Montreal disease refractory to proton pump inhibitors and the
definition and the Rome III criteria among patients pre- effects of switching to 20 mg esomeprazole on reflux
senting with epigastric symptoms in Japan. symptoms and quality of life. Med Sci Monit 2015;
J Gastroenterol 2011;46:603–611. 21:4111–4121.
30. Rubenstein JH, Chen JW. Epidemiology of gastro- 45. Asaoka D, Nagahara A, Hojo M, et al. Efficacy of a
esophageal reflux disease. Gastroenterol Clin North Am potassium-competitive acid blocker for improving
2014;43:1–14. symptoms in patients with reflux esophagitis,
31. Yaseri HF. Gender is a risk factor in patients with non-erosive reflux disease, and functional dyspepsia.
gastroesophageal reflux disease. Med J Islam Repub Biomed Rep 2017;6:175–180.
Iran 2017;31:58. 46. Hoshino S, Kawami N, Takenouchi N, et al. Efficacy of
32. Kim YS, Kim N, Kim GH. Sex and gender differences in vonoprazan for proton pump inhibitor-resistant reflux
gastroesophageal reflux disease. J Neurogastroenterol esophagitis. Digestion 2017;95:156–161.
Motil 2016;22:575–588. 47. Vaezi M, Fass R, Reasner D, et al. IW-3718, a novel
33. Spechler SJ, Jain SK, Tendler DA, et al. Racial differ- gastric-retentive bile acid sequestrant, improved
ences in the frequency of symptoms and complications symptoms of refractory GERD in a double-blind, pla-
of gastro-oesophageal reflux disease. Aliment Pharma- cebo-controlled phase 2a study. Am J Gastroenterol
col Ther 2002;16:1795–1800. 2015;110:S-708.
34. Lee SY, Lee KJ, Kim SJ, et al. Prevalence and risk factors 48. Vaezi MF, Fass R, Vakil N, et al. 875-IW-3718, a novel
for overlaps between gastroesophageal reflux disease, gastric-retentive bile acid sequestrant, improved heart-
dyspepsia, and irritable bowel syndrome: a population- burn and regurgitation symptoms in patients with
based study. Digestion 2009;79:196–201. persistent GERD despite PPI treatment: a double-blind,
35. Talley NJ, Dennis EH, Schettler-Duncan VA, et al. Over- placebo-controlled study. Gastroenterology 2018;
lapping upper and lower gastrointestinal symptoms in 154:S-174.
irritable bowel syndrome patients with constipation or 49. Almario CV, Chey WD, Iriana S, et al. Computer versus
diarrhea. Am J Gastroenterol 2003;98:2454–2459. physician identification of gastrointestinal alarm features.
36. Whitehead WE, Palsson O, Jones KR. Systematic review Int J Med Inform 2015;84:1111–1174.
of the comorbidity of irritable bowel syndrome with other 50. Pew Research Center. Internet/broadband fact sheet.
disorders: what are the causes and implications? 2017. Available at: http://www.pewinternet.org/fact-
Gastroenterology 2002;122:1140–1156. sheet/internet-broadband/. Accessed December 7,
37. Fujiwara Y, Arakawa T. Epidemiology and clinical char- 2017.
acteristics of GERD in the Japanese population.
J Gastroenterol 2009;44:518–534.
38. Natalini J, Palit A, Sankineni A, et al. Diabetes mellitus is
an independent risk for gastroesophageal reflux disease Author names in bold designate shared co-first authorship.
among urban African Americans. Dis Esophagus 2015; Received July 1, 2019. Accepted December 10, 2019.
28:405–411.
Correspondence
39. Sun X-M, Tan J-C, Zhu Y, et al. Association between Address correspondence to: Brennan M.R. Spiegel, MD, MSHS, Cedars-Sinai
diabetes mellitus and gastroesophageal reflux disease: a Medical Center, Cedars-Sinai Center for Outcomes Research and Education
meta-analysis. World J Gastroenterol 2015;21:3085. (CS-CORE), Health Services Research, Cedars-Sinai Health System, 116
North Robertson Boulevard, 8th Floor, Los Angeles, California 90048. e-mail:
40. Monnikes H, Heading RC, Schmitt H, et al. Influence of Brennan.Spiegel@cshs.org.
irritable bowel syndrome on treatment outcome in
Acknowledgments
gastroesophageal reflux disease. World J Gastroenterol Author contributions: Sean D. Delshad: study design; analysis and
2011;17:3235–3241. interpretation of data; drafting of the manuscript; critical revision of theApril 2020 Prevalence of GERD and PPI-Refractory GERD Symptoms 1261
manuscript for important intellectual content. Christopher V. Almario: study Christopher V. Almario has a stock option grant in My Total Health. Sean D.
concept and design; acquisition of data; analysis and interpretation of data; Delshad discloses no conflicts.
statistical analysis; drafting of the manuscript; critical revision of the
manuscript for important intellectual content; administrative, technical, or Funding
material support; study supervision. William D. Chey: study concept and This study was funded by Ironwood Pharmaceuticals. The study sponsor
design; analysis and interpretation of data; drafting of the manuscript; critical did not have a role in the collection, analysis, or interpretation of data, or
revision of the manuscript for important intellectual content; study drafting of the manuscript. The Cedars-Sinai Center for Outcomes
supervision. Brennan M.R. Spiegel: study concept and design; analysis and Research and Education (CS-CORE) is supported by The Marc and
interpretation of data; drafting of the manuscript; critical revision of the Sheri Rapaport Fund for Digital Health Sciences & Precision Health.
manuscript for important intellectual content; study supervision. Christopher V. Almario was supported by a career development award
from the American College of Gastroenterology. Christopher V. Almario
Conflicts of interest and Brennan M.R. Spiegel are supported by National Institutes of
Brennan M.R. Spiegel and William D. Chey are consultants for Ironwood Health/National Center for Advancing Translational Science (NCATS)
Pharmaceuticals and patent holders and principals at My Total Health. UCLA CTSI Grant UL1TR001881.
CLINICAL AT1261.e1 Delshad et al Gastroenterology Vol. 158, No. 5
Supplementary Material 6. In the past 7 days, how often did you feel like there was
too much saliva in your mouth?
National GI Survey questions related to heartburn, acid
reflux, or gastroesophageal reflux. o Never
o Rarely
NIH GERD PROMIS questions
o Sometimes
1. In the past 7 days, how often did you have regur-
gitation—that is, food or liquid coming back into your o Often
throat or mouth without vomiting?
o Always
o Never / If Never, go to #5 7. In the past 7 days, how often did you feel burning in the
o One day red area shown in the picture (behind the breastbone)?
o 2–6 days
o Once a day
o More than once a day
2. In the past 7 days, what was the most liquid or food that
came back up into your mouth at one time?
o None came into my mouth
o Enough to fill a little of my mouth
o Enough to fill some of my mouth
o Enough to fill most of my mouth
o So much that it filled my entire mouth
3. In the past 7 days, after eating a meal, how often did food or
liquid come back into your throat or mouth without
vomiting?
o Never
o Rarely o Never
o Sometimes o One day
o Often o 2–6 days
o Always o Once a day
4. In the past 7 days, how often did you re-swallow food o More than once a day
that came back into your throat? 8. In the past 7 days, how often did you feel burning in
o Never your throat?
o Rarely o Never
o Sometimes o Rarely
o Often o Sometimes
o Always o Often
5. In the past 7 days, how often did you feel like you were o Always
going to burp but food or liquid came up instead? 9. In the past 7 days, how often did you burp?
o Never o Never / If Never, go to #11
o One day o One day
o 2–6 days o 2–6 days
o Once a day o Once a day
o More than once a day o More than once a dayApril 2020 Prevalence of GERD and PPI-Refractory GERD Symptoms 1261.e2
10. In the past 7 days, how much did burping bother you? GERD medication questions
o Not at all 1. Please select the names of any medications you are
CURRENTLY taking for your heartburn/reflux symptoms.
o A little bit
Please select all that apply.
o Somewhat
o Prilosec (omeprazole)
o Quite a bit
o Protonix (pantoprazole)
o Very much
o Prevacid (lansoprazole)
11. In the past 7 days, how often did you have hiccups?
o Nexium (esomeprazole)
o Never
o Dexilant (dexlansoprazole)
o Rarely
o Aciphex (rabeprazole)
o Sometimes
o Tagamet (cimetidine)
o Often
o Pepcid AC (famotidine)
o Very often
12. In the past 7 days, how often did you feel like there was o Zantac (ranitidine)
a lump in your throat? o Antacids (Tums, Rolaids, Mylanta, Maalox)
o Never / If Never, finish questionnaire o Other (please specify)
o Rarely o I am not currently taking any medications for heart-
o Sometimes burn/reflux
o Often 2. For each of the following medication(s) that you are
taking for heartburn/reflux how frequently do you take
o Very often
each one?
13. In the past 7 days, how much did having a lump in your
throat bother you? o Every few months
o Not at all o Few times a month
o A little bit o Once a week
o Somewhat o 2 to 3 days per week
o Quite a bit o 4 to 6 days per week
o Very much o DailyYou can also read