Classification of rat mammary carcinoma with large scale in vivo microwave measurements
←
→
Page content transcription
If your browser does not render page correctly, please read the page content below
www.nature.com/scientificreports
OPEN Classification of rat mammary
carcinoma with large scale in vivo
microwave measurements
Emre Onemli1,2*, Sulayman Joof1,2, Cemanur Aydinalp1, Nural Pastacı Özsobacı3,
Fatma Ateş Alkan4, Nuray Kepil5, Islem Rekik6, Ibrahim Akduman1,2 & Tuba Yilmaz1,2
Mammary carcinoma, breast cancer, is the most commonly diagnosed cancer type among
women. Therefore, potential new technologies for the diagnosis and treatment of the disease are
being investigated. One promising technique is microwave applications designed to exploit the
inherent dielectric property discrepancy between the malignant and normal tissues. In theory, the
anomalies can be characterized by simply measuring the dielectric properties. However, the current
measurement technique is error-prone and a single measurement is not accurate enough to detect
anomalies with high confidence. This work proposes to classify the rat mammary carcinoma, based
on collected large-scale in vivo S11 measurements and corresponding tissue dielectric properties with
a circular diffraction antenna. The tissues were classified with high accuracy in a reproducible way by
leveraging a learning-based linear classifier. Moreover, the most discriminative S11 measurement was
identified, and to our surprise, using the discriminative measurement along with a linear classifier an
86.92% accuracy was achieved. These findings suggest that a narrow band microwave circuitry can
support the antenna enabling a low-cost automated microwave diagnostic system.
Inherent dielectric property discrepancy between the malignant breast tumors and healthy breast tissues at
microwave frequencies1,2 has fueled the research in development of microwave imaging and hyperthermia
applications3,4, while potential other use of microwaves, such as microwave surgical margin detection and micro-
wave biopsy, remains overlooked. Currently, both diagnostics applications are based on pathology and performed
by specialists. Thus, these processes are costly and prone to human error, particularly biopsy suffers from low
success rates for detection of ductal breast c arcinoma5.
Circular diffraction a ntenna6, commonly referred as the open-ended coaxial probe, can be utilized for both
pathological applications either as a complimentary or sole diagnosis technique. In theory, this can be realized
simply by measuring the dielectric property discrepancy between healthy and malignant tissues. Ultimately, the
practical applications, such as microwave biopsy probe, of open-ended coaxial probes was previously envisioned
in the literature7. However, the proposed applications was not followed with the necessary research and devel-
opment to realize the potential practical applications of open-ended coaxial probes. Inherently high error rates
are the primary limitation of the technique preventing the transition from laboratory to the clinical practice.
Therefore, open-ended coaxial probes are currently only commercially available for laboratory use and mostly
utilized for dielectric property characterization to enable the development of many other microwave based appli-
cations. Commercially available kits reports a measurement error of 5% for laboratory use, while it is reported
in the literature that the measurement error can be as high as 30% for an in vivo practical measurement setting8.
There are a number of error sources contributing the high measurement error rates which can be categorized
as system, user, and sample related errors. System related errors include mathematical approach, calibration and
probe deterioration. Particularly, dielectric properties are not directly measurable quantities; thus, derived from
other measurable quantities namely S-parameters. For open-ended coaxial probes S11 response is used; there-
fore, S-parameter refers to S11 response through this paper. Each mathematical approach has its own limitations
including but not limited to inability to converge and narrow band applicability9. The user related errors include
1
Department of Electronics and Communication Engineering, Istanbul Technical University, Istanbul 34469,
Turkey. 2Mitos Medical Technologies, ITU Ayazaga Ari Teknokent 2-B Block 2-2-E, Maslak, Istanbul 34469,
Turkey. 3Department of Biophysics, Cerrahpasa Medical School, Istanbul University-Cerrahpasa, Istanbul 34098,
Turkey. 4Department of Biophysics, Medical School, Beykent University, Istanbul 34520, Turkey. 5Department
of Pathology, Cerrahpasa Medical School, Istanbul University-Cerrahpasa, Istanbul 34098, Turkey. 6Faculty of
Computer and Informatics Engineering, Istanbul Technical University, Istanbul 34469, Turkey. *email: onemli17@
itu.edu.tr
Scientific Reports | (2022) 12:349 | https://doi.org/10.1038/s41598-021-03884-7 1
Vol.:(0123456789)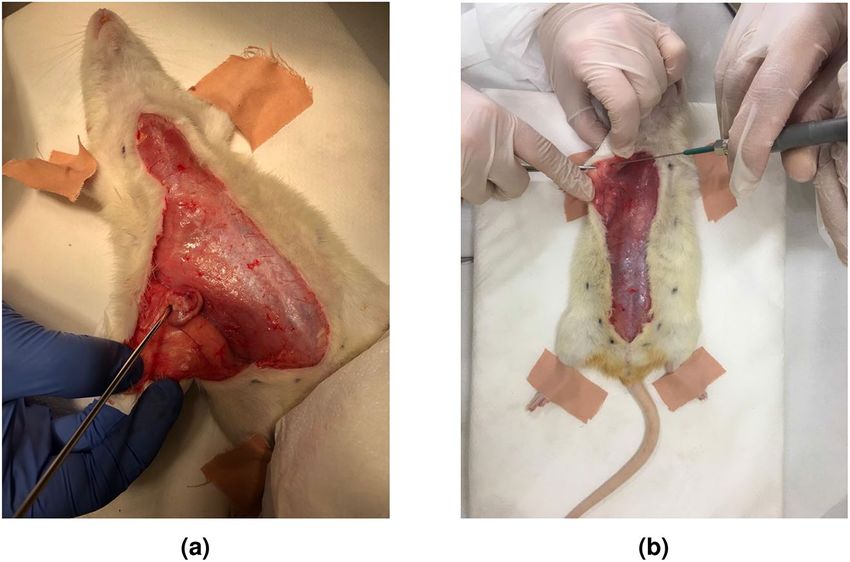
www.nature.com/scientificreports/
cable movements, applied pressure, and inconsistent calibration or measurement p ractices10. Yet another error
source is sample related measurements including changing sample temperature and sample h eterogeneity11.
These error sources are usually managed by collecting multiple measurements from a sample in a laboratory
setting following the best measurement practices. However, to realize a microwave surgical margin detection or
microwave biopsy device, single and high accuracy measurements must be collected from the biological tissues
in an in vivo clinical setting. Therefore, there is a need to address the error sources to enable the microwave
diagnostic and therapeutic applications of the open-ended coaxial probes.
Dielectric properties of the breast carcinoma were investigated in several studies. Cho et al. measured the
xenografted breast carcinoma tissues on nude mice using an insertion-type planar p robe12. The study reported
97% accuracy; however, the invasive characteristic of this probe type is not suitable for surgical margin detection.
Additionally, this work did not integrate automated decision making mechanisms. Kim and Pack designed a
sample holder placed between two ports13. The reported study is not suitable for in vivo tissue characterization.,
Martellosio et al. measured dielectric properties of breast tissue samples obtained from breast surgeries using
open-ended coaxial probe technique. Reported study is limited to ex vivo measurements and 80% classifica-
tion accuracy14. A similar study was conducted by Cheng and Fu on ex vivo human breast t issues15. Yet, the
reported work is limited to statistical analysis. Although the reported studies contribute to the dielectric property
knowledge of breast tissues, both in vivo dielectric properties and S-parameter reponses have not been analyzed
extensively in the literature.
To this end, this work investigates (1) the effectiveness of linear classifiers to categorize the in vivo dielectric
property data collected from the malignant and healthy rat mammary tissues, (2) the possibility of utilizing
S-parameter response of open-ended coaxial probe for rat mammary tissue categorization with linear classifiers,
(3) identifying the most significant S-parameter response with respect to frequency using feature selection, (4)
tissue categorization with the most discriminative S-parameter response using a linear classifier. Towards these
goals, dielectric property and S11 response of open-ended coaxial probe was measured with in vivo healthy and
chemically induced malignant rat mammary tissues from 0.5 to 6 GHz. Briefly, S11 response is a measure of power
delivered to the radiating element, in this work the probe. It is known that the S11 response is partly dependent
on the dielectric properties of the environment terminating the probe’s open end. Collected S11 responses from
healthy and malignant tissues were classified with Support Vector Machines (SVM) algorithm. Next, S11 responses
were used to perform a feature selection (FS) algorithm to select the best features discerning two classes namely
malignant and healthy. To the best of authors’ knowledge, this is the first study presenting large scale in vivo rat
mammary tissue dielectric properties, the corresponding S-parameter responses, their classification results and
lastly classification with a real S-parameter response at a single frequency. The most significant contributions
of this work are two folds:
• we show that tissue classification can be performed by only using S11 response,
• a single frequency measurement is adequate for accurate classification.
These contributions suggest that a low-cost microwave surgical margin detection or microwave biopsy device
that is able to perform accurate autonomous detection of malignant breast tissues can be developed. Remainder of
this paper is organized as follows: the results are given in “Results” section, discussions are given in “Discussion”
section, the experimental design including measurement sample preparation and experimental setup is presented
in “Animals” section and “Experimental setup” section, measurement steps are given in “In vivo measurements”
section, pathological analysis criteria are presented in “Pathological analysis” section and lastly data processing
approaches are given in “Data processing” section.
Results
This section reports the dielectric properties and corresponding S-parameters collected from the in vivo rat
mammary tissues using open-ended coaxial probes along with the classification results of these quantities. Meas-
urements were performed between 0.5 GHz and 6 GHz, where the optimal trade-off is acquired between tissue
attenuation and spatial resolution particularly in microwave imaging of biological t issues16. Next, the obtained
tissue dielectric property data were classified using the SVM method. The performance of the classification
model for different data combinations were compared. Classification was also performed using the S-parameter
responses. Also, performance of the classification algorithm was investigated at narrow band frequencies using
the feature selection method on S-parameter data.
In vivo microwave dielectric properties. Dielectric properties were collected from healthy rat breast
tissues of 5 animals and malignant rat breast tumors of 5 animals. A total of 650 measurements with 325 meas-
urements from each group were utilized for the following analysis. Means of dielectric property measurement
values obtained from healthy and malignant tissues along with the error bar denoting the standard deviation
are shown in Fig. 1a,b for relative permittivity and conductivity, respectively. The difference between mean rela-
tive permittivity measurements of healthy and malignant rat breast tissues are 8.98 and 10.43 at 0.5 and 6 GHz,
respectively. Difference between mean conductivity measurements of malignant and healthy tissues are 0.343
and 1.136 at 0.5 and 6 GHz, respectively. Two-way analysis of variance (ANOVA) method was implemented on
collected dielectric property data for malignant and healthy rat breast tissues with 0.05 ( α) significance level.
Statistically significant differences were found between two groups since p-value ≤ α where p-value stands for
the probability value.
Collected dielectric property data are separated into three dataset: (1) real part of relative permittivity (εr )
with 101 features, (2) conductivity (σ (S/m)) with 101 features, (3) complex relative permittivity (ε∗=εr+jε′′) also
Scientific Reports | (2022) 12:349 | https://doi.org/10.1038/s41598-021-03884-7 2
Vol:.(1234567890)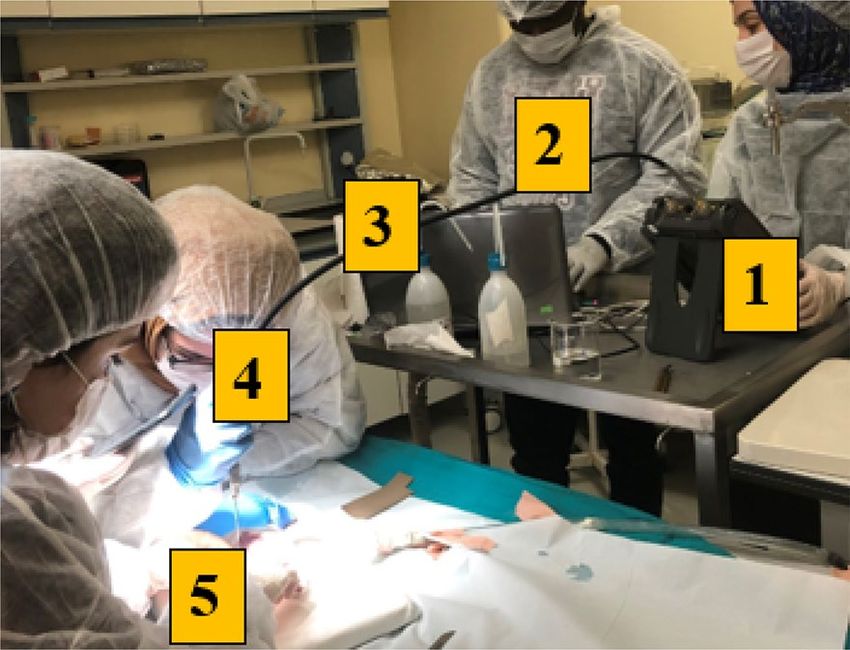
www.nature.com/scientificreports/
60
100 100 100
Healthy Tissues
95 5 Fold 95 5 Fold 95 5 Fold
Malignant Tissues
10 Fold 10 Fold
90 90 90 10 Fold
ACC (%)
50
ACC (%)
ACC (%)
85 LOO
r 85 LOO 85 LOO
40 80 80 80
75 75 75
30 70 70 70
65 65 65
0 2 4 6 Linear RBF Linear RBF Linear RBF
Frequency (GHz) Relative Permittivity Raw Data Relative Permittivity Log Data Combined Raw Data
(a) (c) (e) (g)
6 100 100 100
Healthy Tissues
95
5 Fold 95 5 Fold 95 5 Fold
Malignant Tissues
90
10 Fold 90 10 Fold 90 10 Fold
ACC (%)
ACC (%)
ACC (%)
(S/m)
4 LOO LOO LOO
85 85 85
80 80 80
2 75 75 75
70 70 70
65 65 65
0
0 2 4 6 Linear RBF Linear RBF Linear RBF
Frequency (GHz) Conductivity Raw Data Conductivity Log Data Combined Log Data
(b) (d) (f) (h)
Figure 1. Classification results of the rat mammary carcinoma using three datasets derived from the
microwave in vivo dielectric properties from 0.5 to 6 GHz. (a) Measured mean relative permittivities along
with standard deviation from the mean (std) of healthy and malignant rat mammary tissues. (b) Measured
mean conductivities along with std of healthy and malignant rat mammary tissues. (c) Classification accuracy
(ACC) comparison of the Support Vector Machines (SVM) algorithm with linear and Radial Basis Function
(RBF) kernels applied to raw relative permittivity data using different cross-validation (CV) schemes. (d) ACC
comparison of the SVM algorithm with linear and RBF kernels applied to raw conductivity data using different
CV schemes. (e) ACC comparison of the SVM with linear and RBF kernels applied to logarithm of the relative
permittivity data using different CV schemes. (f) ACC comparison of the SVM algorithm with linear and RBF
kernels applied to logarithm of the raw conductivity data using different CV schemes. (g) ACC comparison
of the SVM with linear and RBF kernels applied to raw complex relative permittivity (combined) data using
different CV schemes. (h) ACC comparison of the SVM with linear and RBF kernels applied to logarithm of the
complex relative permittivity (combined) data using different CV schemes.
referred as combined data with 202 features. The real part of permittivity represents the ability of the material
to store the electromagnetic energy and imaginary part represents the loss of the material. Conductivity (σ ) is
obtained simply by multiplying the imaginary part with angular frequency (omega (rad/s)) and permittivity of
free space (ε0 (F/m)) (σ =ωε0 ε′′ (S/m)).
Classification with in vivo dielectric property measurements. SVM algorithm was used for clas-
sification of all three dielectric property data. To evaluate the performances of learning algorithms different data
pre-processing methods were used. We also propose to use multiple cross-validation (CV) schemes, including
5-fold, 10-fold, and leave-one-out (LOO) CV, to ensure the reproducibility of the obtained results. Raw and loga-
rithm of the data were used independently while utilizing linear and Radial Basis Function (RBF) kernels. Note
that the logarithm of the data was used as a pre-processing step. Performance was evaluated via implementing
alternative combinations of (5-fold linear, 10-fold linear, LOO linear, 5-fold RBF, 10-fold RBF and LOO RBF)
CVs with two kernel functions.
Comparisons of the obtained accuracy results for raw data are shown in Fig. 1c,d. Furthermore, the accu-
racy of pre-processed logarithm data was compared as shown in Fig. 1e,f. Finally, combined data performances
were analyzed: relative permittivity and conductivity for raw data and logarithm data as shown in Fig. 1g,h,
respectively. It can be clearly seen that linear SVM outperformed to RBF. Moreover, no significant difference was
observed between CV schemes. The consistency of the accuracies obtained from different CV schemes ensures
that the model is not under or overfitting the data. 10-fold and LOO have slightly better performance compared
to 5-fold CV. Best results with 100% Accuracy obtained by using a combination of raw relative permittivity data
with SVM linear kernel and raw complex relative permittivity data with SVM linear kernel. From these results
it can be concluded that relative permittivity data is more discriminative than the conductivity data when used
with a linear kernel. It should also be noted that the classifier gives reproducible results for all CV schemes. In
the conductivity data linear and RBF kernels gives consistently close results. However, in raw relative permit-
tivity and complex relative permittivity data the linear kernel outperforms the RBF kernel. With logarithmic
pre-processing of the relative permittivity data the linear kernel accuracy decreases and RBF kernel accuracy
increases, which indicates that the raw relative permittivity data is linearly separated.
In vivo S‑parameter responses. S11 response represents the return loss at the aperture of the probe. The
term S-parameter and S11 are used interchangeably in this paper. S11 based classification targets elimination of
Scientific Reports | (2022) 12:349 | https://doi.org/10.1038/s41598-021-03884-7 3
Vol.:(0123456789)www.nature.com/scientificreports/
1 94 93
Log SVM-Linear
5 Fold
91 Log SVM-RBF
Real(S11 )
ACC (%)
92 10 Fold
ACC (%)
0.5 89
LOO
Healthy Tissues 90
87
Malignant Tissues
0
88 85
0 2 4 6 Raw-Linear Raw-RBF Log-Linear Log-RBF 10 20 30 40 50 60 70 80 90 100
Frequency (GHz) Number of S11 responses
(a) (c) (e)
1 94 88
Log SVM-Linear
92 Log SVM-RBF
ACC (%)
ACC (%)
Raw SVM-Linear 86
90
Im(S11 )
0.5 Raw SVM-RBF
88 84
Healthy Tissues Log SVM-Linear
86
Malignant Tissues Log SVM-RBF
0 84 82
0 2 4 6 202 100 50 1 2 3 4 5 6 7 8 9 10
Frequency (GHz) Number of S11 responses Number of S11 responses
(b) (d) (f)
Figure 2. Classification pipeline of the rat mammary carcinoma, from data acquisition to analysis. (a) Real
part of the antenna S11 response when terminated with in vivo rat mammary tissues. (b) Imaginary part of the
antenna S11 response when terminated with in vivo rat mammary tissues. (c) Accuracy (ACC) comparison of
the Support Vector Machines (SVM) with linear and Radial Basis Function (RBF) kernels applied to raw and
logarithm of the raw data (S11 response) using different cross-validation (CV) schemes. (d) ACC comparison
for all 202, first 100, and first 50 S11 response (features) for raw and logarithm of raw data with SVM algorithms
with linear and RBF kernels. (e) ACC comparison of SVM with linear and RBF kernel for top scored S11
response (feature) numbers varying from 10 to 100. (f) ACC comparison of SVM with linear and RBF kernel for
top scored S11 response (feature) numbers varying from 1 to 10.
the data processing provided by a commercially available dielectric property measurement software. S-parame-
ters were also used to investigate the accuracy of narrow band data through feature selection.
Difference of the absolute mean S11 responses between malignant and healthy tissues is shown in Fig. 2a,b.
The differences between mean S11 of the malignant and healthy tissues were calculated as 0.05 and 0.24 for the
real part at 0.5 and 6 GHz, respectively. Similarly, 0.03 and 0.07 were found for the imaginary part at 0.5 and 6
GHz, respectively. Two-way ANOVA was applied to the mean of the collected absolute S11 response for malignant
and healthy tissues with 0.05 ( α) significance level. Statistically significant differences were found between two
groups with p value ≤ α.
Classification based on S‑parameter responses. The raw S11 response is a complex number where the
real and imaginary parts of the responses were treated as different features in the machine learning algorithm.
Since there was 101 measurement points between 0.5 to 6 GHz, the total number of features for each measure-
ment sample was 202.
For classification the pre-processing and classification steps presented in “Methods” section is applied to
the complex S11 response. In the first step, the raw data were processed with SVM algorithm to find the optimal
kernel and CV scheme. Both the raw data and the logarithm of the data were tested with different combinations
of linear, RBF kernels and 5-fold, 10-fold, LOO CV. Different CV schemes were again utilized for reproducibility
purposes17,18. The best performance was obtained with a combination of the logarithm of the data and linear
kernel with 93.85% accuracy. This is consistent with the in vivo dielectric property results where the best results
again was obtained with linear kernel. No significant difference was observed between the CV schemes ensuring
reproducibility, shown in Fig. 2c.
Feature selection applied to the S‑parameter responses. Since the implemented CV schemes con-
sistently showed similar performances, 10-fold CV were used for feature selection (FS) to minimize the process-
ing times. Nested CV algorithm was applied to optimize the α parameter of Inf-FS method as well as to separate
the test set during parameter optimization to avoid overfitting. FS is performed in three steps; first, by ranking
and scoring 100 and 50 most significant features for both the raw and logarithm of the raw data, given in Fig. 2d.
The accuracy of SVM-linear and SVM-RBF algorithms were evaluated for all data groups. The logarithm of the
data outperformed for all features (202) and for the first 100 features. Therefore, the logarithm of the raw data
was used for the rest of the data analysis. Next, first 10 to 100 features were used to evaluate the accuracy of SVM
algorithm with linear and RBF kernels, shown in Fig. 2e. The accuracy dropped from 91.63% to 87.23% with
the decreasing number of features. Lastly, first 1 to 10 features were used with SVM algorithm with linear and
RBF kernels, shown in Fig. 2f. It resulted in 86.92% accuracy using a single feature. During the feature ranking
the features were identified and tracked, the first ranked feature corresponded to the real part of S11 response at
610 MHz.
Scientific Reports | (2022) 12:349 | https://doi.org/10.1038/s41598-021-03884-7 4
Vol:.(1234567890)www.nature.com/scientificreports/
Discussion
Recent works19,20 implemented the machine learning algorithms to different dielectric property data with over
98% accuracy. Linear classification algorithms showed consistently well classification accuracies for dielectric
property data. To the best of our knowledge, this work represents classification accuracies obtained for the largest
microwave in vivo dielectric property data obtained from the rat mammary tissues. It is shown in this work that
the classification accuracy for the in vivo dielectric property data can be as high as 100%.
Another goal of this work is to completely eliminate the data processing part applied to the S11 response of the
open-ended coaxial probe to obtain the dielectric properties. This was done by using the S11 response instead of
dielectric properties. Findings indicate that the S11 based classification is able to reach over 93% accuracy, 95.39%
sensitivity, and 92.31% specificity using a crude SVM model. This approach eliminates the software require-
ments to obtain the dielectric properties and indicates that S-parameter based classification with high accuracy
is possible. Further, this approach allowed exploration of the classification using a single frequency with feature
selection. It is shown that a single frequency response can be used with 6% decrease in accuracy. The obtained
sensitivity and specificity were 78.46% and 95.39%, respectively. A narrow band measurement enables low-cost
microwave circuitry that decreases the cost of the end product significantly.
These results indicate that a single frequency measurement carries a large majority of the information, sug-
gesting an end product operating at a single frequency can potentially achieve high accuracy classification.
Moreover, single frequency operation can enable a device utilizing a narrow band microwave circuit operating
at relatively low frequencies, 610 MHz S11 response,which in turn aid producing a cost effective device that can
be deployed to remote clinics. Classification accuracy can be further improved by either increasing the sample
size or potentially tuning the existing model.
Further, in experiment group mammary carcinoma measurements were collected from grade I tumors;
however, the tumors were at different stages. The tumor growth period from the first diagnosis to sacrifice varied
between 11 days to 105 days. From the experiments it was observed that the tumors at early stages were rather
more homogeneous and measured S11 were more consistent. Contrarily, necrosis and fat tissues was observed
at late stage tumors and S11 response also varied with sample heterogeneity. In control group, the animals had
homogeneous tissues. Therefore, the tissue heterogeneity was minimal comparing to experiment group. This can
also be observed from the S11 response given in Fig. 2a,b. This suggests that S11 measurement response as well
as the age of the animal and the time elapsed from diagnosis to treatment can be used as inputs to the machine
learning algorithms; hence, potentially improve the automated diagnosis accuracy.
Open-ended coaxial probe method was commonly used for broadband dielectric property characterization in
laboratory environment. Potential application of the existing open-ended coaxial probes in the field of microwave
diagnostics was first introduced about a decade ago; however, the research on realization of such device have been
stagnated due to the inherent high error rates of the technique. This manuscript explores a machine learning
based approach to exploit the potential utilization of open-ended coaxial probes as a low cost and high accuracy
automated diagnostic technology. This device can potentially aid physicians in diagnosing breast cancer tissues
in real time which can lead to acceleration of the current medical diagnosis and treatment protocols followed
during biopsy as well as cancer resection surgeries.
Our findings indicate that it is possible to increase the tissue characterization accuracy of the existing tech-
nique by approximately 30% and 23% for in vivo dielectric property and S-parameter data through adoption of
machine learning algorithms without additional costly hardware improvements. To our surprise, the adoption
of feature selection algorithms revealed that a narrow band S-parameter response carries a significant portion
of the information. Therefore, it will be possible to support the open-ended coaxial probes with a narrow band
microwave circuitry that is able to collect only S-parameters at low frequencies which decreases the cost of an
end product significantly. If realized, such automated microwave diagnostic device can be deployed to many
clinics, including rural ones, enabling diagnostic and surgical procedures in remote areas as well as increasing
the efficiency of the current protocols in developed regions.
Methods
Animals. Sprague Dawley (SD) strain albino female rats was obtained from the Bogazici University, Center
for Life Sciences and Technologies, Vivarium division. Animals were randomly divided into control and experi-
ment group. Animals in control group were administered a single dose of pure extra virgin olive oil. Animals in
experimental group were administered a single dose 20 mg/kg 7,12-Dimethylbenz(a) anthracene (DMBA) dis-
solved in 1 ml extra virgin olive oil to initiate mammary carcinoma. Both the dummy solution and the DMBA
solution were administered via oral gavage. DMBA was obtained from Sigma Chemical Co in powder form and
the target amount was deposited to a colored vial and mixed with 1 ml olive oil. Next, the DMBA was dissolved
in olive oil using a closed system ultrasonic bath. Both groups received the solutions at 47 days old since the
DMBA must be administered when the animals start reaching puberty. After the administration, the animals
were left to recover for 2 weeks. The experiment animal weights were tracked and the animals were checked for
tumors by hand every week after 2 weeks rest period ended. The animals had ad libitum access to tap water and
standard pellet food during the experiments.
Experimental setup. The dielectric property measurements were performed with the commercially avail-
able slim form Keysight N1501A open-ended coaxial probe kit along with Agilent 85070E dielectric measure-
ment software. In addition to the probe kit, the measurement setup, shown in Fig. 3, included the Agilent Field-
fox N9923A Vector Network Analyzer (VNA), a laptop computer, and Keysight N1501A-202 20 GHz flexible RF
cable. Please note that the experiments were conducted on animal in vivo tissues and humans shown in Fig. 3
are some of the authors listed in this work. Flexible connection enabled free movement of the probe allowing the
Scientific Reports | (2022) 12:349 | https://doi.org/10.1038/s41598-021-03884-7 5
Vol.:(0123456789)www.nature.com/scientificreports/
Figure 3. Measurement setup: (1) Agilent Fieldfox N9923A Network Analyzer (VNA), (2) Laptop computer
connected to VNA via local area network (LAN) cable and Agilent IO program, (3) Keysight N1501A-202 20
GHz flexible RF cable enables connection between the VNA and the probe, (4) Keysight N1501A Dielectric Slim
Form Probe, (5) rat tissue sample under test.
35 4
3.5
30
3
2.5
25
Methanol measurement
(S/m)
r
2
r
r
Methanol (Gregory et al)
(S/m) Methanol measurement
20
(S/m) Methanol (Gregory et al) 1.5
1
15
0.5
10 0
0 1 2 3 4 5 6
Frequency (GHz)
Figure 4. Comparison of measured methanol dielectric properties with the literature d
ata21.
replication of the expected cable movements in an in vivo setting. VNA was connected to the computer via Local
Area Network (LAN) and Agilent IO program. The S11 response was measured by the VNA and recorded while
the 85070E software installed in the computer converted the S11 response to the dielectric properties in real time.
Both the S11 response and the dielectric properties recorded simultaneously. All measurements were performed
between 0.5 and 6 GHz with 0.55 GHz intervals.
In the open-ended coaxial probe technique, the dielectric properties are calculated from the measured reflec-
tion coefficient emerging from discontinuity due to the material terminating the probe aperture. This calcula-
tion is essentially an ill-posed inverse problem and requires the calculation of network scattering parameters
which is done through the calibration procedure. In this work a standard calibration procedure namely open,
short and distilled water was employed. To perform the calibration, the open-end (will be referred as aperture
throughout this paper) of the probe was simply left in the air for open circuit, next, the aperture was terminated
with a conductive textile for short circuit, and lastly, aperture of the probe was immersed in distilled water for a
known material load. The temperature of the distilled water was between 21.4 ± 2.5 ◦C.
Next, calibration validation was performed by collecting measurements from pure methanol, a liquid with
well-known dielectric properties. Methanol was preferred due to its relative permittivity, which is in the range of
breast tissue also conveniently located between air and distilled water8. During measurements, the temperature
of the methanol was 21.9 ± 1.9 ◦ C. Note that this step was performed before the beginning of the in vivo rat
mammary tissue measurements and the calibration was repeated if the methanol measurement differed from the
literature data21. The mean of the collected 20 pure methanol measurements is compared with literature data (20
◦
C methanol.) Comparison of measurement data with the literature for relative permittivity and conductivity
is shown in Fig. 4. From the figure it can be seen that a good agreement is obtained between the literature and
Scientific Reports | (2022) 12:349 | https://doi.org/10.1038/s41598-021-03884-7 6
Vol:.(1234567890)www.nature.com/scientificreports/
Figure 5. Measurement of samples during in vivo dielectric property and S-parameter response collection: (a)
rat breast tumor and (b) rat breast healthy tissues.
measured methanol data. Maximum dielectric property discrepancy between the measured and literature rela-
tive permittivity and conductivity are 4.5% at 3.58 GHz and 5.0% at 0.55 GHz, respectively. The obtained results
verifies the proper functioning of the measurement setup.
In vivo measurements. Before the measurements, the probe tip was sterilized using ethyl alcohol (96%)
and 2-Propanol mixture. Next, the tip of the probe was washed with distilled water and dried. Then, the standard
calibration and verification steps were performed. Again after the verification, the probe tip was washed using
distilled water and wiped dry with a cotton pad.
For sample preparation the animals were anesthetized via an intraperitoneal injection of 80mg/kg ketamine
and 10mg/kg xylazine mixture. Target biological tissue was accessed via incision and measurements were col-
lected by terminating the probe aperture with the tissue under investigation. Two measurement samples including
tumor and healthy breast tissues are shown in Fig. 5a,b, respectively.
Five measurements were taken from each measurement point before moving the probe to another tissue or
another point on the same tissue. Before moving the probe to another target measurement point, the probe tip
was washed again using distilled water and wiped dry using a cotton pad. Calibration was repeated after every
completion of 30 measurements. The calibration and measurements were performed between 0.5 to 6 GHz with
101 frequency points in between.
After the measurements were completed, the measured tissues were excised and placed in an embedding
cassette. The cassettes were kept in 10% formalin solution for pathological analysis. Protocols of this experi-
ment were in accordance with the regulations of Bogazici University Institutional Animal Experiments Local
Ethics Committee and the research is reported in accordance with the ARRIVE (Animal Research: Reporting
of In Vivo Experiments) guidelines. Ethical approval was received from the Bogazici University Institutional
Animal Experiments Local Ethics Committee.
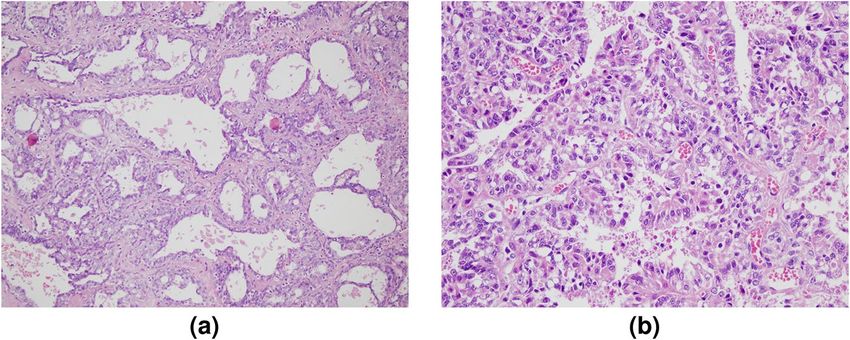
Pathological analysis. Samples were dehydrated and processed for paraffin embedding, tissue sections
were stained with hematoxylin and eosin (HE) for light microscopy studies. The microscope slides were scored
based on tubule formation, mitotic activity, and nuclear pleomorphism which is a well established criteria22. The
microscope slides were examined and scored based on tubule formation, mitotic activity and nuclear pleomor-
phism. Tubule formation was scored as 1 when more than 75% of tumor shows tubular differentiation, scored
as 2 when tubule formation is between 10% to 75%, and scored as 3 when the tumor tubule formation is well
under 10%. Mitotic activity was scored by counting the quantity of mitotic figures per 10 high power fields (hbf).
Mitoses ≤7, 8 to 14 and greater than 15 per 10 hpf was scored as 1,2 or 3, respectively. Note that the mitotic count
scoring criteria varies depending on the field diameters of the microscopes employed by the pathologist. For the
evaluation of nuclear pleomorphism, size and shape variation of the tumor nuclei was taken into account. Uni-
form cells with small nuclei was scored as 1. Bigger cells and vesicular nuclei, with visible nucleolus was scored
as 2. Lastly, marked variation in cells and vesicular nucleus, explicit nucleoli was scored as 3. The overall grade
was calculated using total score. The total scores 3-5, 6-7, and 8-9 corresponds to grade 1, 2, and 3, respectively.
Samples of pictures of a malignant sample obtained through histopathological analysis with 10X200 and 15X400
view is shown in Fig. 6a and Fig. 6b, respectively.
Scientific Reports | (2022) 12:349 | https://doi.org/10.1038/s41598-021-03884-7 7
Vol.:(0123456789)www.nature.com/scientificreports/
Figure 6. Histopathology picture of samples: (a) 10X200 view and (b) 15 × 400 view.
Data processing. The measurements were placed on a feature matrix for classification purposes. Between
0.5 and 6 GHz all frequency points were taken as 101 individual complex numbers. Since the real and imaginary
parts were considered as separate features, for both dielectric property and S11 measurements 202 features were
used as input data. To generate a balanced number of measurement samples and to eliminate the bias due to
sample size difference 5 animals from each group and 325 measurements from each tissue type were randomly
selected. That is, 325 measurements constituting all measurements collected from healthy rat breast tissues were
used and 325 measurements were randomly selected from malignant rat breast tumor tissues. To the best of our
knowledge, this scale of data have not been presented in the literature before.
Classification. Classification was performed with the supervised linear classifier using the SVM a lgorithm23.
The algorithm is discussed at great length in the literature and many packaged versions are available in vari-
ous computer languages. The SVM algorithm used in this work was a commercial SVM function in MATLAB
named fitcsvm. Briefly, SVM works by constructing a hyperplane to separate the multi dimensional data. To
do so, the data points close to the boundary between two classes are selected and named support vectors. The
goal is to find a hyperplane that will have a maximum distance, called margin, from the support vectors. SVM
is implemented using kernel functions. These functions are mathematical operators that transforms the input
data to desired form that can potentially aid constructing a hyperplane that can separate the input data with
targeted accuracy. In this work, linear and RBF kernel functions were used. All data processing and classification
described in this work was performed with MATLAB language.
Feature selection and reproducibility using multiple cross‑validation schemes. Feature selec-
tion (FS) was only applied to S11 response. The purpose of applying FS to the S11 response is to investigate the
potential of narrow band applications. In this study, infinite feature selection (Inf-FS)24,25 along with the SVM
classification algorithm were applied to extract the most discriminative feature. Since Inf-FS is proven to out-
perform other feature selection (FS) methods on multiple benchmark data sets, we implemented the Inf-FS
algorithm in this work. Being one of the filter class FS methods, Inf-FS operates by mapping the FS problem to
an affinity diagram that is built with nodes and paths corresponding to features and subset of features, respec-
tively. The goal is to rank the features by calculating an energy score. The energy score is assigned by evaluating
the combination of path length and pairwise energy term. Pairwise energy term is a weighted combination of
standard deviation over samples and a correlation coefficient. The weight of each term is determined via loading
coefficient, denoted as α ranges between [0,1], and it was optimized for each scenario via nested Cross Validation
(CV). The Inf-FS returns a rank and a weight matrix. In this work, the returned rank matrix was stored for each
CV step and the features were scored based on the frequency and rank order. Desired SVM algorithm is then
trained and tested with the predetermined K number of features with 10 fold CV scheme.
Fig. 7 shows a flowchart of the nested CV algorithm used in this work. The algorithm is also described with
a pseudocode as well in Fig. 8. Briefly, the dataset was splitted into 10 folds. One fold was reserved for validation
and the remaining data were used at the outer CV loop for training. Note that, parameter α was tuned during
training. The α varied between [0,1] with 0.05 intervals and the optimal α was found through training by calculat-
ing the accuracy for each α value. To do so, the training fold was further divided into 5 internal folds, referred as
“nested”. At each inner CV loop, one of fold was used as a validation set. Other folds constituted inner training
set on which inf-FS was applied. Next, top K features was selected and SVM algorithm was trained. Accuracy
was calculated using test set. First the optimal α parameter with maximum accuracy was determined for each
outer loop and inf-FS was applied using the optimal α.
Scientific Reports | (2022) 12:349 | https://doi.org/10.1038/s41598-021-03884-7 8
Vol:.(1234567890)www.nature.com/scientificreports/
Figure 7. Flow chart for nested cross validation (CV) scheme.
Figure 8. Algorithm of nested cross validation (CV).
Scientific Reports | (2022) 12:349 | https://doi.org/10.1038/s41598-021-03884-7 9
Vol.:(0123456789)www.nature.com/scientificreports/
Received: 29 June 2021; Accepted: 6 December 2021
References
1. Gabriel, S., Lau, R. & Gabriel, C. The dielectric properties of biological tissues: Ii. measurements in the frequency range 10 hz to
20 ghz. Phys. Med. Biol.41, 2251 (1996).
2. Lazebnik, M. et al. A large-scale study of the ultrawideband microwave dielectric properties of normal, benign and malignant
breast tissues obtained from cancer surgeries. Phys. Med. Biol. 52, 6093 (2007).
3. Tunçay, A. H. & Akduman, I. Realistic microwave breast models through t1-weighted 3-d mri data. IEEE Trans. Biomed. Eng. 62,
688–698 (2014).
4. Converse, M., Bond, E. J., Veen, B. & Hagness, C. A computational study of ultra-wideband versus narrowband microwave hyper-
thermia for breast cancer treatment. IEEE Trans. Microw. Theory Tech. 54, 2169–2180 (2006).
5. Cendán, J. C., Coco, D. & Copeland, E. M. III. Accuracy of intraoperative frozen-section analysis of breast cancer lumpectomy-bed
margins. J. Am. Coll. Surg. 201, 194–198 (2005).
6. Levine, H. & Papas, C. H. Theory of the circular diffraction antenna. J. Appl. Phys. 22, 29–43 (1951).
7. Anderson, W. Microwave biopsy probe (2006). US Patent App. 10/961,812.
8. Popovic, D. et al. Precision open-ended coaxial probes for in vivo and ex vivo dielectric spectroscopy of biological tissues at
microwave frequencies. IEEE Trans. Microw. Theory Tech. 53, 1713–1722 (2005).
9. Gabriel, C., Chan, T. & Grant, E. Admittance models for open ended coaxial probes and their place in dielectric spectroscopy.
Phys. Med. Biol. 39, 2183 (1994).
10. Maenhout, G., Markovic, T., Ocket, I. & Nauwelaers, B. Effect of open-ended coaxial probe-to-tissue contact pressure on dielectric
measurements. Sensors 20, 2060 (2020).
11. La Gioia, A. et al. Open-ended coaxial probe technique for dielectric measurement of biological tissues: Challenges and common
practices. Diagnostics 8, 40 (2018).
12. Cho, J. et al. In-vivo measurements of the dielectric properties of breast carcinoma xenografted on nude mice. Int. J. Cancer 119,
593–598 (2006).
13. Kim, T.-H. & Pack, J.-K. Measurement of electrical characteristics of female breast tissues for the development of the breast cancer
detector. Progr. Electromagn. Res. C 30, 189–199 (2012).
14. Martellosio, A. et al. Dielectric properties characterization from 0.5 to 50 ghz of breast cancer tissues. IEEE Trans. Microw. Theory
Tech. 65, 998–1011 (2016).
15. Cheng, Y. & Fu, M. Dielectric properties for non-invasive detection of normal, benign, and malignant breast tissues using micro-
wave theories. Thoracic Cancer 9, 459–465 (2018).
16. Lin, J. Frequency optimization for microwave imaging of biological tissues. Proc. IEEE 73, 374–375 (1985).
17. Shen, X. et al. Using connectome-based predictive modeling to predict individual behavior from brain connectivity. Nat. Protoc.
12, 506 (2017).
18. Georges, N. et al. Identifying the best data-driven feature selection method for boosting reproducibility in classification tasks.
Pattern Recogn. 101, 107183 (2020).
19. Saçlı, B. et al. Microwave dielectric property based classification of renal calculi: Application of a knn algorithm. Comput. Biol.
Med. 112, 103366 (2019).
20. Yilmaz, T. et al. Machine learning aided diagnosis of hepatic malignancies through in vivo dielectric measurements with micro-
waves. Phys. Med. Biol. 61, 5089 (2016).
21. Gregory, A. P. & Clarke, R. Tables of the complex permittivity of dielectric reference liquids at frequencies up to 5 ghz. NPL Report
MAT 23 (2012).
22. Kim, M. S. et al. Oral administration of loquat suppresses dmba-induced breast cancer in rats. Food Sci. Biotechnol. 20, 491–497
(2011).
23. Andrew, A.M. An introduction to support vector machines and other kernel-based learning methods by Nello Christianini and
John Shawe-Taylor, Cambridge University Press, Cambridge, 2000, xiii+ 189 pp., ISBN 0-521-78019-5 (hbk,£ 27.50). Robotica18,
687–689 (2000).
24. Roffo, G., Melzi, S. & Cristani, M. Infinite feature selection. In Proceedings of the IEEE International Conference on Computer Vision,
4202–4210 (2015).
25. Adeli, E. et al. Kernel-based joint feature selection and max-margin classification for early diagnosis of Parkinson’s disease. Sci.
Rep. 7, 41069 (2017).
Acknowledgements
This project has received funding from the European Union’s Horizon 2020 research and innovation programme
under the Marie Sklodowska-Curie grant agreement No 750346 and Scientific and Technological Research
Council of Turkey under grant agreement 118S074.
Author contributions
E.O. contributed to animal experiments and conducted data analysis. S.J. helped in animal experiments. C.A.
contributed to animal experiments and paper editing. N.P.Ö. contributed to animal experiments and pathological
analysis. F.A. Alkan contributed to animal experiments. N.K. conducted pathological analysis. I.R. paticipated in
data analysis and paper editing. I.A. provided conceptualization and resources. T.Y. contributed to conceptualiza-
tion, animal experiments, data analysis, paper writing, paper editing, funding and resources.
Competing interests
The authors declare no competing interests.
Additional information
Supplementary Information The online version contains supplementary material available at https://doi.org/
10.1038/s41598-021-03884-7.
Correspondence and requests for materials should be addressed to E.O.
Reprints and permissions information is available at www.nature.com/reprints.
Scientific Reports | (2022) 12:349 | https://doi.org/10.1038/s41598-021-03884-7 10
Vol:.(1234567890)www.nature.com/scientificreports/
Publisher’s note Springer Nature remains neutral with regard to jurisdictional claims in published maps and
institutional affiliations.
Open Access This article is licensed under a Creative Commons Attribution 4.0 International
License, which permits use, sharing, adaptation, distribution and reproduction in any medium or
format, as long as you give appropriate credit to the original author(s) and the source, provide a link to the
Creative Commons licence, and indicate if changes were made. The images or other third party material in this
article are included in the article’s Creative Commons licence, unless indicated otherwise in a credit line to the
material. If material is not included in the article’s Creative Commons licence and your intended use is not
permitted by statutory regulation or exceeds the permitted use, you will need to obtain permission directly from
the copyright holder. To view a copy of this licence, visit http://creativecommons.org/licenses/by/4.0/.
© The Author(s) 2022
Scientific Reports | (2022) 12:349 | https://doi.org/10.1038/s41598-021-03884-7 11
Vol.:(0123456789)You can also read