City of Edmonton Waste Services Utility 2021 Utility Rate Filing - December 4, 2020 - CR_8448 Attachment
←
→
Page content transcription
If your browser does not render page correctly, please read the page content below
CR_8448 Attachment 1

  City of Edmonton

Waste Services Utility

2021 Utility Rate Filing

  December 4, 2020
WASTE SERVICES UTILITY
2021 Utility Rate Filing

Table of Contents

    Executive Summary                                     4

    1.0 Introduction                                      6

    2.0 Organizational Structure                           7

    3.0 Methodology and Key Assumptions                    9

    4.0 Operational Performance                           13

    5.0 Landfill Closure and Related Liabilities          15

    6.0 Financial Rate Impacts                            17

    7.0 Financial Indicators & Risk Allowance             19
          7.1 Cart Rates                                  20
          7.2 General Comments for Financial Indicators   21

    8.0 Utility Summary Schedule                          24

    9.0 Operations and Maintenance                        26
          9.1 Personnel                                   28
          9.2 Materials, Goods & Supplies                 29
          9.3 External Services                           30
          9.4 Fleet Services                              33
          9.5 Shared Services                             34
          9.6 Intra-Municipal Services                    35
          9.7 Utilities                                   36
          9.8 Intra-Municipal Recoveries                  37

    10.0 Amortization and Interest Expense                38

                                                           2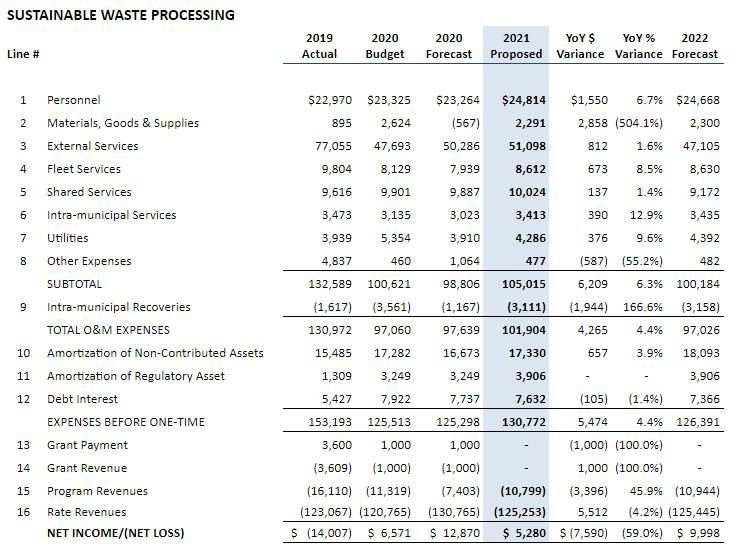
WASTE SERVICES UTILITY
2021 Utility Rate Filing
10.1 Short-Term Loan from the City of Edmonton 40
10.2 Deferral Account Balances 41
11.0 Revenue Requirement 43
11.1 Non-Rate Revenue 44
11.2 Calculation of Rate Base 46
11.3 Return on Rate Base 47
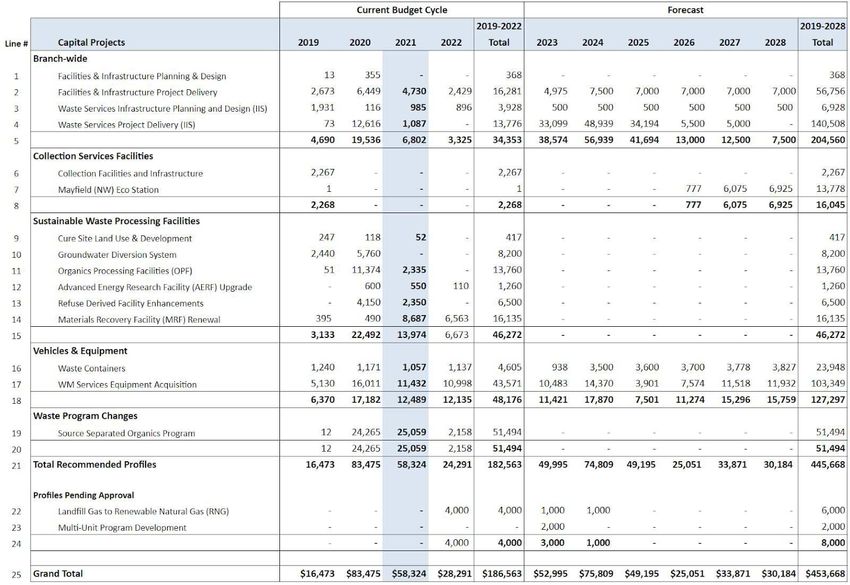
12.0 Capital Budget and Forecast Plan - Capital Project Summary 48
12.1 Capital Project Financing Summary 53
13.0 Segmented Reporting - Program Revenues and Expenses 54
13.1 Revenues and Expenses by Regulated and Non-Regulated Program 56
13.2 Regulated Activities Expense Changes 58
14.0 Historical Trends 60
Appendix A: Waste Services Utility Operating Business Cases 62
Appendix B: Waste Services Utility Budget Adjustments & Capital Profiles 63
3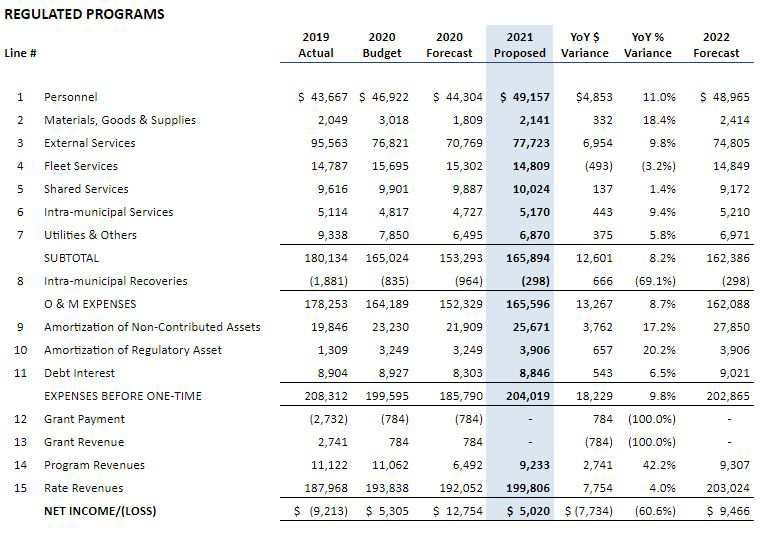
WASTE SERVICES UTILITY
2021 Utility Rate Filing

Executive Summary

    Waste Services continues to progress toward a more environmentally sustainable future with a focus on waste reduction across all sectors and
    the City’s shared leadership as stewards of the environment. Key initiatives and priorities for the upcoming business planning cycle, including the
    25-year Waste Strategy implementation, will allow Waste Services to contribute to the City’s Corporate Outcome and the 90 percent residential
    diversion goal established in Waste Management Policy C527.

    Over the next four years, Waste Services will follow the guiding principles described in the City’s Reimagine report, ConnectEdmonton, and the
    new City Plan. Additionally, Waste Services will manage the risk to diversion targets for the regulated business sector through a balanced portfolio
    of activities, maximize the promotion of policy, regulation, partnerships and market creation for the non-regulated business sector, and promote
    waste reduction through increased citizen engagement, education and enforcement to meet the evolving waste system requirements and
    planned changes. The focus will be on the following:

          ●     Waste Strategy in Action - Applying a Zero Waste Framework, emphasis will be placed on waste reduction, reuse, recycling, composting,
                materials recovery and waste to energy across all waste streams. Starting in 2021, approximately 236,000 households will move to a four
                stream program with separate food scraps collection, seasonal yard waste collection and garbage volume limits as part of the Edmonton
                Cart Rollout. Following the citywide distribution of carts, Single Unit customers will be transitioned to variable rates (based on garbage
                cart size) to incentivize good waste behaviours and give customers an element of control over their monthly rate.

          ●     Service Delivery Transformation - Wastes Services’ Customer Experience team will drive transformation to successfully move to a
                customer-centric model utilizing proven methodologies and industry-leading practices such as journey mapping, customer feedback
                management, citizen engagement, business performance metrics and full service and product lifecycle management.

          ●     Innovation and Asset Optimization - The Edmonton Waste Management Centre is a unique collection of waste processing and research
                facilities. A variety of projects are underway to optimize processes on the site including the Advanced Energy Research Facility, Clover Bar
                Landfill gas management and groundwater diversion system. Partnerships are also being explored through the Alberta Clean Energy
                Technology Accelerator (ACETA) and a waste to energy trial with the municipality of St. Albert.

          ●     Fiscal Accountability - Edmonton expects to face many challenges in the coming years as a result of the COVID-19 pandemic. Operating in
                a new fiscal reality means significant gaps between providing expected service levels and the availability of financial resources. Waste
                Services continues to strive towards achieving the financial indicators set out in Waste Management Utility Fiscal Policy C558A, as
                adopted by City Council in 2014. The focus will be to provide stable and consistent rate increases while achieving cash and debt to net

                                                                                                                                                             4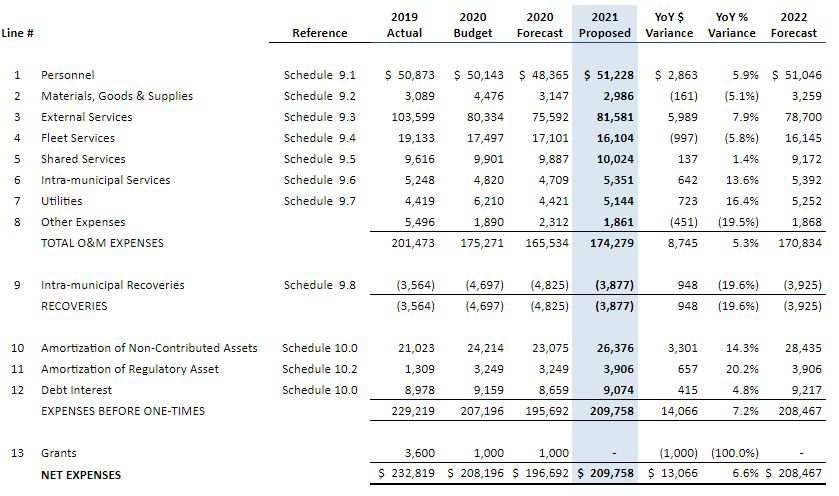
WASTE SERVICES UTILITY
2021 Utility Rate Filing

                asset targets to ensure the Utility is financially sustainable over the long term. The Utility is proposing a zero percent rate increase in 2021
                while delivering significant and transformational change in the delivery of its service.

          ●     Fiscal Management - Waste Services has conducted a thorough risk assessment accounting for both short term and long term operational,
                capital and financial impacts. Risks will continue to be monitored and updated in the Risk Register. Performance metrics will continue to
                be refined to aid in the management of the business in conjunction with the Enterprise Performance Management initiative. Additionally,
                measures will be developed to monitor the climate impact of the 25-year Waste Strategy and the commercial collection wind down is
                expected to be completed by the end of 2021.

    The Waste Services Utility is well positioned for the transformational changes in the coming years as a result of the 25-year Waste Strategy. Stable
    and consistent utility rate increases remain the key goal with a focus on waste reduction and alignment to the Zero Waste Framework for all
    sectors in the City of Edmonton.

                                                                                                                                                               5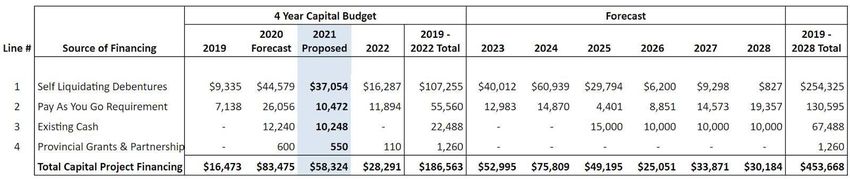
WASTE SERVICES UTILITY
2021 Utility Rate Filing

 1.0 Introduction

    Waste Services is an essential part of the City Plan and supports Climate Resilience through innovation and partnership. Waste Services’ goal is to
    support and encourage Edmontonians, businesses and institutions in their waste management practices, while demonstrating shared leadership
    as stewards of the environment.

    Waste Services has developed an integrated 25-year Strategic Outlook to ensure Edmontonians receive maximum environmental benefits while
    minimizing the cost increases of managing solid waste. The City’s Reimagine Report (CR_8379) highlights many challenges that Edmonton expects
    to face in the coming years related to the COVID-19 pandemic. Waste Services has realigned its strategic deliverables in consideration of these
    needs which include the potential for increased residential waste and a resurgence in single-use products, making diverting waste from landfill
    more challenging. With Edmonton’s population growth also expected to slow, it could result in a reduced growth in customer count and a lower
    tolerance for increased waste utility rates.

    Over the next four years, significant changes to the waste management program will be delivered as part of the transition to a zero waste future.
    The City will lead by example by implementing source separated organics at City of Edmonton facilities and buildings, setting an example for the
    Industrial, Commercial and Institutional sector to follow. The Waste Reduction Roadmap, which will be presented to City Council in Spring 2021,
    will prioritize new waste prevention and reduction initiatives across all sectors. Additionally, new regional partnerships will allow for increased
    organic waste processing and diversion.

    Stable and consistent utility rate increases remain a focus for the next four years and will be augmented through the introduction of cart rates for
    single unit customers. The 2021-2024 Business Plan highlights the service delivery transformations and the revenue potential of waste byproducts
    and assets to support the goal of a stable and consistent rate. The Service Delivery Transformation will be achieved through technology, process
    optimization and reimagined services. It will enhance operational efficiency, while enhanced employee engagement and a continued focus on
    safety culture will improve productivity and retain top talent.

    Waste Services will continue to make transformational impacts through the 25-year Waste Strategy. Essential service will be maintained for
    Edmontonians through a full cost recovery approach and the citizen experience will be improved to support adaptation of new waste
    management systems for the City.

                                                                                                                                                          6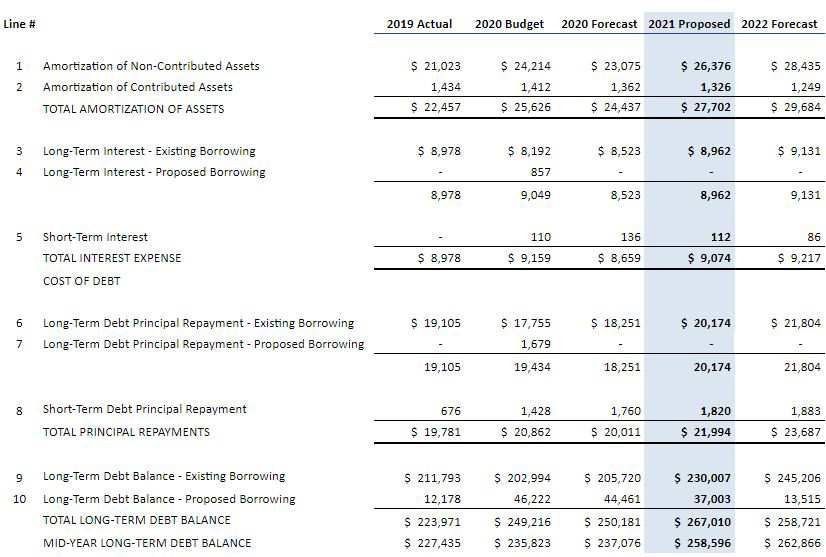
WASTE SERVICES UTILITY
2021 Utility Rate Filing
2.0 Organizational Structure
Waste Services’ organizational structure is fully aligned to the Corporate Business Plan and consists of five sections (Figure 1).
Figure 1: Waste Services Organizational Structure
Waste Collection Services
Waste Collection Services provides efficient and effective waste collection and drop-off services including an Assisted Waste Collection program
for residents with mobility restrictions. Residents have access to a number of facilities where large items can be dropped off for recycling, reuse or
disposal including Eco Stations, Community Recycling Depots, Big Bin Events and the Reuse Centre.
Sustainable Waste Processing
Sustainable Waste Processing receives and sorts residential and non-residential waste at the Edmonton Waste Management Centre, a unique
collection of advanced processing and research facilities. This integrated site, located on 233 hectares, is designed to process more than 500,000
tonnes of waste per year. Facilities and operations are either owned and operated by the City or run on a contract basis. The focus of these
facilities is to recover valuable resources and to minimize the amount of waste going to landfill.
7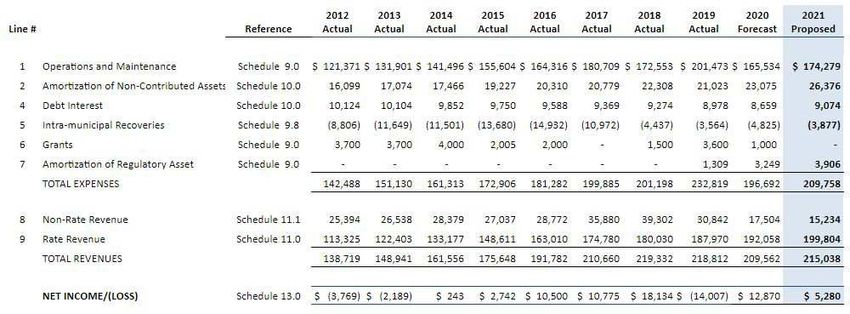
WASTE SERVICES UTILITY
2021 Utility Rate Filing

    Technical Services
    Technical Services is dedicated to the engineering, technical support, innovation and environmental compliance of waste processing and
    collection operations. The area provides oversight for capital projects and large operational investments to ensure waste operations are
    compliant, effective and efficient. This section also manages regulatory compliance and the Clover Bar Landfill post-closure operations.

    Business Integration
    Business Integration is responsible for defining Branch strategy, facilitating operational direction, resource allocation, financial governance and
    branch-wide alignment to corporate directives. Key areas of focus include performance management, monitoring and reporting, contract
    management, workforce development, utility rate filing and billing. This area is also responsible for the branch’s communications, education,
    outreach and volunteer programs that keep residents engaged in sustainable waste practices and waste reduction efforts.

    Waste Strategy Implementation
    A new Waste Strategy Implementation section was formed in 2019 to ensure coordinated delivery of the 25-year Waste Strategy. This section
    leads research, public engagement, business case development, program and service design, project management and change management in
    coordination with all other sections of the branch to guide the transformation of Edmonton's Waste System to a Zero Waste Framework.

                                                                                                                                                          8
WASTE SERVICES UTILITY
2021 Utility Rate Filing

 3.0 Methodology and Key Assumptions

    The following subsections provide the methodology and key assumptions for the 2021 Utility Rate Filing. The 2021 Rate Filing is based on the
    August 31, 2020 forecast incorporating significant changes up to September 30, 2020. The assumptions used to develop this Rate Filing include
    City Council approved corporate budget guidelines and forecasts from the City’s Chief Economist.

          ●     Housing Starts and Consumer Price Index

                                                     2021                  2022                   2023
                 Housing Starts                      7,254                 7,299                  7,895
                 Consumer Price Index               1.80%                  1.80%                 1.70%

          ●     Employee Benefits
                The 2020-2022 Operating Budget amounts were calculated by the City of Edmonton’s Capital and Operating Budget System (COBS) which
                allocates benefit dollars by employee. The 2021 Rate Filing includes an update for any recent benefit rate increases for the Local
                Authorities Pension Plan, Canada Pension Plan, Employment Insurance, Major Medical and Dental Plan, Group Life Insurance and Health
                Care Spending Account.

          ●     Cost of Debt
                Debt servicing calculations use the cost of debt rate forecast provided by the City’s Corporate Budget Office and are based on actual
                Alberta Capital Finance Authority borrowing rates up to the third quarter of 2020. The rates are calculated to be mid-year estimates. An
                additional 0.25 percent increment is added per year starting in 2021.

                Term                  2021          2022          2023
                5 Year                1.35%         1.60%         1.85%
                10 Year               1.84%         2.09%         2.34%
                15 Year               2.28%         2.53%         2.78%
                20 Year               2.51%         2.76%         3.01%
                25 Year               2.66%         2.91%         3.16%

                                                                                                                                                           9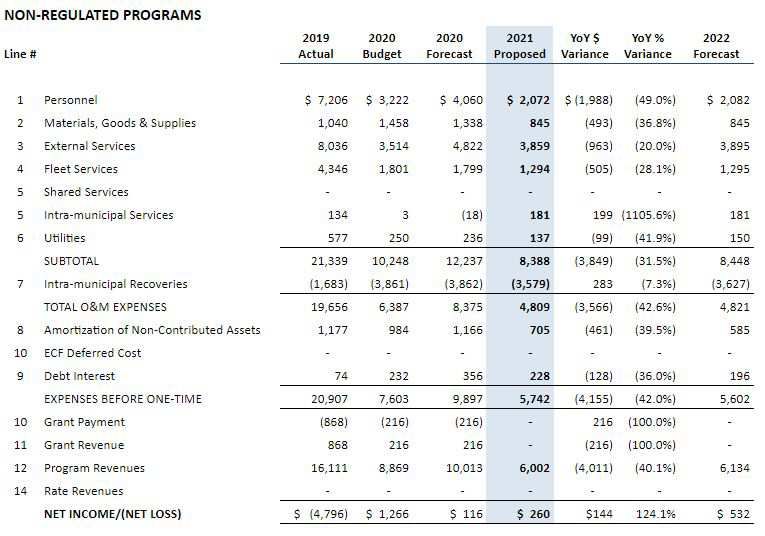
WASTE SERVICES UTILITY
2021 Utility Rate Filing
Other assumptions include the following:
● Waste Services Utility Staff Vacancy - unless otherwise stated, the typical expected staff vacancy is four percent for all staff.
● Full-time Equivalent - a full-time equivalent (FTE) is defined as the hours (and associated personnel costs) one full time employee would
work in a year. For example, if a position is funded for one year, it is equivalent to 1.0 FTE, whereas a position funded for six months is
equivalent to 0.5 of an FTE. Funding for a new position may be adjusted in the first year to reflect the timing between approval of a new
position and hiring, with full funding for the position beginning the following year.
● Customer Growth - The customer counts are based on historical trends and the anticipated household starts as projected by the City’s
Chief Economist. The 2020 forecast housing starts were reduced based on the anticipated impacts of COVID-19 however, the actual
growth in housing starts as of September 30, 2020 has been higher than anticipated. Projected customer growth in 2021 has been
adjusted to account for this increase. The proposed customer billing base is represented in the figures below:
2019 Actual 2020 Forecast 2021 Proposed 2022 Forecast
Single Unit 224,129 232,643 236,711 240,792
Multi-Unit 178,751 177,383 178,342 180,850
● Cart Adoption - Starting in 2021, approximately 236,000 households will move to a four stream program with separate food scraps
collection, seasonal yard waste collection and garbage volume limits as part of the Edmonton Cart Rollout. Following the citywide
distribution of carts, Single Unit customers will be transitioned to variable rates in October 2021 (based on their choice of garbage cart
size). The 2021 variable rates are designed based on the following assumptions around anticipated choice of garbage cart by customers:
● 75% of the households are anticipated to select a 240 litre garbage cart;
● 24% of households are anticipated to select a 120 litre garbage cart; and
● 1% or a smaller proportion of the households are anticipated to select a 360 litre garbage cart.
The forecasted assumption around anticipated choice of garbage cart was based on the ratios considered as part of Single Unit Waste
Set-Out Business Case (CR_7173), and updated due to the introduction of the 360 litre cart. In the event the actual choice of garbage cart
size varies significantly from the assumptions above, cart rates in 2022 will be adjusted to reflect the actual choice of garbage carts.
10WASTE SERVICES UTILITY
2021 Utility Rate Filing
11WASTE SERVICES UTILITY
2021 Utility Rate Filing
A review of customer accounts was completed as part of the 2017 Cost of Service Study (COSS). Through this review a number of households
were identified as receiving service as if they were a single unit customer but were being charged the multi-unit rate. In 2019, the Waste Services
Bylaw was updated to allow for customers to be charged in alignment with their service type. Waste Services undertook a project to review
these accounts to determine the appropriate classification and service type. Based on this project, approximately 9,500 of these households
were reclassified from the multi-unit rate to the single unit rate beginning in 2020 and approximately 15,900 will be reclassified in spring 2021.
To avoid rate shock for these customers, Waste Services intends to adjust the rates from the multi-unit rate to the single unit rate over a period
of five years.
12WASTE SERVICES UTILITY
2021 Utility Rate Filing
4.0 Operational Performance
The four performance goals below summarize Waste Services’ performance measures.
ACTUALS FORECAST TARGETS
GOAL PERFORMANCE MEASURE
2019 2020 2021 2022
Curbside Diversion Rate
13% 13% 37% 65%
(Weight Based)*
Customer Number of Missed Collections
2 2 2 2
Excellence per 10,000
Measure of Waste Reduction To be presented with the Waste Reduction Roadmap in Q2 2021
Single Unit Residential
23% 17% 40% 60%
Diversion Rate
Year-Over-Year Reduction in
-3% -2% -1% -2%
Collection Cost (City Crews)
Operational
Excellence
Average Processing Cost per
$230 $245 $261 $272
Tonne1
Number Reportable
20 20WASTE SERVICES UTILITY
2021 Utility Rate Filing
ACTUALS FORECAST TARGETS
GOAL PERFORMANCE MEASURE
2019 2020 2021 2022
Annual Net Income ($000s) (14,007)2 12,870 5,280 9,998
Stable Rates 2.5% 0.3% 0.0% 0.0%
Financial
Accountability
Debt to Net Assets Ratio 83.4% 79.3% 77.7% 76.0%
Cash Position ($000s)3 89,603 62,311 31,107 36,521
Employee Satisfaction Rate
69 71 72 73
(Glint Survey)
Resignation Rate (Trailing 12
3.64% 5.5%WASTE SERVICES UTILITY
2021 Utility Rate Filing
5.0 Landfill Closure and Related Liabilities
The Utility’s landfills include a Class II and Class III landfill which are currently being prepared for complete closure and reclamation in accordance
with operating approval from Alberta Environment and Parks (AEP). The Clover Bar Landfill (Class II) reached full capacity and was closed in August
2009, while the Class III landfill, originally established for the 1987 tornado debris, ceased operations in 2008.
Pursuant to the Alberta Environmental Protection and Enhancement Act, the Utility is required to fund the closure of its landfill site and provide
for post-closure care of the site. Closure and post-closure activities include the final clay cover, landscaping, surface and groundwater monitoring,
leachate control, landfill gas management and visual inspection. The minimum period for post-closure care is 25 years and the landfill closure and
post-closure care plans are based on engineering assessment of current ground conditions, leachate levels, geology, and various other
environmental and regulatory conditions. The costs to close and maintain solid waste landfill sites are based on estimated future expenses,
adjusted for inflation and discounted to current dollars. These costs are reported as a liability on the Statement of Financial Position in accordance
with Canadian Public Sector Accounting Standards (PSAS). Future events, such as changes to regulatory requirements, may result in changes to
the estimated cost and will be recognized prospectively as an adjustment to the reported liability, when applicable.
The following table summarizes the estimated liability and expected disbursements required to complete closure activities:
15WASTE SERVICES UTILITY
2021 Utility Rate Filing
The reported liability for landfill closure and post-closure care on the Statement of Financial Position as at December 31, 2019 was $45.6 million.
The Utility anticipates closure activities such as design and construction of stormwater management, leachate collection, landfill gas collection,
final clay cover, landscaping, etc. to be completed by the end of 2022. From the time of final closure, the minimum period for post-closure care is
expected to be 25 years and includes operating and maintenance activities such as final cover inspection and maintenance, landfill gas collection
and flare system maintenance, leachate monitoring, treatment and disposal, etc. Significant changes to cost estimates in the future may result in
a future adjustment to the landfill liability and subsequently the annual landfill provision.
By the end of 2022, an estimated $29.6 million out of the $45.6 million liability is expected to be spent for landfill closure activities, see line # 2 in
the table above. The remaining $15.8 million at the end of 2022 is expected to be spent for landfill post-closure activities over a period of 25 years
starting in 2023, see line # 3 in the table above. The Utility through its 2020 rate filing received approval to collect $1.3 million annually for 25
years to fully fund the landfill liability. Collecting the required sum over the full term of the post-closure activities will minimize the impact to
ratepayers and allow the Utility to maintain stable, consistent rate increases.
The restricted cash balance maintained by the Utility for the landfill liability as at December 31, 2019 was $25.7 million. The restricted cash
balance for 2020 is estimated to be at $22.2 million after accounting for the collection of $1.3 million through rates and estimated disbursement
of $4.8 million for closure activities during the year ($25.7M + $1.3M - $4.8M). The restricted cash balance in 2021 is estimated to be fully
depleted after accounting for the collection of $1.3 million through rates and estimated disbursement of $23.5 million for closure activities during
the year ($22.2M + $1.3M - $23.5M). However, as can be observed from line #4 and line #6 of the table above, the Utility’s projected cash
position in each year after accounting for landfill disbursements and Pay As You Go cash required to fund capital expenditures is positive and
sufficient to fulfill its estimated landfill obligations.
16WASTE SERVICES UTILITY
2021 Utility Rate Filing
6.0 Financial Rate Impacts
The financial rate impacts below represent the incremental change to the Utility Rate from the previous year. The resulting rate impacts reflect
the services and processes required to support the Waste Services Utility’s mission, values and strategic initiatives. The rate impacts have been
grouped into three categories: Operating Impacts, Capital Impacts on Operating and Other Impacts.
17WASTE SERVICES UTILITY
2021 Utility Rate Filing
Operating Impacts
The increase in Operating Impacts from the 2020 budget includes one-time and ongoing costs related to the rollout of the Source
Separated Organics Program. This includes temporary staff, additional materials, goods and supplies and external services. The program
was planned to be implemented in 2020 but was delayed to 2021 due to COVID-19.
Capital Impacts
The increase in the capital impact for 2021, relative to the 2020 budget, is mainly driven by additional “in-service” dates of assets, resulting
in increased amortization in 2021.
Other Impacts
● Non-rate Revenue impact is the result of increased revenue from other program revenue which includes revenues generated from
third parties operating at the Edmonton Waste Management Centre based on agreements, such as sharing of third party sales
revenues. Also included in this category are revenues generated from environmental initiatives such as the Sale of Landfill Gas credits.
● Based on current economic conditions and housing starts, the customer base is forecast to grow in 2021. This growth allows regulated
revenue to be allocated over a larger base therefore controlling the per unit Residential Customer Rate increase. The greater number
of residential waste collection pick-ups will generate higher regulated revenue which will be used to offset the associated residential
waste collection operational costs.
● To address non-regulated program losses and achieve target cash balances, the Waste Services Utility was given authorization through
the 2015 Operating Budget process to draw on a short-term loan from the City of Edmonton beginning in 2015. This ensures
non-regulated losses are covered by the loan as opposed to regulated revenues and assists in reducing non-regulated rate increases.
● Approval of the Waste Management Utility Fiscal Policy C558A resulted in changes to the rate revenue calculation. A requirement for
Pay As You Go (PAYG) funding is now included as part of the rate revenue calculation to ensure sufficient cash is generated to meet the
Utility's current and future capital needs. The Rate of Return is calculated to achieve a Net Income position to meet cash and/or PAYG
targets. This places greater emphasis on long-term planning and the financial sustainability of the Utility.
18WASTE SERVICES UTILITY
2021 Utility Rate Filing
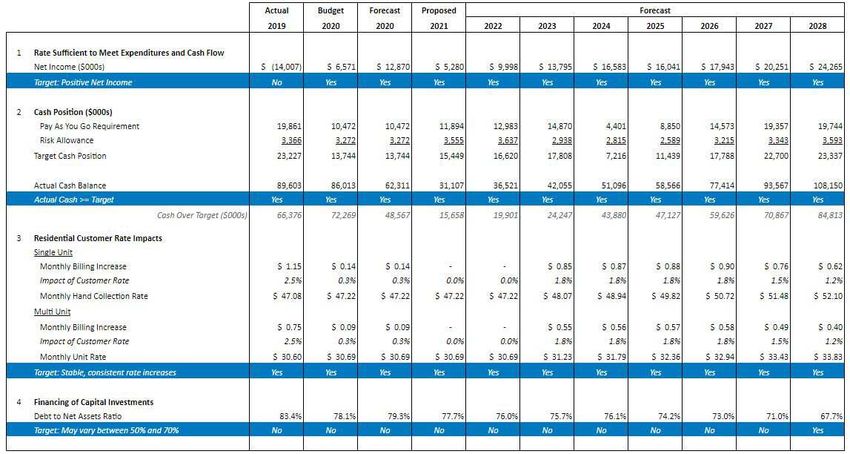
7.0 Financial Indicators & Risk Allowance
The Waste Management Utility Fiscal Policy C558A was adopted by City Council on September 23, 2014. The updated policy focuses on four
Financial Indicators used to monitor the financial health of the Utility as illustrated below:
19WASTE SERVICES UTILITY
2021 Utility Rate Filing
7.1 Cart Rates
Single Unit Residential Curbside customers will transition from the monthly Hand Collection Rate of $47.22 to new variable cart rates based on the
size of their garbage (black) cart following the implementation of cart-based collection to all single unit customers. Cart rates will be in effect
beginning in October 2021, following cart size selection, cart distribution and updating the customer billing system with customer cart size
information. The following table outlines the proposed cart rates.
2021 Cart Rates (effective October 2021)
Garbage Cart Size Monthly Rate
(in litres)
120 L $43.32
240 L $48.32
360 L $58.32
Compared to the Residential Curbside Hand Collection Rate: customers who select a 120 litre garbage cart will see a $3.90 reduction in their
monthly waste utility rates; customers selecting a 240 litre garbage cart will see their monthly rates increase by $1.10; and customers who select a
360 litre garbage cart will see their monthly rates increase by $11.10. Effective October 1, 2021 the difference between the 120 litre rate and the
240 litre rate will be $5.00 per month and the difference between the 240 litre rate and the 360 litre rate will be $10 per month. The cart rates
provide financial incentives for customers who embrace waste reduction and waste sorting behaviours that reduce the amount of garbage they
generate and help to achieve the City’s waste diversion targets.
Waste Services worked with a third party consultant to develop a customer cost model that allocates costs to the single unit customer class based
on the size of the garbage cart selected. The utility rate model has been updated accordingly and is in alignment with the proposed rate differential
as discussed in the City Council approved Single Unit Waste Set-Out Business Case (CR_7173). Subsequent to the approval of this Business Case,
Waste Services has modified its Excess Waste program to be more responsive to customer needs by introducing a larger, 360 litre garbage (black)
cart for those customers that require special consideration for persistent excess waste. The proposed rate differential between the 360 litre cart
and the 240 litre cart is $10 in order to recover costs as well as provide a financial incentive to minimize waste generation at the household level.
In order to meet the Utility’s revenue requirement, rates were designed based on the anticipated proportion of customers selecting a particular
size of garbage cart. As cart size selection will be available for residents beginning in December 2020 and continuing into 2021, the actual cart size
20WASTE SERVICES UTILITY
2021 Utility Rate Filing
adoption rate is not known at the time of rate filing. The anticipated cart size adoption ratios used to calculate rates in this rate filing are based on
the ratios considered as part of Single Unit Waste Set-Out Business Case (CR_7173), and updated due to the introduction of the 360 litre cart. The
following table outlines the assumed cart size adoption ratio.
Garbage Cart Size Assumed Adoption
(in litres) Percentage
120 L 24%
240 L 75%
360 L 1%
7.2 General Comments for Financial Indicators
Target: Rates Sufficient to Meet Expenditures
The proposed and forecasted years all meet the requirement of generating sufficient net income to cover operating expenses.
Target: Cash Position
The target cash position for Waste Services includes capital funding to meet Pay As You Go (PAYG) requirements for the next fiscal year plus a risk
allowance to mitigate exposure, such as volatility of the markets for recyclable commodities, as outlined in the Waste Management Utility Fiscal
Policy C558A. As the Utility moves to citywide implementation of source separation of organics and invests in necessary upgrades for the Material
Recovery Facility (MRF) and Refuse Derived Fuel Facility (RDF) to improve efficiency, the PAYG requirement is expected to remain high at $11.9
million in 2021. The calculation of the risk exposure includes the following identified risks (in thousands of dollars):
21WASTE SERVICES UTILITY
2021 Utility Rate Filing
The allowance for operational impacts and strategic changes include provision for operational risks associated with the citywide cart rollout and
implementation of source separated organics.
After accounting for the PAYG requirements and risk allowance, the cash balance is positive in all years due to the significant cash reserves held for
both the Landfill Post Closure Liability and the Bremner Lagoon Liability.
Target: Low, Stable and Consistent Rate Increases
As the Utility moves toward financial sustainability, achieving stable and consistent rate increases has been given a high priority. The target will be
achieved with a proposed zero percent rate increase in 2021. In order to achieve this target, the Utility will focus on service delivery
transformations, monetization of waste byproducts, enhanced asset optimization and operational efficiencies.
22WASTE SERVICES UTILITY
2021 Utility Rate Filing
Target: Debt to Net Assets Ratio
The Utility has recommitted itself to enhanced asset management and thoughtful replacement of damaged and underperforming assets through
ongoing prioritization of capital projects. When coupled with significant strategic program changes to be implemented in 2021, this heightened
focus on increasing the productivity of all of Waste’s assets results in the target for the Debt to Net Asset Ratio being achieved in 2028.
The Utility concluded a review of its fiscal policy during 2020 and will be recommending updates to the fiscal policy including changes to the Debt
to Net Assets ratio as a financial indicator under a separate report in December 2020 (CR_7840).
23WASTE SERVICES UTILITY
2021 Utility Rate Filing
8.0 Utility Summary Schedule
(in thousands of dollars)
Line 1 - Operations and Maintenance
The increase in operations and maintenance from the 2020 Forecast primarily reflects expected costs related to the implementation of the
Source Separated Organics program in 2021. The implementation of the program was delayed until 2021 due to COVID-19. As a result of the
delay, 2020 program costs of approximately $4.2 million were not expected to be incurred and on April 27, 2020, the Utility passed those
savings to ratepayers by reducing its operating expenses and rate revenue for 2020 by $4.2 million. Other increases include increased utility
costs required for the Refuse Derived Fuel Facility and Anaerobic Digestion Facility, and anticipated cost increases due to customer growth.
24WASTE SERVICES UTILITY
2021 Utility Rate Filing
This will be partially offset by decreased Fleet repair and maintenance costs due to replacement of aging fleet and reduction of costs related
to the wind down of the Commercial Collection business.
Line 2 - Amortization of Non-Contributed Assets
Increases in amortization result from upcoming commissioning of Materials Recovery Facility (MRF) renewal, Source Separated Organics
Program initiatives, site infrastructure and facilities projects, and vehicle and equipment purchases.
Line 6 - Amortization of Regulatory Asset
A deferral account was approved in the Utility’s 2019 Rate Filing to allow the Utility to recover the incurred Edmonton Composting Facility
expenses through customer rates over a reasonable time period in order to minimize the rate impact and to maintain stable and consistent
rate increases.
Amortization of the regulatory asset represents the annual amount of the deferral balance recovered through Utility rates in a given period.
The increase from 2020 to 2021 represents additions to the deferral account for the Edmonton Composting Facility additional write-down of
unsalvageable equipment. Please refer to schedule 10.2 for additional details.
Line 7 - Non-Rate Revenue
Decrease in non-rate revenue includes a reduction in Commercial Collection revenue as a result of the strategic decision to exit the
non-regulated line of business; and decrease in grant revenue as all project milestones are expected to be fully achieved by the end of 2020;
partially offset by increases to Eco Station revenue.
Line 8 - Rate Revenue
Increase in rate revenue is primarily driven by Pay As You Go requirements to support capital, additional requirement to fund landfill liability,
deferral account increases related to Edmonton Composting Facility (ECF) decommissioning and equipment write-down, and additional
requirements to implement the Source Separated Organics program.
Further detailed analysis of proposed expenditures and revenues are provided in subsequent schedules.
25WASTE SERVICES UTILITY
2021 Utility Rate Filing
9.0 Operations and Maintenance
(in thousands of dollars)
26WASTE SERVICES UTILITY
2021 Utility Rate Filing
Line 8 - Other Expenses
Other expenses primarily include insurance premiums associated with waste collection and processing facilities at EWMC and Eco Stations,
bad debt expense and service charges for credit/debit card processing at EWMC scalehouse and Eco Stations.
Impact on Bad Debts due to COVID-19 and Utility Bill Payment Deferral Program
In response to the COVID-19 pandemic, on March 20, 2020, City Council approved a 90-day utility bill payment deferral program for Waste
Services and EPCOR water, wastewater and drainage customers. This bill payment deferral program allowed customers in need to defer their
utility bill payment without interest or penalty, for 90 days, ending on June 18, 2020. Since EPCOR provides the billing function for Waste
Services on behalf of the City of Edmonton, with one consolidated bill being provided by EPCOR to customers for electricity, water and waste
services, a coordinated approach was implemented and communicated by EPCOR and Administration for the 90-day deferral program.
Approximately 12 percent of EPCOR’s customers, including Waste Services customers, enrolled in the deferral program by the end of the 90
day period on June 18, 2020. The enrolled customers are required to repay the deferred amounts during the period June 19, 2020 to June 18,
2021.
The Utility self-financed its portion of the deferred payments during the program. As of September 30, 2020, approximately $1 million in
deferred payments pertaining to waste customers remain outstanding to be collected. It is anticipated that the majority of these customers
with outstanding payments will either pay their balance in full or will sign up to make payment arrangements with EPCOR to repay their
outstanding balance by June 18, 2021. The average bad debts experienced over the past three years was approximately $650,000 or 0.3
percent of rate revenues. Given the current economic environment with high unemployment rates, the Utility may experience increased bad
debts as compared to the past. The Utility will continue to monitor the outstanding deferred bill payment balance and book a provision for
bad debts in its 2020 year end financial statements. In the event, the incremental bad debts exceed $500,000, the Utility will establish a
deferral account in its 2022 rate filing to track and recover the incremental bad debt costs and carrying cost at its short-term interest rate.
Line 13 - Grants
Grants reflected are flow through, received from Alberta Innovates Energy and Environment Solutions and disbursed to the owner of the
Edmonton Waste to Biofuels and Chemical Facility upon achievement of contractual milestones. The net operating impact of these grants is
zero with the offset in grant revenue (Schedule 11.1). No additional grant for this facility is expected in 2021. For additional details, please refer
to the schedule for each line.
27WASTE SERVICES UTILITY
2021 Utility Rate Filing
9.1 Personnel
(in thousands of dollars)
Personnel costs include Wages, Overtime, Employment Allowances and Benefits. The City of Edmonton’s Capital and Operating Budget
System (COBS) utilizes the City's payroll system as the source for the personnel budget for both wages and benefits, thereby providing a
reliable and consistent source of information. Vacant positions are set at mid-range with family benefits. Included in the 2021 Proposed
Budget is an assumption of a vacancy discount of four percent for all positions.
Line 1 - Wages
The change in wages from the 2020 Forecast primarily reflects increases related to temporary staff required for the Source Separated
Organics Program rollout in 2021-2022. Implementation of the program was delayed due to COVID-19 until 2021.
Line 2 - Overtime
Overtime is expected to increase over the 2020 forecast primarily to support the implementation of the Source Separated Organics Program
rollout in 2021-2022 and due to the additional requirements for the seasonal grass, leaf and yard waste collection.
Line 3 - Allowances and Benefits
Benefits mainly consist of Local Authorities Pension Plan (LAPP), Canada Pension Plan, Employment Insurance, Major Medical and Dental Plan,
Group Life Insurance and Health Care Spending Account.
28WASTE SERVICES UTILITY
2021 Utility Rate Filing
9.2 Materials, Goods & Supplies
(in thousands of dollars)
Line 6 - Other
Other includes cost to support the implementation of the Source Separated Organics Program in 2021. In addition, Other includes hired
equipment and direct materials required for the Aggregate Program. The decrease in Other from the 2020 Forecast is primarily related to an
adjustment to the delivery of the litter collection service as part of the reimagining of City services in 2021.
29WASTE SERVICES UTILITY
2021 Utility Rate Filing
9.3 External Services
(in thousands of dollars)
Line 1 - Waste Collection Services
Collection Services external contracts include single and multi-unit residential garbage and recycling collection as well as costs for contracted
equipment, services at Eco Stations and other Collection Services programs.
Contract work is anticipated to increase due to population growth and increased waste volume. Current contracts are adjusted annually using
a cost index that includes CPI, fuel and labour to better reflect annual changes in direct operating costs. In addition, the increase includes
additional cost to support phased implementation of the Source Separated Organics Program which was due to begin in 2020 but delayed due
to COVID-19. The program in 2021 includes additional costs for assisted waste collection, and seasonal grass, leaf and yard waste collection.
30WASTE SERVICES UTILITY
2021 Utility Rate Filing
Line 2 - Materials Recovery Facility
The Materials Recovery Facility (MRF) sorts and processes recyclables collected through the blue bag and recycling depot programs. A small
reduction from the 2020 Forecast is the result of a planned upgrade to the plant, resulting in anticipated lower operating costs. Operational
efficiencies and cost savings from the upgrade is anticipated to be realized in 2022.
Line 3 - Organics
Contracted organics costs include operations and maintenance cost for the High Solids Anaerobic Digestion Facility (HSADF) which is
anticipated to start commissioning in Q4 2020, allowing for approximately 40,000 tonnes per year of organic material to be processed and
diverted from landfill. In addition, the forecasted cost in 2021 includes cost for processing organics under a number of distributed off site
processing contracts with the private sector, allowing for an additional 60,000 tonnes per year to be processed and diverted from landfill for
the next five years (starting in Spring 2021). Through successful contract negotiations and utilizing a competitive Request for Proposal (RFP)
process, the Utility has managed to reduce its contracted cost for organics processing.
Line 4 - Integrated Processing & Transfer Operations (IPTF)
Feedstock for waste-to-biofuels or waste-to-energy applications is prepared at the Refuse Derived Fuel facility, located within the IPTF.
Higher demand for the product results in higher contract costs for the IPTF. Waste Services pays a contractually agreed upon fee to the
Waste to Biofuels and Chemicals Facility for the conversion of feedstock into alcohol fuels. The fee includes a tipping fee for the delivery of
acceptable feedstock to the facility.
Line 5 - Haul and Landfill Operations
Hauling and Landfill Operations represents the contract fees for all of Waste Services Utility operations. The increase from the 2020 Forecast
is related to additional hauling tonnage related to regional organics and the closure of the MRF for plant upgrades. These costs are partially
offset by reductions in hauling costs related to feedstock going to the Waste to Biofuels facility and expected tonnage processed at the
HSADF.
Line 6 - Construction and Demolition Facility
The Construction and Demolition Facility was operated by City staff with significant additional contracted services including the provision of
labour, equipment maintenance services and supplements to the Utility’s operations to meet peak demands in grinding and crushing of
wood. The wood grinding operation required extensive contract work to mitigate the risk of fire and to prepare feedstock for the Waste to
31WASTE SERVICES UTILITY
2021 Utility Rate Filing
Biofuels Facility. The decrease in Construction and Demolition (C&D) costs reflects Council’s direction to exit the City’s current C&D business
line and to secure an operational partner. A third party began operation of the C&D service in 2020.
Line 7 - Customer Billing Services
Waste Services has a contract with EPCOR for the provision of customer billing and collection services. EPCOR replaced its billing system with
a modern cloud based system in 2020, and the new system is expected to provide a more streamlined billing service.
Line 8 - Other
The increase in Other contract costs from the 2020 forecast is primarily related to additional one-time operating costs for education and
outreach, social marketing, digital strategy and communications to support the implementation of the Source Separated Organics Program in
2021. Contract costs related to Community Relations and Program Management, Administrative Services, and other facilities such as Eco
Stations, Edmonton Waste Services Centre Operations, Advanced Energy Research Facility, Research & Development and Environmental are
also included under Other.
32WASTE SERVICES UTILITY
2021 Utility Rate Filing
9.4 Fleet Services
(in thousands of dollars)
As Fleet Services recovers 100 percent of branch costs, a portion of indirect branch overhead is charged to Waste Services. The indirect
overhead is allocated through work order fees, vendor work charges and fuel surcharges. The remaining overhead costs are recovered through
shop rates on shop labour hours. Indirect overhead includes branch administration, training, engineering, procurement, safety, client relations
and facility and equipment maintenance. Estimates for Fuel and Direct Charges & Repairs are estimated by Fleet Services in consultation with
Waste Services and aligned with Fleet Services four-year operating budget.
Waste Services Utility is moving towards management of their vehicle and equipment replacement which has resulted in a decrease to the
reserve contribution to the Fleet Services Replacement Reserve. This results in Waste Services purchasing vehicles through its own capital
program rather than through Fleet Services. As older equipment purchased by Fleet gets replaced, the remaining reserve contribution will
continue to decline.
The increase in fuel from the 2020 Forecast reflects an anticipated increase in consumption related to additional equipment for the Source
Separated Organics Program.
The decrease in Direct Charge & Repairs from 2020 Forecast reflects anticipated normal level of repairs due to replacement of aging fleet.
33WASTE SERVICES UTILITY
2021 Utility Rate Filing
9.5 Shared Services
(in thousands of dollars)
The City of Edmonton employs a Shared Services model whereby support services required for the operations of all City businesses are
provided through centralized areas of expertise. This approach takes advantage of efficiencies gained through economies of scale and
opportunities to provide more robust systems and services (e.g. technology related services). The Waste Management Utility Fiscal Policy
C558A requires that the Utility operate under a full cost approach thus requiring the Utility to pay for its portion of shared services.
In its 2020 rate filing, the Utility committed to initiating a benchmarking study to validate the reasonableness of shared service costs allocated
to the Utility. The study was to be initiated during the second quarter of 2020 however, in light of COVID-19, the study was postponed to be
undertaken in the future as some of the jurisdictions expressed their reluctance to participate due to resource constraints. The increase from
the 2020 forecast primarily reflects cost for 2.0 FTEs from IIS - Facilities Planning and Design to support the development of the Organics
Processing Facilities project; partially offset by reduction in charges from Financial Services.
34WASTE SERVICES UTILITY
2021 Utility Rate Filing
9.6 Intra-Municipal Services
(in thousands of dollars)
Intra-Municipal Services are charges for on-demand services provided through other City of Edmonton programs which are not incorporated in
shared services charges. These are direct charges for services such as dedicated support for communication and engagement initiatives, on
demand building repairs and maintenance, posting of vacant positions to job sites and security services for special events.
Line 4 - Law
The increase in direct charges from the 2020 Forecast is related to an increase in security costs at the Edmonton Waste Management Centre.
Line 8 - Other
Other includes costs primarily related to Aggregates and health and safety. The increase in Other costs from the 2020 forecast is primarily
related to Aggregates crushing. Increase in Aggregates costs are fully offset by higher Aggregates revenues reported on line 7 Other Program
Revenues under Schedule 11.1.
35WASTE SERVICES UTILITY
2021 Utility Rate Filing
9.7 Utilities
(in thousands of dollars)
Power, natural gas and water estimates are provided by Urban Form and Corporate Strategic Development, Economic and Environmental
Sustainability. Estimates are based on historical consumption and future forecasted rates for current service levels. Service level changes are
applied to the estimates to determine the budget numbers for each utility.
Line 1 - Power
Line 2 - Natural Gas
The increase in natural gas from the 2020 Forecast reflects the increase related to the Anaerobic Digester which will be commissioned by the
end of 2020 and the Refuse Derived Fuel facility as requirements for feedstock is expected to increase.
36WASTE SERVICES UTILITY
2021 Utility Rate Filing
9.8 Intra-Municipal Recoveries
(in thousands of dollars)
Intra-Municipal Recoveries are billings to other areas within the City of Edmonton for services provided by the Waste Services Utility. These
recoveries include direct charges such as litter collection charged to Capital City Clean-Up and charges to other City of Edmonton areas for
disposal of waste at the Edmonton Waste Management Centre.
Line 1 - Litter Collection Recovery
The decrease in Litter Collection Recovery from the 2020 forecast is related to an adjustment to the delivery of the litter collection service as
part of the reimagining of City services in 2021.
Line 2 - Landfill Disposal Fees
The change in landfill disposal fees from the 2020 forecast is related to reduced tip fees from the wind down of the Commercial Collection
program.
Line 3 - Charges to Capital
As in-house engineers work on capital projects, a portion of their time is capitalized to the project(s) instead of being charged to operating
expenses.
37WASTE SERVICES UTILITY
2021 Utility Rate Filing
10.0 Amortization and Interest Expense
(in thousands of dollars)
38WASTE SERVICES UTILITY
2021 Utility Rate Filing
Amortization expense represents the amount of asset life used during a given operating period. The rate of amortization is dependent upon
the asset class, each with a predetermined estimated useful life based upon historical experience. Waste Services Utility's assets are divided
into 47 different classes with useful lives varying between three years and extending up to 60 years. Amortization expense is calculated using
the straight-line method which incurs half year expenses in the first and last year of the asset’s life.
Interest expense includes both interest for Alberta Capital Financing Authority (ACFA) debentures related to capital projects, as well as interest
on short-term loans from the City of Edmonton. Projected rates are provided by the City of Edmonton Budget Office and are based on recent
ACFA rates and economic conditions (see section 3.0 Methodology and Key Assumptions).
Line 1 - Amortization of Non-Contributed Assets
The annual increases in amortization result from upcoming commissioning of Materials Recovery Facility (MRF) renewal, Source Separated
Organics Program initiatives, site infrastructure and facilities projects, and vehicle and equipment purchases. The majority of existing assets will
not reach the end of their useful life for several more years.
Line 2 - Amortization of Contributed Assets
Amortization of Contributed Assets represents the amount of benefit from assets which were received or funded by third parties. The
amortization from contributed assets decreases the amount of total amortization expense for the Waste Services Utility. Amortization of
Contributed Assets are the benefits received from the Advanced Energy Research Facility funded by Alberta Innovates - Energy and Environment
Solutions, and Edmonton Waste Management Centre Site 440 infrastructure. A large portion of Site 440 construction was funded by an external
third party.
Lines 5 and 8 - Short-Term Interest and Short-Term Debt Principal Repayments
Refer to Schedule 10.1 for additional details.
39WASTE SERVICES UTILITY
2021 Utility Rate Filing
10.1 Short-Term Loan from the City of Edmonton
(in thousands of dollars)
Line 1 - Loan to Cover Non-Regulated Program Losses and Maintain Cash Flow
To address non-regulated program losses and achieve target cash balances, the Waste Services Utility was given authorization through the
2015 Operating Budget process to draw on a short-term loan from the City of Edmonton beginning in 2015. This ensures that non-regulated
losses are covered by the loan as opposed to regulated revenues and assists in reducing non-regulated rate increases. Principal and Interest
(1.5%) are paid annually for ten years from the first draw in 2015. Interest payments are reflected entirely within non-regulated program
expenses. As of December 31, 2019, a draw of $9.07 million was made against this loan to cover losses related to the non-regulated business
lines.
Moving forward, modest profits are anticipated to be generated by the remaining two non-regulated business lines (Commercial Self-Haul and
Aggregates Recycling), as shown on schedule 13.1. A portion of the future profits may need to be earmarked for the development of the
Industrial, Commercial and Institutional (ICI) waste reduction initiatives. Loan repayment options shall be brought forward under a separate
report in December 2020.
40WASTE SERVICES UTILITY
2021 Utility Rate Filing
10.2 Deferral Account Balances
(in thousands of dollars)
*In the 2019 Rate Filing, an estimated provision of $1.5 million was included for demolition cost in the approved deferral account balance of $15.7 million (on line 2). The required
deferral account addition for deconstruction cost (on line 4) has therefore been reduced by $1.5 million for calculating rates from the current deconstruction cost estimate of $12
million.
The Waste Services deferral account is a rate regulated accounting mechanism which allows the Utility to minimize rate volatility for ratepayers, by
recovering approved cost from ratepayers over a period of time compared to when the costs are actually incurred. This results in the Utility
41WASTE SERVICES UTILITY
2021 Utility Rate Filing
recording a regulatory asset for the deferral account balances, which is amortized over a reasonable time period to allow the Utility to recover
costs from ratepayers while ensuring rate stability.
Lines 2-5: Impairment of ECF & Deconstruction Cost
Line 2 - During 2017, structural issues associated with the Aeration Hall roof were identified resulting in an initial financial impairment of $15.7
million. Waste Services received approval to create a deferral account for this impairment through its 2019 Rate Filing to minimize impact to
ratepayers.
Lines 3 and 4 - In spring 2019, it was concluded that the facility was no longer safe to continue operating and to begin the shut down process to
permanently decommission the facility. This decision was based on structural scan and in collaboration with external structural engineers. As a
result, there was an additional impairment related to unsalvageable equipment of $5 million. In addition, the facility deconstruction cost was
estimated at $12 million. Waste Services received approval to incorporate the 2019 impairment and deconstruction cost as additions to the
previously approved deferral account balances through its 2020 rate filing to minimize impact to ratepayers.
Line 5 - One of the options explored for interim organics processing in 2019 and prior to the commencement of ECF deconstruction work
included the possibility of salvaging equipment worth $3.3 million from the aeration hall during the deconstruction of the ECF and repurposing
those salvaged assets for processing organics as part of the interim solution. As a result, the impairment recorded during 2019 excluded $3.3
million worth of equipment that was expected to be repurposed for interim organics. During the course of deconstruction it became clear that
the option to salvage the equipment was cost prohibitive and increasingly challenging to achieve the desired outcome. An impairment of $3.3
million will be recorded at the end of 2020 related to these equipment. The additional impairment cost on line 5 related to these assets have
been incorporated as additions to the previously approved deferral account balances in this rate filing to minimize impact to ratepayers.
Lines 8 - 11: Amortization of Regulatory Asset
The amortization of the regulatory asset represents the annual amount of the deferral balance recovered through Utility rates. The
amortization period used for the regulatory asset closely matches the remaining useful life of the original asset, and in the case of
decommissioning costs a reasonable time period that minimizes rate impact while balancing inter-generational equity. The Utility will monitor
its deferral account balances for appropriate additions or adjustments to the amortization periods when justified.
42WASTE SERVICES UTILITY
2021 Utility Rate Filing
11.0 Revenue Requirement
(in thousands of dollars)
Waste Services Utility Fiscal Policy C558A was adopted by City Council on September 23, 2014. As per this policy, "At a minimum, the projected
total revenue generated will be equal to the projected expenses for the year, including sufficient cash to meet the cash flow requirements of the
Utility." Costs associated with Contributed Capital, such as amortization, are excluded as these are not eligible to be funded through regulated
utility rates.
43WASTE SERVICES UTILITY
2021 Utility Rate Filing
11.1 Non-Rate Revenue
(in thousands of dollars)
Line 1 - Tip Fees Revenue
Tip Fee Revenues are generated by private haulers disposing of waste materials at the Edmonton Waste Management Centre (EWMC).
Line 2 - Construction and Demolition (C&D) Waste Revenue
Processing of C&D waste and operations of the C&D facility is provided by a third-party based on the strategic direction to exit the C&D
non-regulated business line. The revenues forecasted for C&D relate to royalties received from the third-party operating the facility.
Line 3 - Materials Recovery Facility Revenue
Materials Recovery Facility (MRF) revenue from the sale of recyclable materials are highly influenced by both the commodities market and
the US exchange rate. MRF revenues are anticipated to be lower due to lower market demand of materials.
44You can also read