CIO Strategy Bulletin - ASSET ALLOCATION FOR RAPIDLY EVOLVING MARKETS - Citi Private Bank
←
→
Page content transcription
If your browser does not render page correctly, please read the page content below

Citi Global Wealth Investments

February 20, 2022

CIO Strategy Bulletin
ASSET ALLOCATION FOR RAPIDLY EVOLVING MARKETS
David Bailin, Chief Investment Officer and Head of Citi Global Wealth Investments
Steven Wieting, Chief Investment Strategist and Chief Economist
Ken Peng, Head, Asia Investment Strategy
Ligang Liu, Head, APAC Economics

Summary
    •   As market condition change – and they are evolving quickly in the US – it is important to change
        what is in portfolios to reflect a variety of possible outcomes.
    •   We have increased our portfolio exposure to intermediate US Bonds by 4%. At a 2% or even 2.5%
        yield, the real return is likely to be marginally negative for the coming decade. This would not
        make such bonds an especially attractive investment. But these days the attractiveness of US
        Treasuries as a portfolio risk hedge is increasing, not decreasing.
    •   Fiscal stimulus, unusual consumer spending patterns, disrupted production and labor
        displacement together, created the atypically large inflation we are experiencing just now. When
        we look at spending through the end of 2021. however, we see that inflation-adjusted consumer
        goods expenditures have fallen 5% after reaching a peak last April. With fiscal stimulus in the
        rear-view-mirror, we believe inflation will peak over the next couple of months as supply begins to
        catch up to demand.
    •   We left intact specific equity over-weights in global healthcare, cybersecurity/fintech and payments,
        strong dividend growers in large caps globally, and China. These Global Investment Committee
        (GIC) moves reflect our views on where relative value can be found in equity markets and where we
        expect stronger and more secure returns to come from in this transitional market environment.
    •   As the inflationary boom ends, and the Fed possibly over-reacts, a peak in long-term yields may
        also define the trough for higher quality US growth stocks. When rates do peak, and we think that
        may be sooner than many expect, the pressure on growth stocks is likely to abate. While timing is
        never clear with foresight, this could plausibly be after the Fed’s first interest rate increase,
        particularly if it takes bold action with a 50-basis point increase
    •   Please also see our CIO BULLETIN SPECIAL REPORT: HONG KONG’S FIFTH COVID WAVE
        contained herein.

1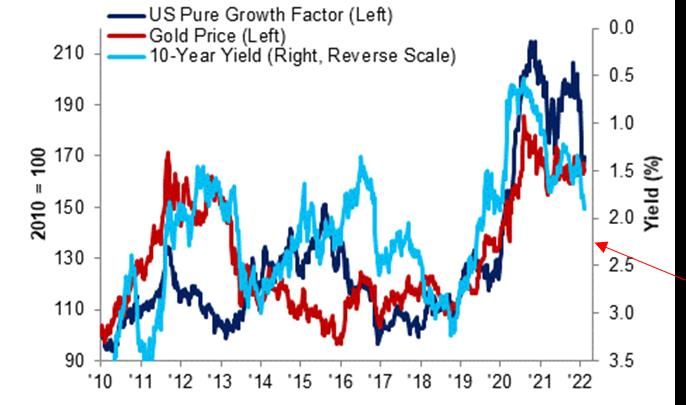
EVOLVING MARKETS, CHANGING ASSET ALLOCATION
We have always written that market timing is a fool’s game. It is virtually impossible to predict the worst and best
days of markets. At the same time, as market condition change – and they are evolving quickly in the US – it is
important to evolve what is in portfolios to reflect a variety of possible outcomes.
With a rapid 150 basis point gain in intermediate duration US Treasury yields over the past 12 months – the
majority of the gain seen in any Fed tightening period since the 1980s – our Global Investment Committee raised
its weighting in lower risk medium-duration fixed income holdings by 4 percentage points last week (figures 1 and 2).
Here’s why…

 Figure 1: US 10- and 5-Year Note Treasury Yields,                           Figure 2: Largest Overweights
 12-Month changes

 Source: Haver Analytics and Citi Global Wealth Investments as of February 18, 2022. Past performance is not indicative of future returns.

WHY A BIT MORE IN BONDS?
For the first time since July 2019, 10-year Treasury yields pierced the 2% level in early February. Our Outlook
2022 forecast anticipated 10-year US yields above 2% this year. We think the yield could average 2.5% in a
sustained expansion period. At 2% or even 2.5%, the real yield is likely to be marginally negative for the coming
decade. This would not make bonds an especially attractive investment.
Yet, these days the attractiveness of US Treasuries as a portfolio risk hedge is increasing, not decreasing. For
example, if the Fed “engineered” an economic downturn in the US with abrupt and severe monetary tightening,
risk adverse investors would likely drive yields down again, making bonds a worthy risk hedge in portfolios.
For now, we do not assume that the Fed will move that drastically. We expect a natural slowing of the US
economy. This will be led by a marked decline in US federal government spending due to the absence of further
Covid stimulus. We think spending in 1Q 2022 will fall 42% from 2021 if the government just returns to pre-Covid
spending levels. (Actual data for January 2022 showed federal spending down 37% from January 2021.) At the
same time, the US posted its largest budget surplus for any January period on record (see figures 3-4). This is a
marked change from the period in which the Federal government was injecting stimulus. It is now withdrawing.

2

Figure 3: US Federal spending                               Figure 4: US budget surplus/deficit

 Source: Haver analytics as of February 16, 2022.

UNDERSTANDING THE POST-COVID ENVIRONMENT
The COVID pandemic reshaped consumer preferences. The extraordinary fiscal stimulus led a spending boom for
consumer goods. Nominal consumer spending rose 12.1% in 2021 (see figures 5-6). This excessive spending
was the key difference from the Quantitative Easing period of 2008-2009. At that time there was no direct support
for consumers. This time, with money in their pockets and many people at home, unable to travel or return to
their places of work, they spent excessively on goods.

 Figure 5: US Federal Reserve credit vs Federal government   Figure 6: US Federal Reserve credit vs consumer spending
 spending (including personal income support)                (nominal dollars)

 Source: Haver analytics as of February 16, 2022.

We would remind readers that money printing alone does not cause inflation. Excessive money spending does.
And when you add unusual spending, disrupted production, shipping shortages and labor displacement together,
you get the atypically large inflation we are experiencing just now.
The period of Covid support for US taxpayers is now behind us. The last COVID stimulus checks were issued
almost a year ago in March of 2021. When we look at year-over-year spending, we see that inflation-adjusted
consumer goods expenditures have fallen 5% after reaching a peak last April. Still-depressed spending on
services managed to grow a stronger 4% since April 2021. Overall, real consumer spending grew a mere 0.4% in
the eight months through December 2021. Therefore, excessive consumer spending is not driving inflation further
(see figures 7-8).

3
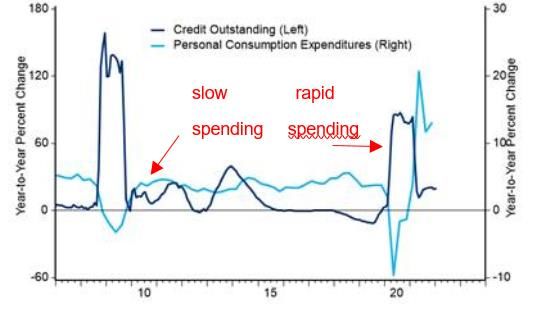
Figure 7: US real disposable personal income and real                    Figure 8: US real consumer goods spending and real
 income less transfer payments                                            imports

 Source: Haver analytics as of February 16, 2022. Note: Shaded region is recession.

MAINTAINING SPECIFICITY IN EQUITY ALLOCATIONS
Our readers will also note that we left intact specific equity over-weights in global healthcare, cybersecurity/fintech
and payments, non-US developed markets large caps and China. These GIC moves reflect our views on where
relative value can be found in equity markets and where we expect above-average returns to come from in this
transitional market environment.

 Figure 9: European Sovereign 10-Year Yields                              Figure 10: US Pharmaceutical Dividend Payments: Shares
                                                                          Yield 2.5% on average, Dividends have 6.5% YoY Historic
                                                                          Growth Rate
                8                                           UK
                7                                           France
                                                            Italy
                6                                           Spain
                                                            Germany
                5
                4
    Yield (%)

                3
                2
                1
                0
                1
                2
                    '06

                    '15
                    '16
                    '00
                    '01
                    '02
                    '03
                    '04
                    '05

                    '07
                    '08
                    '09
                    '10
                    '11
                    '12
                    '13
                    '14

                    '17
                    '18
                    '19
                    '20
                    '21
                    '22

 Source: Haver Analytics as of February 16, 2022. Note: Shaded areas are recessions. Indices are unmanaged. An investor cannot invest directly in
 an index. They are shown for illustrative purposes only and do not represent the performance of any specific investment. Past performance is no
 guarantee of future results. Real results may vary. S&P 500 Pharmaceutical used for proxy in Figure 10.

The immediate income stream from healthcare/pharmaceuticals yields more than the world bond market even
before accounting for long-term dividend growth (see figures 9-10). As another example we discussed in the last
Quadrant, the profit and revenue outlook for the cyber-security software sector appears to be the most secure of
all groups within the technology sector. We believe emerging financial technology is a secular growth trend that
has been deeply discounted in the early 2022 selloff.
In addition to our thematic positions in equities at 4% of portfolios (pharmaceuticals, cybersecurity, payments and
fintech), we are also about 4% overweight benchmarks in large capitalization dividend growth shares – counting
both US and non-US holdings. We believe these well-capitalized firms, with profit levels high enough to allow the
most consistent increases in dividend payments, have outperformed in the defensive market of recent months.
Seek to both reduce overall equity risk and leave a concentrated focus on what we see as the most valuable

4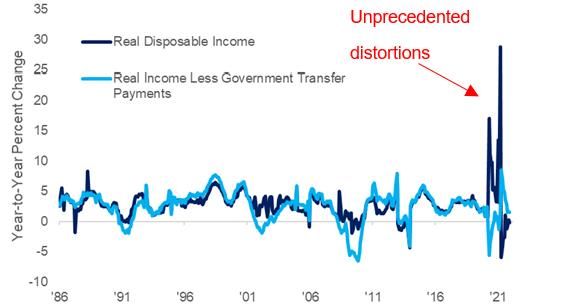
income-generating equities, we further reduced small and midcap shares in both non-US and US markets again in
the past week (see figure 11).
Finally, we believe the broader correction in US growth stocks could have further to run. Thus, we recommended
portfolio hedges in the CIO Bulletin two weeks ago.
As the boom ends, and the Fed possibly over-reacts, a peak in long-term yields may also define the trough for
higher quality US growth stocks. When rates peak, and we think that may be sooner than many expect, the
pressure on growth stocks is likely to abate. While timing is never clear with foresight, this could plausibly be after
the Fed’s first interest rate increase, particularly if it takes bold action with a 50-basis point increase (see figure 12).
The bottom line is that we do not believe that this is an environment for lasting high inflation.

 Figure 11: Non-US SMID Growth vs Non-Us Dividend Growers Figure 12: US 10yr Yield vs US growth equities & gold

    Source: Bloomberg as of February 16, 2022. Indices are unmanaged. An investor cannot invest directly in an index. They are shown for illustrative
    purposes only and do not represent the performance of any specific investment. Past performance is no guarantee of future results. Real results
    may vary. Russell 1000 Growth for US pure growth proxy in Figure 12. Red arrow points to the potential peaking of the 10Y yield.

5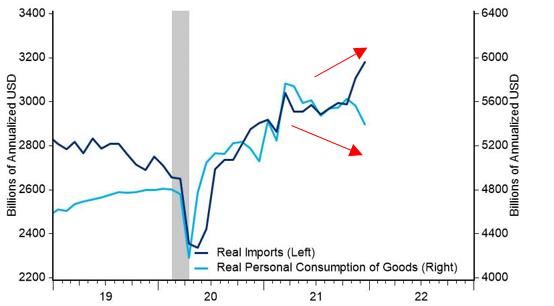
CIO BULLETIN SPECIAL REPORT:
HONG KONG’S FIFTH COVID WAVE
While most of the world is seeing the Omicron wave subside, Hong Kong is experiencing its worst outbreak since
the start of the pandemic. The daily increase in confirmed cases surged to over 6000 on Feb 17, up from about
100 just two weeks earlier during the Lunar New Year (the peak in July 2020 was just 173). The number of deaths
rose to 36 over the past 10 days. Hospitals are overwhelmed, with some operating at over 100% capacity. In the
weeks after the Lunar New Year, severe restrictions have been placed on dining, entertainment, sporting activities
and services. Gatherings are limited even in private homes. These have curtailed mobility in a way similar to the
initial pandemic response in 2020 (see figure 13).
The majority of reported deaths were elderly and unvaccinated individuals, some with prior conditions. Fewer than
half of the 70-plus age group have gotten two doses of vaccines (figure 14). Yet, it was the death of two children
that struck a nerve. Both children were brought to the hospital with severe symptoms, missing the most critical
time for treatment.

 Figure 13: As HK’s new cases hit record, mobility is being                   Figure 14: Less than half of those above 70 in HK have
 limited to a similar extent as in 2020                                       gotten two doses of vaccines, making them the most
                                                                              vulnerable
    (people)   HK - New Confirmed Cases and Google Mobility Index       (%)     (% of total            HK - Vaccination coverage by age groups
    3,000                                                               20     population)
                  Daily new cases         Google mobility index (RHS)          120
                                                                                              First dose           Second dose             Third dose
    2,500
                                                                        10     100
    2,000
                                                                                80
                                                                        0
    1,500                                                                       60
                                                                        -10
    1,000                                                                       40
                                                                        -20     20
     500

       0                                                                -30      0
       Feb-20 May-20 Aug-20 Nov-20 Feb-21 May-21 Aug-21 Nov-21                         12-19      20-29    30-39   40-49   50-59   60-69   70-79    >= 80

 Source: CEIC, WHO, Citi Research, as of Feb. 17, 2022                        Source: CEIC, WHO, Citi Research, as of Feb. 17, 2022

Facing this unprecedented crisis in Hong Kong, President Xi made a public announcement for Hong Kong to
strictly enforce “dynamic clearance” to bring the situations under control. The next day, media reported on a plan
for compulsory testing of all 7.5 million population in Hong Kong. Because of capacity limits in Hong Kong, China
plans to send medical staff from Shenzhen to help with testing. The compulsory testing is planned to begin in
early March and those who refuse may be fined HK$10,000 (about US $1,280).

REACTIONS TO MAINLAND INTERVENTIONS
There are two types of reactions to the news of Mainland intervention. Some media reports focus on the potential
loss of privacy, highlighting the fact that some people in Hong Kong don’t want to be tracked, tested or
vaccinated. This has impeded the progress toward reopening between Mainland and Hong Kong.
The other view is that delayed preparations for the overwhelming demand on the medical system that was
predictable from before the Lunar New Year. Hong Kong clearly needed more capacity for medical goods and
services, as well as supply chain security.
There is also intense criticism of the COVID-zero policy, challenging whether such extreme measures are necessary
when the mortality rate had fallen from 3% a year ago to about 0.5% (figure 15), but is still five times the rate of the
common flu. Looking at 2022 data, it is clear that China has avoided the outcomes experienced worldwide.

6
Figure 15: The surge in Omicron cases did not bring a Figure 16: Omicron related deaths started to rise at the start
similar surge in deaths, but the mortality rate of 0.5% is still of 2022. Since then, 425,848 have perished globally, while 63
five times the rate of the common flu passed away in China/HK under “dynamic clearance” policy
Daily new cases and deaths (7-day moving average)
16,000 World Daily Deaths World New Cases 4,000,000
COVID Deaths in 2022 YTD
14,000 3,500,000
12,000 3,000,000 World 424,848
10,000 2,500,000
EMEA 187,976
8,000 2,000,000
6,000 1,500,000 US 104,129
4,000 1,000,000
2,000 500,000 APAC 56,081
0 -
3.5%Jul-20 Deaths
Oct-20 % Cases
Jan-21 (7-day
Apr-21 moving
Jul-21 average)
Oct-21 Jan-22 Rest of World 76,662
3.0%
2.5%
2.0% China 25
1.5%
1.0% HK 38
0.5%
0.0%
Jul-20 Oct-20 Jan-21 Apr-21 Jul-21 Oct-21 Jan-22
Source: Bloomberg, as of Feb. 17, 2022 Source: Bloomberg, HK01, as of Jan. 17, 2022
REOPENING THE HK CHINA LINK
It is not lost to the Chinese authorities that as the virulence of the coronavirus falls, a zero-case policy is becoming
less sensible for the economy. On February 12, China approved Pfizer’s Covid-19 pill Paxlovid for emergency
use. Some see this as a turning point in the nation’s pandemic strategy. But vaccine nationalism is still prevalent,
with progress on China’s own mRNA vaccine still a focus for authorities.
The Chief Epidemiologist at the Chinese Centre for Disease Control and Prevention—Wu Zunyou—said that
multiple teams in China are studying how to improve the country’s zero-Covid approach as economic pressure
intensifies. Wu said researchers were “certainly able” to roll out new strategies soon, but China is unlikely to
simply lift all restrictions like in many Western countries. Any changes to China’s pandemic policies would
prioritize preserving lives.
In terms of reopening the HK China link, we suspect this would take place in two stages.
• Reopening between Mainland and Hong Kong possibly this summer: This is likely a much higher
priority for Beijing than with the rest of the world. Most preparations were already made before the
Omicron wave disrupted the initial trials scheduled to begin last December. One of the remaining
challenges is the incompatibility between tracking and management systems on the two sides. The
proposed compulsory testing in Hong Kong would resolve this issue. Thus, if the current wave of infections
subsides in the spring, a reopening between Mainland and Hong Kong could begin this summer.
• Potential full reopening late 2022 and in 2023: This would require a more formal shift away from
“dynamic clearance” policy, as noted earlier. Two key milestones would be the use of foreign and Chinese
vaccines to increase total vaccination rates and the absence of new Covid variants. A full reopening is
only possible if the risk of impact to the National Party Congress in October is exceedingly low.
7IMMEDIATE ECONOMIC IMPACTS FOR HK
The government is preparing a third round of fiscal stimulus for HK. Hong Kong’s government is wealthy, due to
its ownership of land and substantial reserves. The new round of stimulus would likely include medical
expenses, consumption vouchers and subsidies for industries hurt most by the pandemic like retail,
entertainment, F&B and hospitality.
The negative consequences of the Covid outbreak are likely to be concentrated in 1Q where Hong Kong’s GDP may
contract, but we expect this period to be less severe than 1Q 2020 when Hong Kong’s GDP shrunk by 5%q/q.
Figure 17: HK’s retail sale volume has not yet recovered from Figure 18: HK Inflation is manageable, so long as the import
pandemic or unrest supply chain remains intact
Retail Sales Volume Index Tourist Arrivals (Right) 12 Import Prices CPI 12
120 7.0 10 10
110 6.0 8 8
Index (March 2019 = 100)
100
5.0 6 6
Y/Y %
Y/Y %
90
Millions
4.0 4 4
80
3.0 2 2
70
60
2.0 0 0
50 1.0 -2 -2
40 0.0 -4 -4
05 07 09 11 13 15 17 19 21 08 10 12 14 16 18 20 22
Source: Haver Analytics, as of Dec 2021 Source: Haver Analytics, as of Dec 2021
MARKET REACTIONS
The local HK market did not take the compulsory testing poorly. The Hang Seng Index (HSI) actually rose on
February 16 when the news broke. Macau gaming names rallied on hopes of re-opening. Pharmaceuticals,
financials, and property developers were all up on the day. Hong Kong retail real estate names came off, as the
restrictions are directly hurting their businesses, but even those fully recovered the next day.
Investors appear to have greater appetite for relative value, for which Hong Kong remains an exemplary market.
HSI price-to-book ratio is at 1.0x, which is at the low end of historical record. Even though this P/B ratio has been
trending down for over a decade, as figure 15 shows, it can still stage 20-40% bounces (2012, 2016-17 and 2020
are examples). So, if our reopening expectations are realized, 2022 might be the next occasion.
Figure 19: 4Q GDP Growth was lowest on record when the 2020 pandemic collapse is excluded
HK Real GDP Growth Hang Seng Index
8 34000
6 32000
30000
4
Real GDP (Q/Q %)
28000
HSI Index
2
26000
0
24000
-2
22000
-4 20000
-6 18000
'16 '18 '20 '22
Source: Haver Analytics, Bloomberg, as of Feb. 17, 2022. Indices are unmanaged. An investor cannot invest directly in an index.
They are shown for illustrative purposes only. Past performance is no guarantee of future returns. Real results may vary.
8REMAINING POSITIVE ON CHINA The larger story is the change in policy for China after sharp tightening steps last year. While the Fed embarks on its tightening regime, China is going in the other direction. China has begun to ease its monetary policy after macro-economic and regulatory tightening in 2021 curbed economic growth and hammered stocks. That’s why we see Chinese equities as another key way to diversify portfolios (see last week’s Bulletin, Revisiting China While Yielding to Oncoming Traffic). China’s fiscal and monetary stimulus is beginning to flow through the economy and is bearing initial benefits. January’s money and credit data showed significant credit easing following a signal from policymakers of the need to support growth. China’s inflation picture is also more favorable than in the US. Weaker but improving domestic demand has not spawned the type of stimulus-induced buying. Chinese equities are far more correlated to their domestic credit conditions than to US monetary policy. From 2015-2018 the path of Chinese markets matched credit flows, deeply negative in 2015, positive in 2016-17, and negative again in 2018. As we enter 2022, we expect credit impulse to remain positive, following a trend taking shape since October. This is typically associated with future gains in corporate profits and higher equity valuations (see figure 20). Figure 20: Aggregate credit as % of GDP has begun to turn last October, and is likely to support equity valuations in 2022 Source: Bloomberg and Haver Analytics as of February 16, 2022. All forecasts are expressions of opinion and are subject to change without notice and are not intended to be a guarantee of future events. Indices are unmanaged. An investor cannot invest directly in an index. They are shown for illustrative purposes only. Past performance is no guarantee of future returns. Real results may vary. POSITIVE CHINESE FUND FLOWS Foreign investors have noted the improvement in Chinese credit, attracting funds flows. Since China’s Central Economic Work Conference in December, inflows to Chinese equity ETFs have risen by $30bn over the last eight weeks, the largest on record (figure 21). These inflows amounted to 6% of the ETFs’ AUM. These inflows contributed to the comparative resilience of Chinese equities in the year-to-date, even as US stocks corrected. 9
Figure 1: Inflows to Chinese equity ETFs have reached a record $30bn in the eight weeks since CEWC,
amounting to 8% of the ETFs’ total AUM

Source: EPFR, Bloomberg and Haver Analytics as of February 16, 2022. Indices are unmanaged. An investor cannot invest directly in an index.
They are shown for illustrative purposes only. Past performance is no guarantee of future returns. Real results may vary.

10
DISCLOSURES
This email contains promotional materials. If you do not wish to receive any further promotional emails from Citi Global Wealth Investments, please
email donotspam@citi.com with "UNSUBSCRIBE" in the subject line. Email is not a secure environment; therefore, do not use email to communicate
any information that is confidential such as your account number or social security number.
This Communication is prepared by Citi Global Wealth Investments (“CGWI”) which is comprised of the Investments and Capital Markets capabilities of Citi Private
Bank, Citi Personal Wealth Management and International Personal Bank U.S.
Citi Private Bank and Citi Personal Wealth Management are businesses of Citigroup Inc. (“Citigroup”), which provide clients access to a broad array of products
and services available through bank and non-bank affiliates of Citigroup. Not all products and services are provided by all affiliates or are available at all locations.
In the U.S., investment products and services are provided by Citigroup Global Markets Inc. (“CGMI”), member FINRA and SIPC, and Citi Private Advisory, LLC
(“Citi Advisory”), member FINRA and SIPC. CGMI accounts are carried by Pershing LLC, member FINRA, NYSE, SIPC. Citi Advisory acts as distributor of certain
alternative investment products to clients of Citi Private Bank. Insurance is offered by Citi Personal Wealth Management through Citigroup Life Agency LLC
(“CLA”). In California, CLA does business as Citigroup Life Insurance Agency, LLC (license number 0G56746). CGMI, Citi Advisory, CLA and Citibank, N.A. are
affiliated companies under the common control of Citigroup. Outside the U.S., investment products and services are provided by other Citigroup affiliates.
Investment Management services (including portfolio management) are available through CGMI, Citi Advisory, Citibank, N.A. and other affiliated advisory
businesses. These Citigroup affiliates, including Citi Advisory, will be compensated for the respective investment management, advisory, administrative, distribution
and placement services they may provide.
International Personal Bank U.S. (“IPB U.S.”), is a business of Citigroup which provides its clients access to a broad array of products and services available
through Citigroup, its bank and non-bank affiliates worldwide (collectively, “Citi”). Through IPB U.S. prospects and clients have access to the Citigold® Private
Client International, Citigold® International, International Personal, Citi Global Executive Preferred, and Citi Global Executive Account Packages. Investment
products and services are made available through either Citi Personal Investments International (“CPII”), a business of Citigroup which offers securities through
CGMI, member FINRA and SIPC, an investment advisor and broker–dealer registered with the Securities and Exchange Commission; or Citi International Financial
Services, LLC (“CIFS”), member FINRA and SIPC, and a broker–dealer registered with the Securities and Exchange Commission that offers investment products
and services to non–U.S. citizens, residents, or non–U.S. entities. CGMI and CIFS investment accounts are carried by Pershing LLC, member FINRA, NYSE, and
SIPC. Insurance is offered by CPII through CLA. In California, CLA does business as Citigroup Life Insurance Agency, LLC (license number 0G56746). Citibank
N.A., CGMI, CIFS, and CLA are affiliated companies under common control of Citigroup Inc.
Read additional Important Information
Past performance is not indicative of future results. Real results may vary.
Citi and its employees are not in the business of providing, and do not provide, tax or legal advice to any taxpayer outside Citi. Any statement in this
Communication regarding tax matters is not intended or written to be used, and cannot be used or relied upon, by any taxpayer for the purpose of
avoiding tax penalties. Any such taxpayer should seek advice based on the taxpayer’s particular circumstances from an independent tax advisor.
MBS are also sensitive to interest rate changes which can negatively impact the market value of the security. During times of heightened volatility, MBS can
experience greater levels of illiquidity and larger price movements.
Important information, including information relating to risk considerations can be found in the link above.
Views, opinions and estimates expressed herein may differ from the opinions expressed by other Citi businesses or affiliates, and are not intended to be a forecast
of future events, a guarantee of future results, or investment advice, and are subject to change without notice based on market and other conditions. Citi is under
no duty to update this presentation and accepts no liability for any loss (whether direct, indirect or consequential) that may arise from any use of the information
contained in or derived from this presentation.
© 2022 Citigroup Inc., All Rights Reserved. Citi, Citi and Arc Design and other marks used herein are service marks of Citigroup Inc. or its affiliates, used and
registered throughout the world.

     INVESTMENT PRODUCTS: NOT FDIC INSURED · NOT CDIC INSURED · NOT GOVERNMENT INSURED
                          · NO BANK GUARANTEE · MAY LOSE VALUE

11
You can also read