Changes in the language system as amyloid-b accumulates
←
→
Page content transcription
If your browser does not render page correctly, please read the page content below
doi:10.1093/brain/awab335                                                                                           BRAIN 2021: Page 1 of 13           | 1

Changes in the language system as
amyloid-b accumulates

                                                                                                                                                               Downloaded from https://academic.oup.com/brain/advance-article/doi/10.1093/brain/awab335/6371865 by guest on 10 December 2021
  Mariska Reinartz,1,† Silvy Gabel,1,† Jolien Schaeverbeke,1 Karen Meersmans,1
Katarzyna Adamczuk,2 Emma Susanne Luckett,1 Steffi De Meyer,1 Koen Van Laere,3,4
Stefan Sunaert,5 Patrick Dupont1 and Rik Vandenberghe1,6,7

†
    These authors contributed equally to this work.

Language dysfunction is common in Alzheimer’s disease. There is increasing interest in the preclinical or asymp-
tomatic phase of Alzheimer’s disease.
Here we examined in 35 cognitively intact older adults (age range 52–78 years at baseline, 17 male) in a longitudin-
al study design the association between accumulation of amyloid over a 5–6-year period, measured using PET, and
functional changes in the language network measured over the same time period using task-related functional
MRI. In the same participants, we also determined the association between the longitudinal functional MRI
changes and a cross-sectional measure of tau load as measured with 18F-AV1451 PET.
As predicted, the principal change occurred in posterior temporal cortex. In the cortex surrounding the right super-
ior temporal sulcus, the response amplitude during the associative-semantic versus visuo-perceptual task
increased over time as amyloid load accumulated (Pcorrected = 0.008). In a whole-brain voxel-wise analysis, amyloid
accumulation was also associated with a decrease in response amplitude in the left inferior frontal sulcus (Pcorrected
= 0.009) and the right dorsomedial prefrontal cortex (Pcorrected = 0.005). In cognitively intact older adults, cross-sec-
tional tau load was not associated with longitudinal changes in functional MRI response amplitude.
Our findings confirm the central role of the neocortex surrounding the posterior superior temporal sulcus as the
area of predilection within the language network in the earliest stages of Alzheimer’s disease. Amyloid accumula-
tion has an impact on cognitive brain circuitry in the asymptomatic phase of Alzheimer’s disease.

1     Laboratory for Cognitive Neurology, Department of Neurosciences, Leuven Brain Institute, KU Leuven, 3000 Leuven,
      Belgium
2     Bioclinica LAB, Newark, CA 94560, USA
3     Division of Nuclear Medicine, UZ Leuven, 3000 Leuven, Belgium
4     Nuclear Medicine and Molecular Imaging, Department of Imaging and Pathology, KU Leuven, 3000 Leuven, Belgium
5     Translational MRI, KU Leuven, 3000 Leuven, Belgium
6     Alzheimer Research Centre KU Leuven, Leuven Brain Institute, 3000 Leuven, Belgium
7     Neurology Department, University Hospitals Leuven, 3000 Leuven, Belgium

Correspondence to: Rik Vandenberghe
Neurology Department, University Hospitals Leuven
Herestraat 49, 3000 Leuven, Belgium
E-mail: rik.vandenberghe@uz.kuleuven.ac.be

Received April 23, 2021. Revised July 08, 2021. Accepted August 12, 2021. Advance access publication September 17, 2021
C The Author(s) (2021). Published by Oxford University Press on behalf of the Guarantors of Brain.
V
This is an Open Access article distributed under the terms of the Creative Commons Attribution-NonCommercial License (https://creativecommons.org/licenses/
by-nc/4.0/), which permits non-commercial re-use, distribution, and reproduction in any medium, provided the original work is properly cited. For commercial
re-use, please contact journals.permissions@oup.com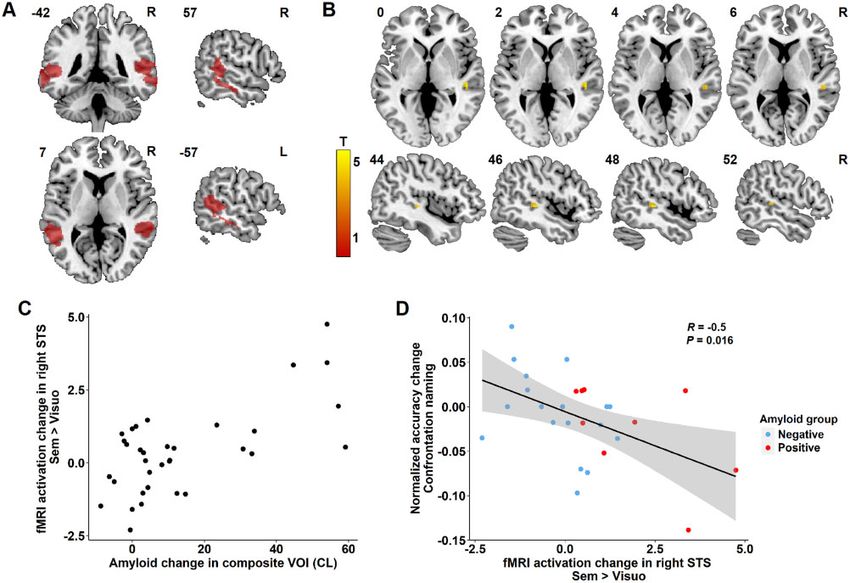
2   | BRAIN 2021: Page 2 of 13                                                                                           M. Reinartz et al.

Keywords: longitudinal study; fMRI; amyloid PET; 18F-AV1451; Alzheimer’s disease
Abbreviations: BOLD = blood oxygen-level dependent; IFS = inferior frontal sulcus; MMSE = Mini-Mental State
Examination; MTG = middle temporal gyrus; STS = superior temporal sulcus; SUVR = standardized uptake value
ratio; VOI = volume of interest

Introduction                                                             posterior temporal cortex may show a compensatory increase in
                                                                         activity in order to maintain adequate performance. Longitudinal

                                                                                                                                                 Downloaded from https://academic.oup.com/brain/advance-article/doi/10.1093/brain/awab335/6371865 by guest on 10 December 2021
Language dysfunction is common in the early stage of typical             studies, however, are needed to test this hypothesis further.
Alzheimer’s disease.1–3 There is an increasing interest in the asymp-        Here we tested longitudinally over a 5–6-year interval how ac-
tomatic phase of Alzheimer’s disease, where Alzheimer’s disease-         tivity in the language network changes in cognitively intact older
related brain pathology is present but symptoms are not yet clinically   adults in relation to changes in amyloid load. Based on the cited
apparent.4,5 A critical intermediary level between molecular aggre-      evidence, we hypothesized that an increase in amyloid-b would be
gates and clinical manifestations consists of the way in which cogni-
                                                                         associated with changes in activity in left or right posterior STS/
tive brain systems are able to adapt to amyloid-b-related pathology.
                                                                         MTG. Since it is commonly accepted that functional brain changes
This intermediary level is only accessible by means of in vivo techni-
                                                                         may relate more to deposition of tau aggregates than to amyloid-
ques of measuring brain function, such as functional MRI. Functional
                                                                         b,19,20 we also examined the relationship with tau aggregates
changes in cognitive brain circuits during the asymptomatic phase of
                                                                         measured cross-sectionally using 18F-AV1451.
Alzheimer disease are still poorly understood.
    Previous studies of changes in cognitive brain circuits in
asymptomatic Alzheimer’s disease have mainly focused on the              Materials and methods
episodic memory system.6–9 These studies have led to a biphasic
model of hippocampal activity in Alzheimer’s disease where a             Study participants
compensatory increase in the preclinical and mild cognitive im-          Thirty-five cognitively intact healthy older adults participated in
pairment stage is followed by hypo-activation in the Alzheimer’s         the current study. All belonged to the Flemish-Prevent AD Cohort
disease dementia stage.10 Alternatively, the excess hippocampal          KU Leuven (F-PACK), a larger longitudinal community-recruited
activity in amnestic mild cognitive impairment may also be harm-
                                                                         study cohort of 180 cognitively intact older individuals.21 The F-
ful as drug-induced reduction of hippocampal hyperactivity has
                                                                         PACK cohort was recruited in three waves of 60 participants each.
led to improved episodic memory performance.11,12
                                                                         The first wave was recruited between 2009 and 2012 and received
    Even if the amnestic phenotype is the most defining character-       18
                                                                            F-flutemetamol PET as well as task-related functional MRI of the
istic of Alzheimer’s disease, language changes are highly prevalent
                                                                         language system at baseline. All participants of the first wave of
in typical Alzheimer’s disease, even in an early stage.1–3,13
                                                                         the F-PACK study cohort were invited to participate in the current
Studying the functional neuroanatomy of language and semantic
                                                                         amyloid and tau PET plus task-related functional MRI study be-
processing requires a task paradigm suitable for functional MRI
                                                                         tween 2015 and 2019. Twenty-four participants of the first wave
that reliably activates the widely distributed language and associa-
                                                                         declined participation in the current study. There was no signifi-
tive-semantic network with low between-subject and high within-
subject consistency. Such task-related functional MRI studies have       cant difference in baseline characteristics between subjects who
highlighted the vulnerability of the posterior third of the superior     consented to participate in the current study and those who
temporal sulcus (STS) and of the middle temporal gyrus (MTG) in          refused (Table 1), according to unpaired two-tailed t-tests and
the asymptomatic,4,14 mild cognitive impairment15,16 and early de-       Mann-Whitney U-tests depending on normality. Of the 35 partici-
mentia stages of Alzheimer’s disease.17 In the early dementia            pants, one had to be excluded subsequently based on excessive
phase of amyloid biomarker-positive Alzheimer’s disease, the left        head movement during the functional MRI scan (see ‘Image ana-
posterior STS and the posterior MTG are decreased in activity dur-       lysis’ section). For a detailed description of the full F-PACK inclu-
ing associative-semantic versus visuo-perceptual processing. By          sion criteria, refer to the Supplementary material and also
contrast, the homologous right-sided region showed an increase           previous reports.21
in activity and this correlated positively with offline Boston                The local Ethics Committee for Clinical Studies UZ/KU Leuven
Naming Test scores, suggestive of a compensatory mechanism.17            approved the study. Written informed consent was obtained from
Seed-based resting-state functional connectivity between the left        all participants in accordance with the Declaration of Helsinki.
posterior MTG and the homologous contralateral node is also
decreased in Alzheimer’s disease dementia.18 In cognitively nor-         Standard neuropsychological assessment
mal older adults, the only region where activity during associative-
semantic versus visuo-perceptual processing correlates with amyl-        All participants underwent baseline and follow-up testing for gen-
oid load in a whole-brain analysis is the posterior third of the left    eral cognition [Clinical Dementia Rating (CDR) and Mini Mental
STS14: response amplitude in the left STS was higher with higher         State Examination (MMSE)], episodic memory [Auditory Verbal
amyloid load. Higher amyloid load also correlated with longer re-        Learning Test (AVLT) and Buschke Selective Reminding Test
action times during an offline confrontation naming task.14 This         (BSRT)], language, fluid intelligence/reasoning and executive func-
series of task-related and resting-state functional MRI studies in       tioning. Language and semantic processing were assessed using
different phases of Alzheimer’s disease demonstrates the vulner-         the Boston Naming Test.22 Fluency was assessed using a 1-min
ability of the posterior STS and MTG as nodes of the language net-       Animal Verbal Fluency task and a Letter Verbal Fluency task. The
work to amyloid-b-related pathology.14,15,17,18 The findings could       Dutch version of the Psycholinguistic Assessment of Language
be compatible with a biphasic model where the left posterior tem-        Processing in Aphasia (PALPA) subtest 49 was used to probe verbal
poral cortex first shows increased activity with a higher amyloid        associative-semantic processing.23 Executive functioning was
load and subsequently fails to activate. In this model, the right        measured with Trail Making Test (TMT) A and B. Fluid intelligence/
Longitudinal fMRI and amyloid PET in AD                                                                                      BRAIN 2021: Page 3 of 13                | 3

Table 1 Sample characteristics at baseline of the participants of the current study and the refusers

                                                               Participants                              Refusers                                       Statistics

 Centiloid value                                                8.9 [–8.3 to 44.7]                        6.8 [–14.1 to 69.5]                      U = 567, P = 0.08
 MMSE (/30)                                                    29.1 [27.0 to 30.0]                       28.8 [27.0 to 30.0]                       U = 528.5, P = 0.21
 AVLT total learning (/75)                                     51.6 [33.0 to 65.0]                       47.0 [27.0 to 67.0]                       T = 1.95, P = 0.06
 AVLT % delayed recall                                         89.7 [57.1 to 116.7]                      87.5 [42.9 to 150.0]                      U = 494, P = 0.51
 Buschke mean total retention (/12)                             8.9 [7.1 to 10.3]                         8.8 [4.8 to 10.5]                        U = 344.5, P = 0.12
 Buschke delayed recall (/12)                                   9.6 [5.0 to 12.0]                         9.1 [3.0 to 12.0]                        U = 517, P = 0.32
 BNT (/60)                                                     54.0 [41.0 to 60.0]                       51.8 [38.0 to 60.0]                       U = 546.5, P = 0.15

                                                                                                                                                                            Downloaded from https://academic.oup.com/brain/advance-article/doi/10.1093/brain/awab335/6371865 by guest on 10 December 2021
 AVF (# words)                                                 21.3 [14.0 to 32.0]                       19.4 [9.0 to 34.0]                        T = 1.49, P = 0.14
 LVF (# words)                                                 34.3 [14.0 to 59.0]                       32.6 [16.0 to 51.0]                       T = 0.65, P = 0.52
 PALPA49 (/30)                                                 26.6 [23.0 to 29.0]                       27.1 [21.0 to 30.0]                       U = 369, P = 0.23
 RPM (/60)                                                     43.8 [17.0 to 55.0]                       36.9 [5.0 to 58.0]                        U = 571, P = 0.07
 TMT B/A                                                        2.5 [1.2 to 5.3]                          2.7 [0.9 to 5.5]                         U = 398, P = 0.45

Values are presented as mean [range]. Statistics represent t-test and Mann-Whitney U-test depending on normality of the data. AVF = Animal Verbal Fluency; AVLT =
Auditory Verbal Learning Test; BNT = Boston Naming Test; LVF = Letter Verbal Fluency; PALPA49 = Psycholinguistic Assessment of Language Processing in Aphasia subtest 49;
RPM = Standard Raven’s Progressive Matrices; TMT B/A = Trail Making Test ratio B/A.

reasoning was assessed using the 60 items of the Standard                              coil), which was in use prior to the installation of the 3 T Philips
Raven’s Progressive Matrices (RPM).                                                    Achieva. At time point 2 all subjects were scanned on the 3 T
    Table 2 shows demographic characteristics and average ± stand-                     Philips Achieva system equipped with a 32-channel receive-only
ard deviation (SD) cognitive test scores for the total sample of cogni-                head coil (Philips SENSitivity Encoding head coil). There were no
tively intact older adults (n = 35). The same tests were administered                  statistically significant differences of sex (P = 0.79) (chi-square
every 2 years for a total follow-up period of 10 years. The average fol-               test), age (P = 0.49), MMSE (P = 0.92), baseline amyloid (P = 0.59) or
low-up interval for this study was 75.6 (SD 17.7) months.                              amyloid accumulation (P = 0.29) (Kolmogorov-Smirnov comparison
                                                                                       of two datasets) between subjects scanned on the Intera versus
                                                                                       the Achieva system. Scanner type was included as a covariate of
Experimental language tests
                                                                                       no interest for all analyses.
Given our a priori hypothesis of early involvement of left posterior                       Sequence parameters were the same for both scanners: a high-
STS and given its possible role in lexical-semantic retrieval,15 the                   resolution T1-weighted structural scan was obtained using a 3D
experimental language tests conducted outside the functional MRI                       turbo field echo sequence (coronal inversion recovery prepared 3D
scanner consisted of a computerized version of confrontation                           gradient-echo images, inversion time 900 ms, repetition time =
naming and of lexical decision.14 The details of these tests have                      9.6 ms, echo time = 4.6 ms, flip angle 8 , field of view = 250
been described before14 and are also provided in the                                   250 mm, 182 slices; voxel size 0.98  0.98  1.2 mm3). Functional
Supplementary material. In summary, for confrontation naming, a                        MRIs were acquired using T2* echo-planar images (50 transverse
computerized version of the picture naming task from Laiacona                          slices, voxel size 2.5  2.5  2.5 mm3; repetition time = 3000 ms,
and Capitani24 was used.25 Voice recordings were manually ana-                         echo time = 30 ms, flip angle 90 , field of view 200  200 mm).
lysed in the Audacity Cross-Platform Sound Editor version 2.4.2
(https://www.audacityteam.org/; accessed 30 September 2021).                           Functional MRI
Reaction times were measured for the correct responses from the
                                                                                       Stimuli and tasks
onset of the stimulus to the onset of the naming response.
Accuracy was measured as percentage correct responses.                                 Stimuli were projected onto a high-resolution screen (1024  768
    For lexical decision, a computerized version of the visual lexical                 pixels,     refresh   rate     60 Hz)    using    Presentation    14.8
decision test from the Dutch version of the PALPA (item 24)23 was                      (NeuroBehavioural Systems, Albany, CA, USA). The functional MRI
administered, as described before.14 Reaction times were meas-                         paradigm has been described in detail before.15,17,28–32 In sum-
ured for correct responses from the onset of the stimulus to the                       mary, the experimental design was factorial.28 The first factor
time of the button press. A’ was used as our non-parametric accur-                     ‘task’ had two levels: associative-semantic (Fig. 1, blue and purple)
acy measure, as the data were not normally distributed, as                             versus visuo-perceptual judgement (Fig. 1, cyan and yellow). The
assessed with the Shapiro-Wilk test.26,27 In addition, we deter-                       second factor ‘input modality’ also had two levels: printed words
mined the index of response bias (Table 2).27                                          (Fig. 1, blue and cyan) versus pictures (Fig. 1, purple and yellow).
                                                                                       The associative-semantic condition was derived from the
                                                                                       Pyramids and Palm Trees Test,33 a classical neuropsychological
Image acquisition
                                                                                       test of associative-semantic processing for words and pictures.
Functional and structural MRI data were acquired at two time                           During a trial, a triplet of stimuli was presented for 5250 ms, one
points, one at baseline (2009–12, hereafter referred to as time point                  stimulus on top (the sample stimulus) and one in each lower quad-
1) and one at follow-up (2015–19, hereafter referred to as time                        rant (the test stimuli), at 4.6 eccentricity (mean picture size was
point 2) with a mean interval of 69 months (SD: 13.2, range: 52–                       3.7 and mean letter size 1.2 ), followed by a 1500 ms interstimulus
106 months). The same scanning sequence was used for the two                           interval. Subjects were asked to press a left- or right-hand key de-
time points.                                                                           pending on which of the two test stimuli matched the sample
   At time point 1, 21 subjects were scanned on a 3 T Philips                          stimulus more closely in meaning. A given triplet was presented in
Achieva system equipped with a 32-channel receive-only head coil                       either the picture or the word format and this was counterbal-
(Philips SENSitivity Encoding head coil). Fifteen other subjects                       anced across subjects. In the visuo-perceptual control condition, a
were scanned on a 3 T Philips Intera system equipped with an 8-                        picture or word stimulus was presented in three different sizes
channel receive-only head coil (Philips SENSitivity Encoding head                      (mean picture size was 3.7 and mean letter size 1.2 ). Subjects had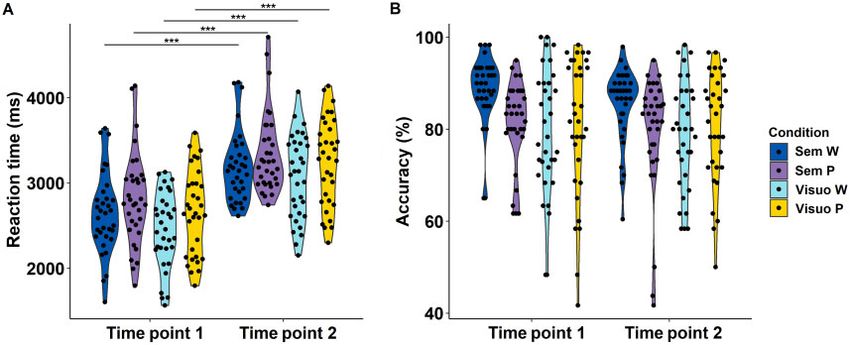
4      | BRAIN 2021: Page 4 of 13                                                                                                                        M. Reinartz et al.

Table 2 Demographic characteristics and cognitive test scores at baseline and follow-up

     Sex, male/female (% male)                                                                                        17/18 (48.6%)
     Education, years,                                                                                            12.7 (2.7) [6.0 to 19.0]
     APOE e4 carriers, n (%)                                                                                            19 (54.3%)
     BDNF met carriers, n (%)                                                                                            14 (40%)

                                                                                        Baseline                                                       Follow-up

     Age, years                                                              65.4 (6.1) [52.0 to 78.0]                                         71.6 (5.7) [59.0 to 83.0]
     Centiloids                                                               8.4 (11.2) [–8.3 to 44.7]                                        21.6 (27.3) [–6.6 to 89.5]

                                                                                                                                                                                 Downloaded from https://academic.oup.com/brain/advance-article/doi/10.1093/brain/awab335/6371865 by guest on 10 December 2021
     CDR 0.5, n                                                                             0                                                                 2
     MMSE (/30)                                                              29.1 (0.8) [27.0 to 30.0]                                         29.3 (0.9) [26.0 to 30.0]
     AVLT total learning (/75)                                               51.5 (9.0) [30.0 to 65.0]                                         51.6 (10.8) [27.0 to 73.0]
     AVLT delayed recall, %                                                  89.7 (12) [57.1 to 116.7]                                         86.9 (14.4) [50.0 to 107.1]
     Buschke mean score (/12)                                                 8.8 (0.9) [7.1 to 10.5]                                           8.0 (1.9) [2.4 to 11.5]
     Buschke delayed recall (/12)                                             9.5 (1.9) [5.0 to 12.0]                                           7.9 (3.2) [0.0 to 12.0]
     BNT (/60)                                                               53.8 (3.9) [41.0 to 60.0]                                         55.9 (2.8) [49.0 to 60.0]
     LVF (# words)                                                           35.1 (9.5) [14.0 to 59.0]                                         30.2 (11.3) [11.0 to 49.0]
     AVF (# words)                                                           21.1 (4.8) [14.0 to 32.0]                                         23.3 (8.7) [14.0 to 50.0]
     PALPA49 (/30)                                                           26.6 (1.6) [23.0 to 29.0]                                         27.3 (1.5) [23.0 to 30.0]
     RPM (/60)                                                               43.6 (7.5) [17.0 to 55.0]                                         40.6 (7.5) [23.0 to 54.0]
     TMT B/A                                                                  2.5 (0.9) [1.2 to 5.3]                                            2.8 (1.1) [1.5 to 5.5]
     Confrontation naming RT, msa                                          1946.4 (249.4) [1506.8 to 2578.3]                                 1758.6 (266.2) [1415.6 to 2449.7]
     Confrontation naming accuracy, %a                                       92.2 (4.1) [81.7 to 98.3]                                         91.3 (5.1) [78.3 to 98.3]
     Lexical decision RT, ms                                               1088.0 (224.3) [790.6 to 1855.4]                                  1067.4 (205.4) [768.0 to 1630.1]
     Lexical decision accuracy (A’)                                          0.98 (0.02) [0.91 to 1.00]                                        0.98 (0.01) [0.92 to 1.00]
     Lexical decision index of bias (B”D)                                    0.23 (0.44) [–0.77 to 0.89]                                       0.05 (0.44) [–0.88 to 0.88]

Values are presented as mean (SD) [range]. AVF = Animal Verbal Fluency; AVLT = Auditory Verbal Learning Test; BNT = Boston Naming Test; CDR = Clinical Dementia Rating;
LVF = Letter Verbal Fluency; PALPA49 = Psycholinguistic Assessment of Language Processing in Aphasia subtest 49; RPM = Standard Raven’s Progressive Matrices; RT = reac-
tion time; TMT B/A = Trail Making Test ratio B/A.
a
    Confrontation naming reaction times and accuracies are based on n = 28 participants, due to missing data of seven participants.

Figure 1 Experimental paradigm. The horizontal arrow at the top of the figure shows a timeline of one functional MRI run, with each condition (i.e. as-
sociative-semantic words/pictures and visuo-perceptual words/pictures as well as a rest condition) indicated in its respective colour. The order of
conditions was randomized for each run and subject. Translation from Dutch to English: deur = door, hek = fence, raam = window.

to press a left- or right-hand key depending on which of the two                             This size difference was then used for the visuo-perceptual condi-
test stimuli matched the sample stimulus more closely in size on                             tion during functional MRI.
the screen. An epoch, i.e. a block of trials belonging to the same
condition, consisted of four trials (total duration 27 s). The fifth
                                                                                             Image analysis
condition consisted of a resting baseline condition during which a
fixation point was presented in the centre of the screen (Fig. 1,                            All analyses were performed using Statistical Parametric Mapping
red). During each functional MRI run (five runs in total), a series of                       12 [SPM12 software (Wellcome Trust Centre for Neuroimaging,
the five epoch types was replicated three times (Fig. 1, timeline).                          London, UK, http://www.fil.ion.ucl.ac.uk/spm; accessed 30
The order of conditions was pseudorandom and differed across                                 September 2021)] running on MATLAB 2014b (MathWorks, Natick,
runs of the same subject.                                                                    MA, USA). The procedure for longitudinal functional MRI analysis
    Subjects received a practice session before entering the scan-                           was inspired by the longitudinal voxel-based brain morphometry
ner. In this session, we determined which size difference (9%, 6%,                           pipeline described by Chételat et al.34 and is described in detail in
3% or 1%) for the visuo-perceptual conditions was needed for each                            the Supplementary material and Supplementary Fig. 1. In sum-
individual subject to obtain comparable accuracies as for the asso-                          mary, functional MRI scans of each subject were realigned for time
ciative-semantic conditions so as to match overall task difficulty.                          point 1 and for time point 2 separately, and co-registered with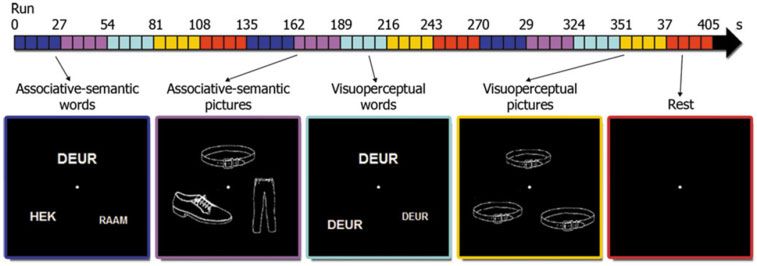
Longitudinal fMRI and amyloid PET in AD                                                                 BRAIN 2021: Page 5 of 13         | 5

their respective corresponding structural MRI. The structural MRI                      CLflutemetamol ¼ 127:6  SUVR90110  149           (1)
scans from the two time points were co-registered and normalized
                                                                                        CLPIB ¼ 132:53  SUVR4060  147:64                (2)
and the same normalization matrix was applied to the functional
MRI scans. Normalized functional MRI images were smoothed
                                                                             These formulae were then applied to the 18F-flutemetamol
using a 8  8  8 mm3 Gaussian kernel. One subject was excluded          SUVR and 11C-PIB SUVR data from the 35 participants in the cur-
due to excessive head movement (rotation 43 and translation             rent study, respectively.
43 mm).                                                                     To determine amyloid-positivity in this cohort, we classified
                                                                         cases in a binary way based on a pathologically validated Centiloid
Flutemetamol PET                                                         cut-off of 23.5.43 We also applied a separate classification based on
                                                                         three levels: low (CL 5 10), intermediate (CL 4 10) and high

                                                                                                                                                 Downloaded from https://academic.oup.com/brain/advance-article/doi/10.1093/brain/awab335/6371865 by guest on 10 December 2021
Image acquisition
                                                                         (CL 4 50) amyloid load.44 This is purely for descriptive reasons
18
  F-flutemetamol was obtained from Nucleis, and was produced             since the primary and secondary analyses all make use of amyloid
under GMP conditions. As described before,35–38 images were              load as a continuous variable.
acquired on a 16-slice Siemens Biograph PET/CT scanner
(Siemens). The 18F-flutemetamol PET tracer was injected intraven-
                                                                         Tau PET imaging
ously as a bolus (mean activity: 151.2 MBq, SD: 8.3, range: 137.9–
192.5 MBq) in an antecubital vein. Image acquisition began 90 min        Participants received a dynamic 18F-AV1451 PET scan on a 16-slice
after tracer injection and lasted for 30 min. Prior to the PET scan, a   Biograph PET/CT scanner (Siemens). The procedures for tau PET
low-dose CT scan of the head (11 mA) was performed for attenu-           acquisition and analysis were standard and are described in detail
ation correction. Random and scatter corrections were also               in the Supplementary material. In summary, we calculated distrib-
applied. Images were reconstructed using ordered subsets expect-         uted volume ratio (DVR) images and derived tau PET load in an
ation maximization (OSEM; four iterations  16 subsets).                 early metaVOI. The DVR in this early metaVOI was used for further
                                                                         analysis. We also used the tau PET to determine which cases were
Image analysis                                                           positive for tau in the early metaVOI with the cut-off set at SUVR
                                                                         5 1.38. To determine tau-positivity, we made use of SUVRs since
The details of the procedure for 18F-flutemetamol PET analysis           our independent reference group on which the positivity threshold
have been described before14,21,39 and are also described in the         was based only had static acquisition (Supplementary material).
Supplementary material. Using a standard procedure, an 18F-flute-
metamol standardized uptake value ratio (SUVR) in a composite
                                                                         Statistical analyses
cortical volume of interest (VOI) was derived from the 18F-fluteme-
tamol scans. No partial volume correction was applied as this may        Voxel-wise statistical analyses were conducted in SPM12 soft-
introduce additional noise in amyloid PET data in cognitively in-        ware running on MATLAB 2014b. All standard statistical analyses
tact older adults.40                                                     were conducted with R statistical software version 4.0.3 (The R
                                                                         Foundation for Statistical Computing; https://cran.r-project.org;
                                                                         accessed 30 September 2021). P-values were considered signifi-
PIB imaging
                                                                         cant when meeting a two-tailed a threshold of 0.05. Correction
The follow-up amyloid scan was performed by means of 11C-                for multiple comparisons was performed using Bonferroni cor-
Pittsburgh Compound B (PIB) due to unavailability of the 18F-flute-      rection. Outliers were assessed using the Grubb’s test (https://
metamol tracer in Belgium for research at the time of follow-up.         www.graphpad.com/quickcalcs/grubbs2/; accessed 30 September
11
  C-PIB was produced locally under GMP license. 11C-PIB PET was          2021). In case of missing data, only the available data were used
acquired dynamically over a period of 60 min on a 16-slice               in the analyses.
Biograph PET/CT scanner (Siemens). For the details of acquisition            Prior to statistical analyses, the Shapiro-Wilk test was used to
and analysis, refer to the Supplementary material. Using a stand-        check for normality of the data. In case the distribution of a vari-
ard procedure, global and regional 11C-PIB SUVRs were calculated         able differed significantly from normality (a 5 0.05), non-paramet-
between 40 and 60 min post-injection using SPM12. The mean 11C-          ric statistics were used for this variable.
PIB SUVR measure was calculated in the same composite cortical               The neuropsychological test scores were entered into a latent
VOI as for the 18F-flutemetamol images. No partial volume correc-        growth curve analysis using the R package lavaan45 (http://www.
tion was applied.40                                                      jstatsoft.org/v48/i02/; accessed 30 September 2021) to determine
                                                                         whether performance on offline standard cognitive tasks changed
                                                                         over time at the group level.21 To evaluate whether amyloid accu-
Measure of longitudinal change in amyloid load
                                                                         mulation was associated with neuropsychological changes, a lin-
For the primary outcome analysis, we used a continuous measure           ear regression analysis was also carried out with amyloid
of longitudinal change in amyloid load in the composite cortical         accumulation as regressor and the slope of a selection of the main
VOI. To analyse amyloid load using two different tracers, corre-         conventional neuropsychological test scores (BSRT total reten-
sponding SUVR values were first transformed to the Centiloid (CL)        tion,21 Animal Verbal Fluency, Boston Naming Test, Letter Verbal
scale, which was used for both the first and the second scan. The        Fluency, Standard Raven’s Progressive Matrices and Trail Making
difference in Centiloid values between the two time points was           Test B/A ratio) as outcome variable.
used as outcome measure. To this end, the in-house processing                The Kolmogorov-Smirnov test for comparison of two datasets
procedures to obtain 18F-flutemetamol and 11C-PIB SUVRcomp val-          was used to compare change in functional MRI response between
ues were first calibrated against the standard Centiloid method,41       subjects scanned on the Intera versus the Achieva system at
using an independent dataset as described before for 18F-fluteme-        baseline.
tamol39 and an independent in-house dataset of cognitively                   Reaction times and accuracies of the behavioural task during
intact older controls for 11C-PIB.42 This yielded the following con-     functional MRI were calculated per condition [associative-seman-
version formulae for 18F-flutemetamol39 (Equation 1) and 11C-PIB         tic task with words (Sem W) and with pictures (Sem P), and visuo-
(Equation 2).                                                            perceptual task with words (Visuo W) and with pictures (Visuo P);
6 | BRAIN 2021: Page 6 of 13 M. Reinartz et al.
Table 3 Performance during functional MRI experiments at baseline and follow-up
Baseline Follow-up Statistics
RT, ms Accuracy, % correct RT, ms Accuracy, % correct RT Accuracy
Sem W 2644 (476) 88.7 (7.6) 3190 (416) 85.4 (8.2) T = –7.34 T = 1.93
P 5 0.0001 P = 0.06
Sem P 2817 (543) 81.2 (9.3) 3344 (473) 79.7 (12.8) T = –6.59 T = 0.595
P 5 0.0001 P = 0.56
Visuo W 2448 (438) 79.5 (13.9) 3073 (487) 78.8 (11.9) T = –7.12 T = 0.21
Downloaded from https://academic.oup.com/brain/advance-article/doi/10.1093/brain/awab335/6371865 by guest on 10 December 2021
P 5 0.0001 P = 0.84
Visuo P 2656 (495) 80.7 (15.2) 3247 (509) 80.5 (12.1) T = –5.88 T = 0.045
P 5 0.0001 P = 0.94
Values are presented as mean (SD). Statistics represent Bonferroni-corrected P-values for pairwise t-test as post hoc analysis after repeated measures ANOVA. Note that the
results are based on n = 33 participants, due to missing data of two participants. Statistically significant results are highlighted in bold. RT = reaction time; Sem P/W = associa-
tive-semantic task with pictures/words; Visuo P/W = visuo-perceptual task with pictures/words.
Table 3]. A two-way repeated measures ANOVA was performed, When we observed significant effects, we also examined how
using the R package afex (https://github.com/singmann/afex; the change in amyloid and the change in functional MRI BOLD re-
accessed 30 September 2021),46 to evaluate the effect of the differ- sponse related to changes in the offline behavioural measures
ent conditions over time on reaction times and accuracy. The ef- using Pearson or Spearman correlations, depending on normality.
fect of time on both reaction time and accuracy was analysed for The normalized change in reaction time and accuracy between
every condition using pairwise comparisons post hoc. P-values time point 2 (t2) versus time point 1 (t1) were calculated for every
were adjusted using the Bonferroni multiple testing correction subject. Normalized values were calculated as: (t2 – t1) / [(t1 + t2) / 2].
method. When a significant effect was obtained for the analyses of the
contrast between the associative-semantic and the visuo-percep-
tual condition, we examined whether this was present both for the
Primary outcome analysis
word and the picture condition. We also examined interactions be-
Based on prior experiments,14–17 we predicted that left and right tween task and modality.
posterior STS and MTG would show decreases or increases in rela-
tion to the degree of amyloid accumulation. All analyses were
Secondary outcome analyses
voxel-wise analyses. Two primary voxel-wise outcome analyses
were performed, one within a VOI, the other across the whole As a secondary analysis, we examined the relationship between
brain. The VOI was derived from three prior studies using the the tau load as measured cross-sectionally with 18F-AV1451 PET
same paradigm at different Alzheimer’s disease stages.14,15,17 The at the second time point, and the change in BOLD response be-
tween the associative-semantic and the visuo-perceptual task
VOI consisted of the sum of the Brainnetome atlas areas47 that
between the two time points, both in a region-based and a whole-
encompassed the activity foci that showed significant between-
brain voxel-wise analysis. Tau load was measured based on the
group differences during the associative-semantic versus the
early metaVOI.
visuo-perceptual condition in the Alzheimer’s disease group ver-
We also determined whether the study outcome was affected
sus the controls in these studies.14,15,17 These Brainnetome atlas
by grey matter volume loss over time. As an atrophy measure, we
areas (labels 81, 82, 121–124) corresponded to the neocortex sur-
calculated the percental grey matter volume change between the
rounding the posterior third of the STS bilaterally. These were
two time points in MATLAB as 100 (GM1 – GM2) / GM1 in which
combined into one single bilateral VOI, which was used for small
GM1 and GM2 are the grey matter volumes at time points 1 and 2,
volume correction (Fig. 4A).
respectively. These grey matter volumes were derived from the
The main analysis consisted of a linear regression analysis
grey matter maps in Montreal Neurological Institute (MNI) space
where longitudinal change in amyloid load was the predictor vari-
as the summed value within the posterior temporal VOI or within
able and longitudinal change in functional MRI response during
the whole brain, respectively. For the VOI-based analysis of task-
the associative-semantic minus the visuo-perceptual condition in related functional MRI, the grey matter change in the bilateral pos-
the VOI was the outcome variable. The longitudinal change in terior temporal VOI was calculated and included as covariate in
functional MRI response was calculated as the interaction between the VOI-based voxel-wise regression analysis between amyloid
task (associative-semantic versus visuo-perceptual) and time change and change in functional MRI activity levels. For the
(baseline versus follow-up). The significance threshold for the VOI- whole-brain voxel-wise analysis, the percentual grey matter vol-
based voxel-wise analyses was set at voxel-level family-wise error ume change was calculated for the whole brain and was used as
(FWE)-corrected P 5 0.05. covariate in the whole-brain voxel-wise analyses between amyloid
As a second primary analysis, the same analysis was per- change and change in functional MRI activity levels. As a further
formed using a whole-brain voxel-wise approach, with change in analysis, we examined whether grey matter volume change was
the amyloid load in the composite VOI as predictor, and as out- associated with changes in functional MRI activity level in the pos-
come variable the change in the blood oxygen level-dependent terior temporal VOI or at the whole-brain level. To this end, a
(BOLD) response during the associative-semantic versus the visuo- voxel-wise linear regression analysis was carried out between the
perceptual task over time. This whole-brain voxel-wise analysis grey matter volume change in the posterior temporal volume and
was thresholded at a significance threshold of whole-brain FWE- the functional MRI activity change in this VOI (statistical threshold
corrected cluster-level P 5 0.05 with the voxel-level set at Puncorrected of small-volume corrected P 5 0.05). We also performed a whole-
5 0.001. brain linear regression analysis with global grey matter volumeLongitudinal fMRI and amyloid PET in AD BRAIN 2021: Page 7 of 13 | 7
Results
In the current cohort, 12 participants (34%) had intermediate amyl-
oid burden (Centiloid range 10–45) and none had high amyloid bur-
den at time point 1, while at time point 2 14 participants (40%) had
intermediate (Centiloid range 10–27) and seven participants (20%)
had high amyloid burden (Centiloid range 58–89) (Fig. 2A and B).
Two participants (5.7%) were tau-positive in the early metaVOI
(Fig. 2C).
In two participants the CDR had progressed from a global score
Downloaded from https://academic.oup.com/brain/advance-article/doi/10.1093/brain/awab335/6371865 by guest on 10 December 2021
of 0 to a global score of 0.5 with corresponding MMSE changes
from 30 to 26 (baseline Centiloid: 1.2; change in Centiloid: –5.9) and
to 29 of 30 (baseline Centiloid: 5.9; change in Centiloid: 8.2). Group-
level neuropsychological performance did not change between
baseline and follow-up as assessed with latent growth curve ana-
lysis. Neither did the change in scores on the conventional neuro-
psychological tests correlate with amyloid accumulation.
Statistical analysis of behavioural performance
during functional MRI
Based on the prior training session, the size difference for the
visuo-perceptual condition was set at a median of 6% at both time
points. Regarding behavioural performance during the functional
MRI experiment, there was no statistically significant interaction
between condition and time on reaction time (F = 0.142, P = 0.93)
nor on accuracy (F = 0.226, P = 0.88). The effect of time on reaction
time was significant for all four conditions (Pcorrected 5 0.0001): reac-
tion times were longer at time point 2 compared with time point 1
(Fig. 3A and Table 3). Time had no significant effect on accuracy for
any of the conditions (Fig. 3B and Table 3).
Primary outcome analyses
As the primary outcome analysis, we performed a VOI-based
voxel-wise regression analysis with change in amyloid load as pre-
dictor and, as outcome variable, the longitudinal change in BOLD
response during the associative-semantic minus the visuo-percep-
tual condition. In the VOI, the increase in amyloid Centiloid score
correlated positively with the difference in response amplitude
during the associative-semantic versus the visuo-perceptual con-
dition in the fundus and upper wall of the right STS (x = 51 mm, y =
–31 mm, z = 5 mm, Z = 3.53, Pcorrected = 0.008). Those individuals who
showed more amyloid accumulation, showed a higher activity in
this right posterior temporal activity focus at the second versus
the first time point (Fig. 4B and C). No significant differences were
observed in the remainder of the VOI (including the left posterior
temporal cortex). The right STS focus of differential activation did
Figure 2 Amyloid accumulation and tau distribution in the current co- not show a difference in BOLD response change between subjects
hort. (A) Regression plot between amyloid at time point 1 and time scanned on the Intera versus the Achieva system at baseline
point 2 expressed as Centiloids (CL). The vertical and horizontal dashed (P = 0.702).
red lines indicate the cut-off for amyloid-positivity (CL 5 23.5). (B) We evaluated how the longitudinal changes in functional MRI
Amyloid accumulation expressed in Centiloids: amyloid load is shown
response related to changes in offline measures on the two com-
at the baseline PET date and at the follow-up PET date, corresponding
data points are connected per subject. (C) Distribution of tau SUVR val- puterized language tasks testing confrontation naming and lexical
ues in the early metaVOI, with a bin width of 0.02. The vertical dashed decision. The increase in functional MRI BOLD response during the
red line indicates the cut-off for tau positivity (SUVR 5 1.38). associative-semantic versus the visuo-perceptual task in the right
STS correlated significantly with a decrease in accuracy for the off-
change as an independent variable (statistical threshold whole- line confrontation naming task. Higher activity in the right STS at
brain FWE-corrected P 5 0.05). the second versus the first time point correlated with lower con-
frontation naming accuracy scores (Pearson R = –0.5, Pcorrected =
0.016) (Fig. 4D). No significant correlation was found with reaction
Data availability times on the confrontation naming task nor with the lexical deci-
The data that support the findings of this study are available from sion performance parameters. Increases in amyloid load did not
the corresponding author upon reasonable request. correlate with change in offline experimental language test scores.8 | BRAIN 2021: Page 8 of 13 M. Reinartz et al.
Downloaded from https://academic.oup.com/brain/advance-article/doi/10.1093/brain/awab335/6371865 by guest on 10 December 2021
Figure 3 Behavioural scores on the Pyramids and Palm Trees Task. (A) Violin plot of reaction time per condition per time point (time point 1 versus
time point 2). Significance is indicated as ***P 5 0.001. (B) Violin plot of accuracy per condition per time point. Sem P/W = associative-semantic task
with pictures/words; Visuo P/W = visuo-perceptual task with pictures/words.
To dissect the effect of amyloid accumulation on the change in composite VOI and the difference in response amplitude in the left
activity during the associative-semantic versus visuo-perceptual IFS (x = –36 mm, y = 23 mm, z = 23 mm; Z = 3.43, voxel-level
condition in further detail, the VOI-based voxel-wise regression Puncorrected 5 0.001, Pcorrected = 0.698) and in the right dorsomedial
analysis was repeated for the associative-semantic minus visuo- prefrontal cortex (x = 3 mm, y = 23 mm, z = 56 mm; Z = 4.41, voxel-
perceptual condition for words and pictures separately. The differ- level Puncorrected 5 0.001, Pcorrected = 0.046).
ence in response amplitude in the right STS during the associa-
tive-semantic versus the visuo-perceptual condition for pictures at Secondary outcome analyses
the second versus the first time point correlated positively with
the difference in amyloid load in the composite VOI (x = 51 mm, y Both a region-based and a whole-brain voxel-wise regression ana-
= –31 mm, z = 5 mm; Z = 3.88, Pcorrected = 0.002). No significant effect lysis were performed with a cross-sectional measure of tau load at
was obtained for words. When we lowered the threshold to an un- time point 2 in the early metaVOI, as predictor, and as outcome
corrected P-value of 0.05, a correlation was also found for the word variable the longitudinal change in functional MRI BOLD response
condition between change in amyloid load in the composite VOI during the associative-semantic minus the visuo-perceptual con-
and the difference in response amplitude in the right STS dition. No significant effects were obtained.
(x = 45 mm, y = –37 mm, z = –1 mm; Z = 1.94, voxel-level Puncorrected = A linear regression analysis between grey matter volume
0.026, Pcorrected = 0.978). change in the posterior temporal VOI and change in functional
In the whole-brain analysis, reduced activity in the left inferior MRI activity levels did not yield a significant effect (Pcorrected 4 0.2).
frontal sulcus (IFS) region (x = –30 mm, y = 23 mm, z = 26 mm, ex- Neither was there a significant effect in the whole-brain voxel-
tent = 61 voxels, cluster level Pcorrected = 0.009) (Fig. 5A and B) as wise linear regression analysis with global grey matter change as
well as in the right dorsomedial prefrontal cortex (x = 3 mm, regressor and change in functional MRI activity levels at the
y = 23 mm, z = 56 mm, extent = 69 voxels, cluster level Pcorrected = whole-brain level (voxel-level Puncorrected 4 0.001).
0.005) correlated with increased amyloid (Fig. 5A and C). This indi- In the VOI-based analysis, when grey matter volume change in
cates a decrease in functional response as brain amyloidosis the posterior temporal VOI was added as a covariate in the regres-
increases. There was no statistically significant difference in the sion analysis between amyloid change and change in functional
functional MRI BOLD response change in the left IFS (P = 0.70) and MRI activity levels, the results remained essentially the same (right
the right dorsomedial prefrontal focus (P = 0.89) between subjects posterior STS: x = 51 mm, y = –31 mm, z = 5 mm; Z = 3.61, Pcorrected =
scanned on the Intera versus the Achieva system at baseline. 0.006).
For these two activity foci, no significant correlation was found In the whole-brain voxel-wise regression analysis, when global
between the mean functional MRI BOLD response change of the grey matter volume was added as a covariate, the result in the
activity focus and performance on the experimental language tests right dorsomedial prefrontal cortex remained essentially the same
after correction for multiple comparisons. In addition, no signifi- (x = 3 mm, y = 23 mm, z = 56 mm, extent = 51 voxels, cluster level
cant correlations between functional MRI BOLD response change Pcorrected = 0.017), while the result in the left IFS region dropped just
and changes in reaction time, nor with accuracy during the below the significance threshold (x = –30 mm, y = 23 mm,
Pyramids and Palm trees functional MRI task were observed. z = 26 mm, extent = 34 voxels, cluster level Pcorrected = 0.056).
The whole-brain analysis was repeated for the associative-se-
mantic minus visuo-perceptual condition for words and pictures
separately. Reduced activity in the left IFS during the associative-
Discussion
semantic versus the visuo-perceptual condition for pictures at the Longitudinal within-subject studies of change in cognitive brain
second versus the first time point correlated with increased amyl- circuits in the asymptomatic stage of Alzheimer’s disease over a
oid load (x = –30 mm, y = 26 mm, z = 26 mm, extent = 46 voxels, long time course are rare. Such studies are critical to understand-
cluster level Pcorrected = 0.035). When we lowered the threshold to ing the resilience of cognitive brain circuits during the preclinical
an uncorrected P-value of 0.001, a correlation was also found for phase of the disease, an important theme given the long and pro-
the word condition between change in amyloid load in the tracted course of this preclinical phase and its increasingLongitudinal fMRI and amyloid PET in AD BRAIN 2021: Page 9 of 13 | 9
Downloaded from https://academic.oup.com/brain/advance-article/doi/10.1093/brain/awab335/6371865 by guest on 10 December 2021
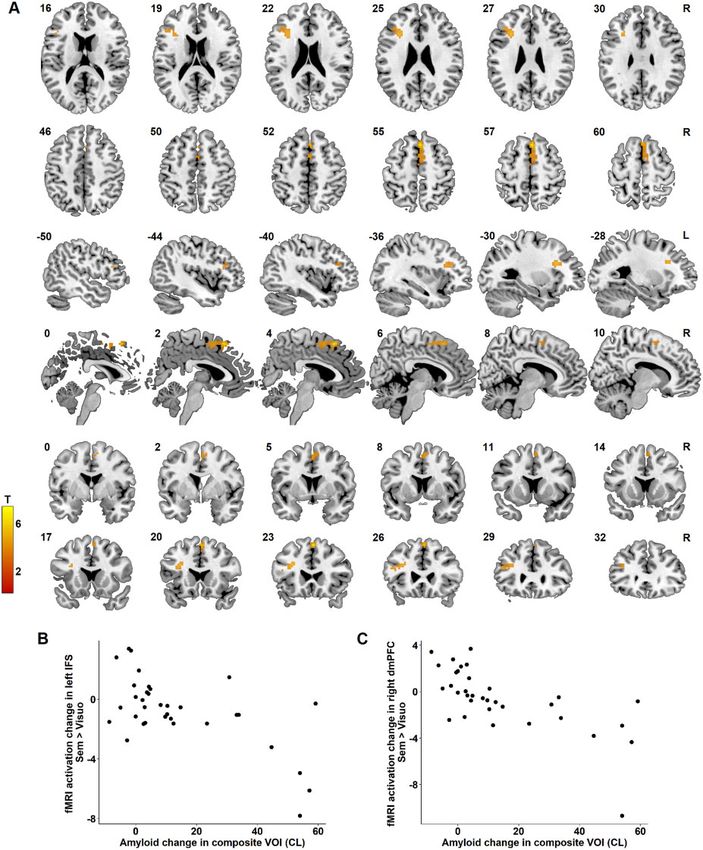
Figure 4 Region-based regression analysis. (A) Region of interest comprising the bilateral STS for the analysis, indicated in red. (B) Region of signifi-
cant correlation between amyloid change in the composite VOI and functional MRI activation change during the associative-semantic minus visuo-
perceptual condition in the right posterior STS (peak 51, –31, 5, voxel-level Pcorrected = 0.008). The colour scale indicates the T-values. MNI coordinates
are indicated in the top left corner and orientation of the brain in the top right corner (R = right). (C) Relation between amyloid accumulation in the
composite VOI expressed in Centiloids (CL) and functional MRI activation change during the associative-semantic minus the visuo-perceptual condi-
tion for time point 2 versus time point 1 in the right STS for illustrative purpose. (D) Correlation between change in functional MRI activation in the
right STS VOI during the associative-semantic minus visuo-perceptual condition and the normalized change in confrontation naming accuracy
scores for time point 2 versus time point 1 (Pearson R = –0.5, Pcorrected = 0.016). Amyloid-negative and amyloid-positive cases at follow-up are indicated
in blue and red, respectively.
relevance for early intervention. Here we examined whether inferior branch of the middle cerebral artery is associated with
changes in amyloid load are associated with functional changes in word comprehension deficits.48,50 The posterior STS has a word-
the language circuit over an average period of 6 years in cognitive- specific role and has been implicated in lexical-semantic retrieval,
ly intact older adults, with a special focus on left and right poster- while the posterior MTG is amodal and involved in semantic proc-
ior temporal cortex.14,15,17 We also examined whether any such essing of both words and pictures.51–54 The cortex in the fundus
effect was mediated via aggregated tau given the narrow connec- and the upper and lower wall of the left and right STS has been
tion between the spread of tangles beyond medial temporal cortex consistently implicated in word intelligibility by a large series of
and cognitive symptomatology. The primary hypothesis was con- imaging studies.15,28,52–54
firmed: as amyloid accumulates in cognitively intact older adults, Previous task-related functional MRI studies on various stages of
right posterior temporal cortex increased in activity (Fig. 4B and C). Alzheimer’s disease have highlighted response amplitude changes
The increase in right posterior temporal activity correlated with a in posterior temporal cortex. For instance, in cognitively intact APOE
decrease in offline confrontation naming performance (Fig. 4D). e4 carriers with a family history of Alzheimer’s disease who perform
These changes could not be accounted for by increased tau aggre- a famous name discrimination with famous versus unfamiliar
gation levels. Furthermore, in an exploratory whole-brain analysis, names, activity in the right posterior temporal cortex is higher than
amyloid accumulation was associated with a decrease of activity in controls who do not have this Alzheimer’s disease risk factor.16
in the left IFS and the dorsomedial prefrontal cortex, regions typic- The right-sided posterior temporal increase was also present in
ally implicated in semantic and cognitive control, respectively. amnestic mild cognitive impairment patients under the same task
The posterior third of the left STS is a key node in the language conditions.16
network, close to or overlapping with what has been classically In the current study, while the posterior temporal location is in
called ‘Wernicke’s area’ in the neurological jargon,48 although de- agreement with the a priori hypothesis, the direction of the activity
bate exists about its exact anatomical boundaries and the contem- change in left and right posterior temporal cortex did not exactly
porary usefulness of this eponym deeply engrained in neurological match the predictions based on prior studies.14,17 To start, in the
history.49 Damage of this region due to stroke in the territory of the left posterior temporal cortex, a cross-sectional study in10 | BRAIN 2021: Page 10 of 13 M. Reinartz et al.
Downloaded from https://academic.oup.com/brain/advance-article/doi/10.1093/brain/awab335/6371865 by guest on 10 December 2021
Figure 5 Whole-brain regression analysis. (A) Region of significant correlation between amyloid change in the composite VOI and functional MRI acti-
vation change during the associative-semantic minus visuo-perceptual condition in the left IFS (cluster peak –30, 23, 26, cluster-level Pcorrected = 0.009)
and the right dorsomedial prefrontal cortex (cluster peak 3, 23, 56, cluster level Pcorrected = 0.005). The colour scale indicates the T-values. MNI coordi-
nates are indicated in the top left corner and orientation of the brain in the top right corner. (B and C) Relation between amyloid accumulation in
Centiloids (CL) and the change in functional MRI activation during the associative-semantic minus the visuo-perceptual condition in (B) the left IFS
and (C) the right dorsomedial prefrontal cortex (dmPFC).
cognitively intact older adults found an increase in activity with increase in right posterior temporal cortex confirmed the predic-
higher amyloid load.14 The same study reported a weak positive tions based on Nelissen et al.,17 both in terms of location and direc-
correlation between amyloid load and confrontation naming reac- tion of change.
tion times.14 From this, one could have expected a longitudinal in- It is widely accepted that the right temporal neocortex contra-
crease in response of left posterior temporal cortex with lateral to the left language network can contribute to word com-
increasing amyloid, which was not observed. Conversely, the prehension.55–57 The right posterior MTG and STS has beenLongitudinal fMRI and amyloid PET in AD BRAIN 2021: Page 11 of 13 | 11
previously reported to show functional MRI response changes in mediated via grey matter volume change or tau aggregation.
language recovery following stroke58 (for a review see Schevenels However, the relation between amyloid accumulation and func-
et al.59). An increase in the right STS and MTG has also been tional changes in cognitive brain circuitry could still be indirect.
reported in amyloid PET-positive Alzheimer’s disease in the early For instance, the amyloid load could serve as a proxy or a ‘timer’
dementia stage.17 In post-stroke aphasia the functional activity of where the individual is in the Alzheimer’s disease patho-
increases seen in homologous right-hemispheric language regions physiological process. Amyloid accumulation indicates the rising
are generally considered less beneficial for recovery than increases phase of amyloid-b aggregation. During this phase, specific
in the surroundings of the lesioned left-sided region.60 In the cur- pathophysiological processes may be active, the mechanism of
rent study the increase in response amplitude correlated with an which may be non-amyloidogenic. In that case, amyloid accu-
increased proportion of naming errors on an offline confrontation mulation is a temporal marker of the disease stage rather than a
Downloaded from https://academic.oup.com/brain/advance-article/doi/10.1093/brain/awab335/6371865 by guest on 10 December 2021
naming task. Under the hypothesis of a compensatory response, direct cause.
this would already imply that the compensation is insufficient.
Theoretically, the right-hemispheric posterior temporal hyperacti- Study limitations
vation could also be harmful. Non-invasive inhibitory brain stimu-
lation of right inferior frontal gyrus or right STS has not allowed Theoretically, amyloid in the blood vessel wall may affect the
the resolution of this issue unequivocally yet.59,61 Based on the haemodynamic response, which is the basis of the BOLD signal.
published studies, overall there seems to be a potential beneficial However, this would not explain the regional specificity nor the
effect of inhibitory non-invasive stimulation of these regions in observation that some regions show a positive and others a nega-
post-stroke aphasia but publication bias and small effect sizes ren- tive effect of accumulating amyloid on the functional response.
der interpretation difficult. Two different amyloid PET tracers were used; however, a con-
In cognitively intact older adults, when amyloid load is high, sistent shift in values between tracers will not have an effect on
the response in the right IFS with higher executive demands is the regression coefficient with functional MRI response amplitude
reduced.12 The findings in our longitudinal study are in line with change. This issue is further resolved by the use of Centiloid
this observation: the associative-semantic task is demanding and scale.41 The MRI scanner used was not identical at the two time
requires more executive control than the visuo-perceptual control points in a subset of cases. This was systematically included as a
task. As amyloid accumulates, the IFS response to higher cognitive covariate in all analyses, and furthermore, no effect was observed
control demands becomes attenuated. In our study, the effect of the difference in MRI scanner.
occurred to the left with also a subthreshold effect in the right IFS.
The left-sided predominance may well relate to the verbal and se- Conclusion
mantic nature of our task while the task in Oh et al.12 was based on
colours, isolated vowels and consonants. The left-sided IFS has This 6-year longitudinal multimodal imaging study provides in-
been implicated in semantic control in numerous previous studies sight into functional changes occurring during the rising phase of
(for reviews see Noonan et al.62 and Jackson63). These experiments amyloid accumulation. It confirms the vulnerability of the poster-
are typically based on tasks similar to the associative-semantic ior temporal nodes of the language network to Alzheimer’s disease
task used in the current experiment. They manipulate semantic in this early, asymptomatic stage. It also demonstrates that amyl-
control by varying the association strength between sample and oid accumulation is associated with functional effects on prefront-
test stimuli, among other ways.63 The dorsomedial prefrontal cor- al cognitive control regions at this early stage.
tex has also been found bilaterally relatively consistently in these
studies.62,63 It is part of the multi-demand network,64 a domain- Acknowledgements
general cognitive control system, and consists of Glasser et al.65
areas 8BM and SCEF. The correspondence between these previous We would like to thank the staff of Nuclear Medicine, Neurology,
foci and the current results lends further credibility to the outcome and Radiology at the University Hospitals Leuven. Special thanks
of the whole-brain voxel-wise analysis results. The findings dem- to Carine Schildermans, Dorien Timmers, Kwinten Porters, Jef Van
onstrate the subclinical alterations in the cognitive control net- Loock, Mieke Steukers, Charlotte Evenepoel, Veerle Neyens, Tarik
work in preclinical Alzheimer’s disease. These findings in the Jamoulle and Kelly Hilven for help with the study.
semantic domain are highly complementary to similar prefrontal
effects on cognitive control found previously in the non-verbal Funding
domain.12
It is well accepted that the amount of tau aggregates relates This work was supported by the Foundation for Alzheimer
better to cognitive scores and Alzheimer’s disease clinical severity Research SAO-FRMA (09013, 11020, 13007); Research Foundation
stage than amyloid-b.66 We hypothesized that in the asymptomat- Flanders (G.0660.09, G094418N); KU Leuven (OT/08/056, OT/12/097,
ic stage, tau aggregation would be more closely related to function- C14/17/108); IWT Vlaamse Impulsfinanciering voor Netwerken
al brain activity changes than amyloid load but this was not the voor Dementie-onderzoek; Research Foundation Flanders senior
case. In cognitively normal older adults, the proportion of cases clinical investigator grant to R.V. and K.V.L.; 18F-flutemetamol was
with increased tau in early vulnerable regions is generally relative- provided by GE Healthcare free of charge for this academic investi-
ly low, as is also the case in the current study (Fig. 2C). Tau PET has gator-driven trial. The AV1451 precursor was provided free of
low sensitivity for the earliest Braak stages, i.e. Braak 1–3.67,68 Early charge via a material transfer agreement between R.V.’s institution
changes in phosphorylation of tau and fibril formation precede tau and Avid Radiopharmaceuticals, a wholly-owned subsidiary to
aggregation69 and that would also not be detected by current tau EliLilly (AV1451-EXIST-19). J.S. is a junior postdoctoral fellow of the
PET radio-ligands. FWO (12Y1620N).
The current findings highlight the importance of amyloid as a
marker of asymptomatic Alzheimer’s disease and establishes an
association with the organization of cognitive brain circuits. The
Competing interests
data suggest a link between amyloid accumulation and function- None of the authors report disclosures relevant to the manuscript.
al brain organization at a neuroanatomical scale, which is not R.V. has received research grants from Research Foundation—You can also read