Centuria Capital Group - FY22 RESULTS
←
→
Page content transcription
If your browser does not render page correctly, please read the page content below
10 AUGUST 2022 ASX: CNI
UNLISTED: 1 WILLIAM SQUARE, PERTH WA LISTED: 56-88 LISBON STREET, FAIRFIELD NSW
Centuria
Capital Group
FY22 RESULTS
UNLISTED: BLOOMFIELD MEDICAL CENTRE, ORANGE NSW UNLISTED: CAMERON PARK PLAZA, CAMERON PARK NSW
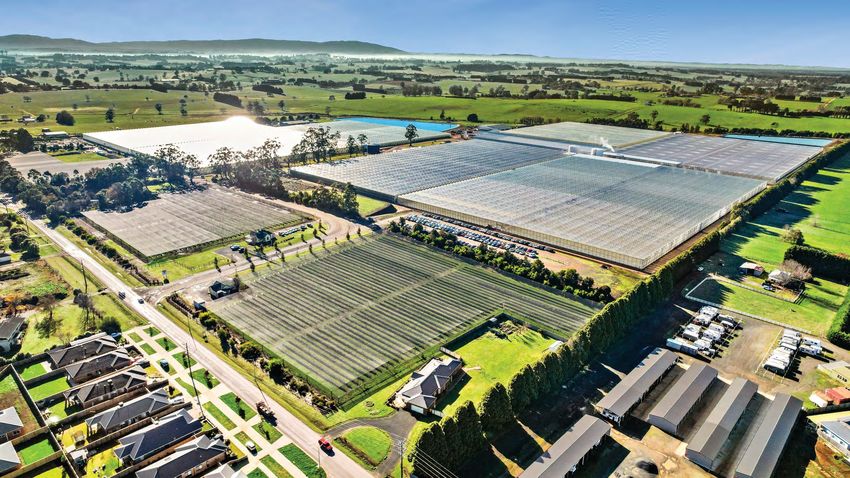
UNLISTED: ROBINA HOME + LIFE CENTRE, VARSITY LAKES QLD UNLISTED: FLAVORITE GLASSHOUSE, WARRAGUL VIC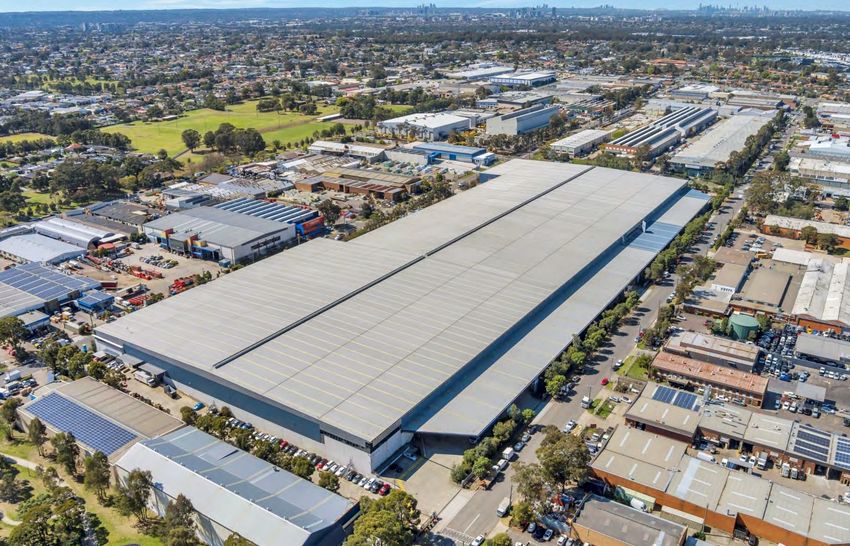
ACKNOWLEDGEMENT OF COUNTRY
                                               Our group manages property throughout Australia
                                               and New Zealand. Accordingly, Centuria pays its
                                               respects to the traditional owners of the land in each
                                               country, to their unique cultures and to their elders
                                               past, present and emerging.

                                               AGENDA
                                               1.   Group overview
                                               2.   Financial results
                                               3.   Divisional overview
                                               4.   Strategy
                                               5.   Appendices

UNLISTED: FLAVORITE GLASSHOUSE, WARRAGUL VIC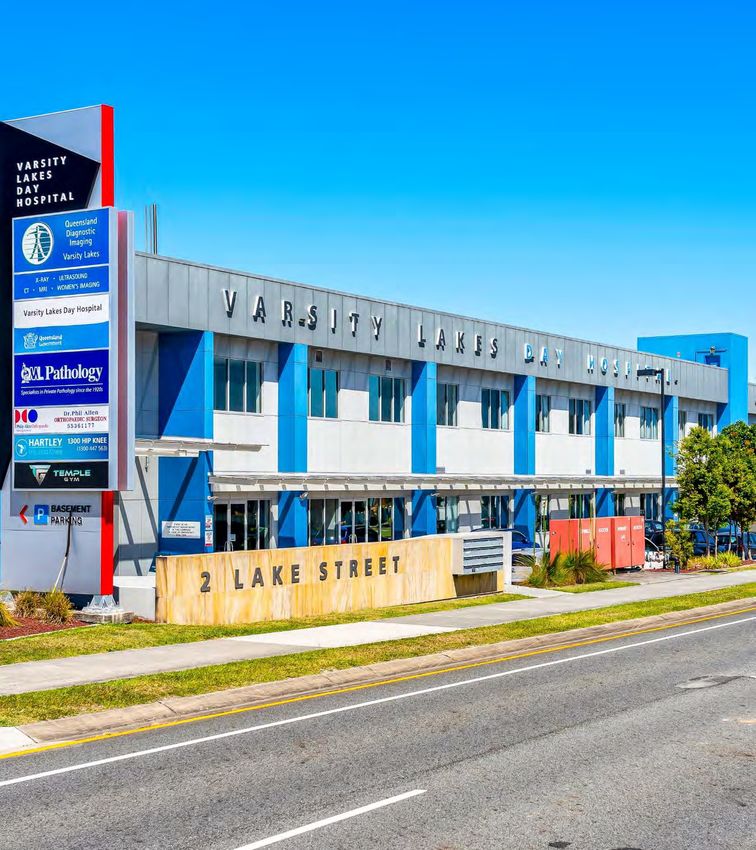
2 CORNWALLIS STREET

                                                          CSIRO DATA61 BUILDING, 13 GARDEN STREET

                                                                                                    Group overview
                                                                                                    SECTION ONE
                  BIOMEDICAL BUILDING, 3 CENTRAL AVENUE

UNLISTED: AUSTRALIAN TECHNOLOGY PARK, SOUTH EVELEIGH NSW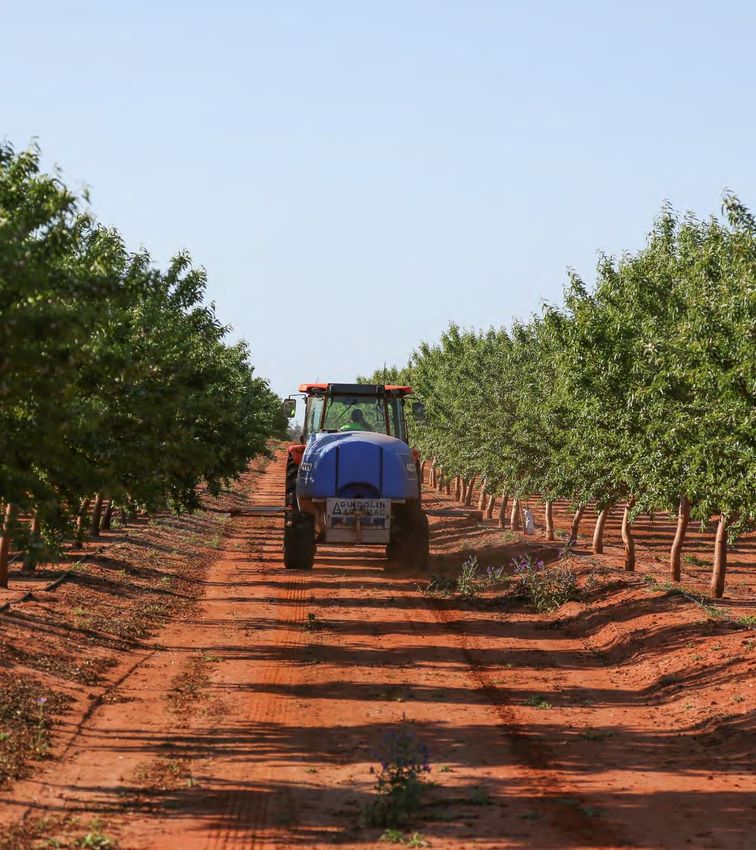
A leading Australasian real estate funds manager
Included in the S&P/ASX200 Index
$20.6bn GROUP AUM1
$1.2bn
ON BALANCE SHEET TOTAL
$339m
CASH & UNDRAWN DEBT
$19.8bn REAL ESTATE AUM
CENTURIA OFFICE
REIT (ASX:COF)
INVESTMENTS
$192m (18.9%)2
CO-
INVESTMENTS
CO-
CENTURIA INDUSTRIAL
LISTED
$0.8bn
REIT (ASX:CIP)
$6.8bn $13.0bn
LISTED
$288m (16.1%)2
INVESTMENT BONDS ASSET PLUS
LISTED REAL ESTATE UNLISTED REAL ESTATE
$497m (NZX:APL)
$17m (19.9%)2
CENTURIA UNLISTED
INVESTMENTS
UNLISTED CO-
REAL ESTATE AND DEBT
$253m
CENTURIA LIFE
CENTURIA
$4.1bn $2.4bn $0.3bn $8.3bn $2.4bn $2.3bn INVESTMENT BONDS
CENTURIA PROPERTIES
CENTURIA CENTURIA ASSET PLUS SINGLE MULTI ASSET MULTI ASSET GUARDIAN FRIENDLY HELD FOR SALE AND
INDUSTRIAL REIT OFFICE REIT LIMITED ASSET CLOSED ENDED OPEN ENDED SOCIETY DEVELOPMENT $134m
ASX:CIP ASX:COF NZX:APL FUNDS FUNDS FUNDS
$387m
Note: Assets under management (AUM) as at 30 June 2022. All figures above are in Australian dollars (currency exchange ratio of AU$1.000:NZ$1.1088 as at 30 June 2022). Numbers presented may not add up precisely to the totals provided due to rounding
1. AUM includes assets exchanged to be settled, cash and other assets
2. Based on the respective close prices for COF, CIP and APL at Wednesday, 30 June 2022. Includes ownership by associates of Centuria Capital Group
Centuria ASX:CNI 4
Delivering strong growth and creating value across the platform

$20.6bn                                                                                14.5cps                                                                                 11.0cps                          89%
Group AUM                                                                              FY22 OEPS1 delivered                                                                    FY22 DPS delivered               Recurring revenues
+18% increase above FY21                                                               +20.8% increase above FY21                                                              +10.0% increase above FY21 DPS   of FY22 total group revenues

                                                                                                                                                                                                                14.5cps
                                                                                                                                                                                                                FY23 OEPS guidance

$3.1bn                                                                                 $2.1bn                                                                                  $1.0bn                           11.6cps
FY22 gross                                                                             Development                                                                             FY22 valuation
real estate activity2                                                                  pipeline3                                                                               increase4                        FY23 DPS guidance
                                                                                                                                                                                                                +5.4% increase above FY22 DPS

1.   Operating EPS (OEPS) is calculated based on the Operating NPAT of the Group divided by the weighted average number of securities
2.   Includes $2,175m of acquisitions exchanged and settled in FY22, $403m of acquisitions exchanged in FY22 yet to be settled and $516m of real estate finance transactions
3.   Development projects and development capex pipeline, including fund throughs. Committed development pipeline $1.3bn, future pipeline $0.8bn
4.   Net valuation movement from managed funds
                                                                                                                                                                                                                                Centuria ASX:CNI   5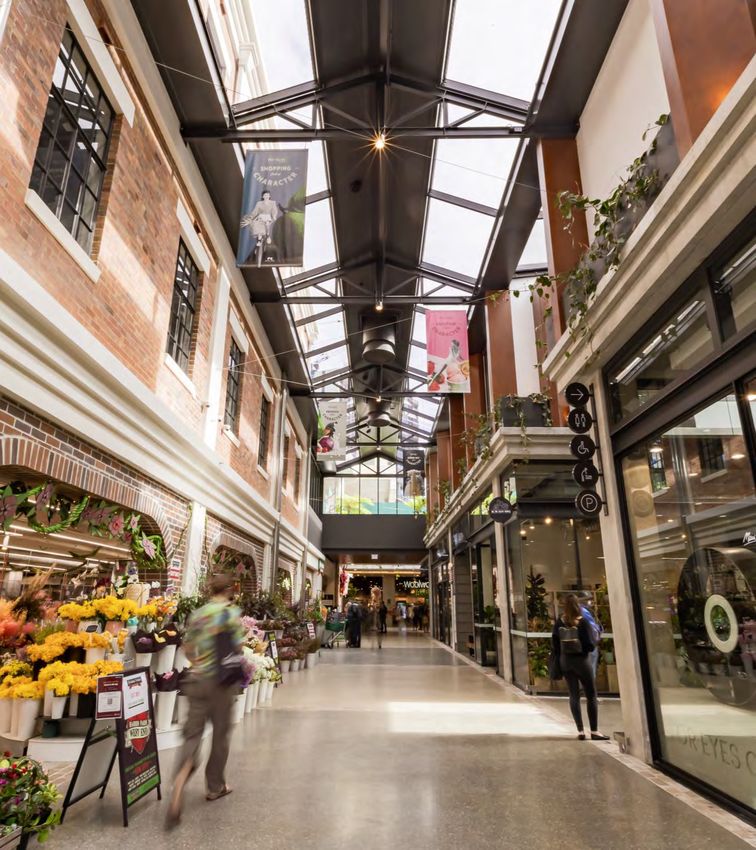
Real estate growth lifts Group AUM to $20.6bn (+18% above FY21)
Executing on strategy

                                                                                                                                          Organic activity
                                                                                                                                          •    $3.1bn1 (90 properties & 37 real estate finance loans) FY22 gross real estate
                                                                                                                                               activity, FY22 $1.0bn Group valuation uplift, FY22 $0.1bn development completions
                                                                                                                                          •    Gross real estate activity: $2.1bn unlisted, $1.0bn listed

                                                                                                                                          Real estate AUM
                                                                                                                                          •    Significant growth to $19.8bn (+20%)
                                                                                                                                          •    Unlisted to $13.0bn (+18%)
                                                                                                                                          •    Listed to $6.8bn (+24%)

                                                                                                                                          Highlights
                                                                                                                                          • Industrial to $6.0bn (+25%): ASX: CIP to $4.1bn, unlisted NZ industrial fund (CNZIF) to $0.6bn
                                                                                                                                          • Healthcare AUM to $1.7bn (+55%): CHPF open-ended fund to $0.6bn2
                                                                                                                                          • Agriculture AUM to $0.4bn (+300%): $0.2bn Centuria Agriculture Fund launched
                                                                                                                                          • Centuria Bass Credit AUM to $0.8bn (+167%)
                                                                                                                                          • Institutional AUM to $1.9bn (+12%): Morgan Stanley Real Estate Investment Healthcare
                                                                                                                                               Partnership to $0.2bn2, Daily Needs Retail Mandate to $0.6bn
      UNLISTED: MURDOCH CANCER TREATMENT CENTRE WA

1.   Includes $2,175m of acquisitions exchanged and settled in FY22, $403m of acquisitions exchanged in FY22 yet to be settled and $516m of real estate finance transactions
2.   Includes development projects on an accounting carrying value
                                                                                                                                                                                                                        Centuria ASX:CNI     6
AUM momentum from organic growth and select mergers
Assets under
                                                                                                  $17.4bn
                                                                                                                       $20.6bn
management

                                                                                   $8.8bn

                                                                       $6.2bn
                                                                                                                                13.0                      Unlisted real estate

                                                              $4.9bn
                                                                                                     11.0

                                                 $3.8bn

                                                                                     4.0

40%                                                 1.5
                                                               1.9
                                                                         2.6
                                                                                                      5.5
                                                                                                                                 6.8                        Listed real estate
                                                                                     4.0
CAGR1                                               1.5        2.1       2.7
                                                    0.8        0.9       0.9         0.8              0.9                        0.8                       Investment bonds

                                                  FY17        FY18      FY19        FY20            FY21                       FY22

                                                                                               Primewest &
                                          360 Capital Group            Heathley   Augusta NZ                                                             Corporate initiatives
                                                                                               BASS Capital
                                                 $1.4bn                $0.6bn      $1.7bn
                                                                                                   $5.2bn
                                                                                                                                                        Real estate initiatives
                                                                       $0.6bn      $0.5bn          $1.1bn                      $3.1bn

                                                                                               140 ST GEORGES FUND         LISBON ST, FAIRFIELD

                                                                                    NISHI                             101 MORAY ST, SOUTH MELBOURNE

                                                                                                                         HERITAGE AGED CARE, NZ

                                                                                                                     FLAVORITE GLASSHOUSE, WARRAGUL

1.   CAGR calculated from 30 June 2017 to 30 June 2022
                                                                                                                                                      Centuria ASX:CNI        7
A unique platform with scale and diversification

         Platform                                                                       Expertise                                               Funds                                              Properties
         •    7 real estate asset classes                                               •    24 years of real estate funds                      •   Manager of Australia’s largest pure play       •       No single property accounts for
              with specialist strategies                                                     management experience                                  office and industrial REITs, over 150                  more than 2.7% of Group AUM1
                                                                                                                                                    unlisted real estate funds
         •    $19.8bn real estate AUM split approx.                                     •    400 staff and eight offices                                                                           •       Approx. 2,480 tenants, 460 properties and
              two thirds unlisted and one third listed
                                                                                        •    Fully integrated in house
                                                                                                                                                •   No unlisted fund accounts for more than                60 real estate finance loans2
                                                                                                                                                    3.1% of Group AUM1
         •    Exposure to major Australasian                                                 management capability                                                                                 •       Excluding government (11%), no tenant
              real estate markets                                                                                                               •   Diversified investors across listed REITs,             accounts for more than 2.5% of tenant
                                                                                                                                                    unlisted retail, wholesale and institutional           income across the platform

          Group revenues                                                            Group balance sheet                                         Group co-investments                                   Corporate initiatives
          •    89% recurring                                                        •    $339m1 of cash and undrawn debt to                     •   COF co-investment                                  •    Recent acquisitions have offered
               revenues                                                                  support platform growth                                    ($192m, 18.9%)3                                         geographic and sector diversity
          •    Embedded                                                             •    CNI debt sources: listed bond,                         •   CIP co-investment                                  •    New sectors e.g. healthcare,
               performance fees                                                          corporate notes, revolver facilities                       ($288m, 16.1%)3                                         agriculture, retail

1.   As at 30 June 2022
2.   Includes asset exchanged to be settled and real estate finance loans by property
3.   Based on the respective close prices for COF, CIP at Wednesday, 30 June 2022. Includes ownership by associates of Centuria Capital Group
                                                                                                                                                                                                                                Centuria ASX:CNI       8
Sustainability at Centuria Capital
Developing a flexible and relevant sustainability framework

                          Conscious of
                          climate change                                                                                                                                                                 Industrial: Industry Participation
                          Environment                                                                                                                                                                    NABERS Accelerate program for
                                                                   Green Building Membership                               Climate Resilience                        Climate Action                      Warehouses and Cold Stores
                                                                   Members of both the Australian and                      Implementation of climate adaptation      Ongoing solar installation across   Office: COF 4.81 Star NABERS
                                                                   New Zealand Green Building Council                      plans to reduce the physical impacts of   our office and industrial assets    Energy Sustainability Portfolio Index
                                                                                                                           climate change                            in partnership with tenants         Rating, up from 4.7 the previous year
FY22 SELECT INITIATIVES

                          Valued
                          stakeholders
                          Social
                                                                   Member of Healthy Heads2
                                                                                                                           96%
                                                                                                                           Customer Focused
                                                                                                                                                                     94%
                                                                                                                                                                     Employee Engagement
                                                                                                                                                                                                         41%
                                                                                                                                                                                                         Women in the workplace
                                                                   Ongoing focus on the mental                             96% of surveyed tenants3 are satisfied    94% of employees4 are proud         Centuria is committed to
                                                                   health and wellbeing of our                             with Centuria as an asset owner           to work at Centuria                 diverse and inclusive workplace
                                                                   tenants and employees                                                                                                                 (FY21: 37%)

                          Responsible
                                                                                                                            Second Modern Slavery
                          business principles
                          Governance                                                                                        Statement Delivered
                                                                                                                                                                     GRI                                 Centuria’s second
                                                                                                                                                                                                         Sustainability Report will be
                                                                   Climate Focused Investment                                                                        Aligned GRI Index disclosure
                                                                                                                            Over 350 suppliers have been
                                                                                                                                                                     For CNI, CIP and COF                released before Centuria
                                                                   Climate Change is now a standard                         assessed5 for Modern Slavery                                                 Capital Group’s 2022 AGM
                                                                   investment consideration across all                      risks, further engagement underway
                                                                   asset classes

          Centuria is committed to the development and implementation of environmental and social sustainability and corporate governance practices. Centuria has three
          areas of focus, Conscious of Climate Change (Environment), Valued Stakeholders (Social) and Responsible Business Principles (Governance)

1.           Centuria Office REIT (ASX: COF) has improved it’s NABERs SPI rating consistently for three years
2.           Centuria Industrial REIT (ASX:CIP) became a member of Healthy Heads in FY22
3.           Centuria undertake annual tenant surveys. The reported figures are from the Group’s FY22 combined commercial and industrial surveys
4.           Centuria undertake regular employee engagement surveys. The reported figure is from the Group’s FY22 survey
5.           Assessed through the PCA Informed 365 system
                                                                                                                                                                                                                      Centuria ASX:CNI           9
ARTIST IMPRESSION

                                                          Financial results
                                                          SECTION TWO

UNLISTED: VARSITY LAKES DAY HOSPITAL, VARSITY LAKES QLD
Operating earnings and distributions
Operating NPAT1 Statutory NPAT3
Earnings and distributions (cents per security)
$114.5m ($37.9m)
OEPS2 Statutory EPS3
14.5cps (4.8)cps 14.50 14.50
FY22 12.70
performance 12.00 12.00
DPS
11.0cps
+10.0% increase above FY21 DPS
OEPS
11.60
11.00
14.5cps 9.70
10.00
9.25
FY23
guidance
11.6cps FY19 FY20 FY21 FY22 FY23
guidance
DPS
(5.4% above FY22)
Operating EPS Total distribution per security
1. Operating NPAT of the Group comprises of the results of all operating segments and excludes non-operating items such as transaction costs, mark to market movements on
property and derivative financial instruments, the results of Benefit Funds, Controlled Property Funds and share of equity accounted net profit in excess of distributions received
2. Operating EPS is calculated based on the Operating NPAT of the Group divided by the weighted average number of securities
3. Attributable to CNI securityholders
Centuria ASX:CNI 11Expanded platform enhances fee generation
Group margins improved to 47%
FY22 FY21
OPERATING PROFIT BY SEGMENT
($m) ($m) 1 Profit increases by 77% due to organic
growth and Primewest merger
1 Property funds management1 79.4 44.8
2 Performance fees 33.0 17.9 2 FY22 increased due to additional transaction
activities and open-ended funds outperformance.
3 Co-investment earnings 48.4 36.4
4 Development 6.5 4.5 3 Continued returns from re-investment
strategy to support core earnings growth
5 Property and development finance 4.1 0.4
4 Shift from development profit to development
management fee contributions in FY22
6 Investment bonds management 4.6 0.9
7 Corporate segment (20.8) (14.2)
5 Centuria Bass Credit benefitting from Centuria
Capital’s property expertise and distribution
Operating profit before interest and tax 155.2 90.7
Higher earnings due to one-off prior period fee
7 Finance costs2 (17.8) (11.2)
6 re-coupments due to the unitisation of capital
guaranteed products
Operating profit before tax 137.4 79.5
8 Operating tax expense (22.9) (9.3) 7 1H, 2H FY22 broadly inline and increase
commensurate with platform expansion
Operating profit after tax3 114.5 70.2
Reflects higher operating profits driven by
LISTED: 27-30 SHARP COURT, CAVAN SA Operating EPS (cents per stapled security)4,5 14.5 12.0 8 Property Funds Management and increase in
performance fees
1. Excluding performance fees
2. Excluding reverse mortgages borrowing costs and finance charges on puttable instruments
3. Operating NPAT of the Group comprises of the results of all operating segments and excludes non-operating items such as transaction costs, mark to market movements on property and derivative financial instruments
the results of Benefit Funds, Controlled Property Funds and share of equity accounted net profit in excess of distributions received
4. Operating EPS is calculated based on the Operating NPAT of the Group divided by the weighted average number of securities
5. Weighted average number of securities at 30 June 2022: 791,188,235 (at 30 June 2021: 548,215,946)
Centuria ASX:CNI 12Diverse recurring revenues contribute to Group profits
Group revenues ($m)
FY22
$33m 350
89%
FY22 transaction
fee income3 up
FY22 recognised Recurring 162% on FY21
performance fees 300 revenues2
Performance fees Transaction fee income from
250 92% Other income $4.3bn4
$21m
Recurring
revenues2 Distribution income of total transaction activity
FY22 performance fee 200 Development management fees
cash collected Development revenue $735m $2,175m $516m
Acquisitions FY22 acquisitions FY22 Real estate
exchanged at exchanged and finance
150 Transaction fee income3 FY21 results that settled
have since settled
$179m 100 $893m
FY22 divestments
FY22 latent unrecognised
performance fees1 Management fees
50
Ongoing
$403m
Acquisitions exchanged,
0 at FY22 results, yet to be settled
FY21 FY22 and fees recognised
1. The total amount of latent (unrecognised) future performance fees available to the Group are estimated at $179m. Unrecognised performance fees are estimated based on current property valuations adopted within each
fund and due to inherent uncertainties in relation to the future performance of each property do not qualify for recognition in the current period under Centuria’s revenue recognition policy and may not entirely eventuate
2. Exclude performance fees
3.
4.
Transaction fee income for FY22 of $39.3m includes acquisition, financing, underwriting and sales fees
Excludes $403m of FY22 acquisitions exchanged, yet to be settled
Centuria ASX:CNI 13Balance sheet positioned to capitalise on future growth opportunities
Increased funding optionality, access to new debt instruments
FY22 FY21
OPERATING BALANCE SHEET
($m) ($m)
13.2% Assets
$1.73 Operating gearing ratio3
(FY21: 3.9%)
Cash and cash equivalents
Receivables
185.0
105.9
249.6
120.8
Net asset value
per security1,2
(FY21: $1.92)
6.8 times Financial assets 764.6 750.2
Operating ICR4 Other assets 10.0 8.7
(FY21: 8.2 times)
Deferred tax assets 46.6 42.5
Inventory 129.4 53.7
$339m $182m
Equity accounted investments 74.9 55.6
Right of use asset 17.0 19.9
Cash and Net cash inflow from
undrawn debt Intangible assets 788.2 790.5
operating activities
available for growth (FY21: $35m) TOTAL ASSETS 2,121.6 2,091.5
opportunities
Liabilities
Payables 126.1 83.9
Borrowings 440.3 321.4
FY22
Corporate notes Interest rate swap at fair value 18.8 31.2
$100m maturity
$35.0m (0.8 years)
Call/Put option liability 48.7 22.7
3 year revolver facility and Lease liability 19.4 21.8
$62.2m (1.8 years)
$50m $100.0m (2.6 years)
$198.7m (3.8 years)
Provisions, deferred tax and other liabilities
TOTAL LIABILITIES
95.1
784.4
99.3
580.3
5 year revolver facility
Net assets 1,373.2 1,511.2
LISTED: 243 BRADMAN STREET, ACACIA RIDGE QLD
NAV ($/per security1) 1.73 1.92
1. Number of securities on issue 30 June 2022: 792,787,120 (at 30 June 2021: 787,802,693)
2. Decline in net asset value per security is primarily attributable to the unrealised fair valuation of the Group’s listed co-investment stakes
3. Gearing ratio is calculated based on (operating borrowings less cash) divided by (operating total assets less cash)
4. Operating interest cover ratio is calculated based on operating finance costs divided by operating profit before tax excluding finance costs (excluding reverse mortgages borrowing costs and finance charges on puttable instruments)
Centuria ASX:CNI 14Managing debt across the platform1
21 Quality lenders
$7.5bn Total lending facilities across over
150 funds
2.5yrs Weighted average debt duration
2.1yrs Weighted average hedge duration
56% Weighted average hedging profile
LISTED: 56-88 LISBON STREET, FAIRFIELD NSW
1. Not representative of any single fund. Aggregated across Centuria Capital Group and all funds managed by Centuria
Centuria ASX:CNI 15Divisional
overview
SECTION THREE
UNLISTED: WEST VILLAGE SHOPPING CENTRE PRECINCT, WEST END QLD$19.8bn1 real estate platform (+20% over FY22)
Diverse geographies, sectors, fund types capital sources
Geography1 Sectors
0.1 0.5 0.4 0.2
0.3 Office
0.8
Industrial
2.2 2.5 1.3 1.6 Healthcare
Australia 1.3 7.3 Daily needs retail
1.7
FY21 FY22
New Zealand FY21 7.1 FY22
$16.5bn $19.8bn 1.1 $16.5bn $19.8bn Large format retail
1.8
Real estate finance
Agriculture
14.2 17.2 4.8 6.0
Other3
Funds Capital
1.5 2.3 Single asset funds 1.7 1.9
1.6 4.7 Unlisted Wholesale
5.7
2.4 Listed REITs
FY21 FY22 8.3 FY21 FY22 Unlisted Retail
7.9 $19.8bn
$16.5bn Multi asset closed 5.5 $16.5bn 6.8 $19.8bn
Listed REITs
ended funds
5.5 Unlisted Institutional
6.8 Multi asset open 4.6 5.4
ended funds
All figures above are in Australian dollars (currency exchange ratio of AU$1.000:NZ$1.1088 as at 30 June 2022).
Numbers presented may not add up precisely to the totals provided due to rounding AUM includes assets
exchanged to be settled, cash and other assets
1. Excludes $0.1bn of US syndicates from Primewest merger
2. Other AUM across tourism, shopping centres and land syndicates in the US, NZ and WA
Centuria ASX:CNI 17Strong organic growth across all real estate sectors
$19.8bn real estate platform1,2
Daily needs Large format Real estate
Office Industrial Healthcare Agriculture
retail (“DNR”) retail (“LFR”) finance
$7.3bn $6.0bn $1.8bn $1.7bn $1.6bn $0.8bn $0.4bn
AUM AUM AUM AUM AUM AUM AUM
(FY21: $7.1bn) (FY21: $4.8bn) (FY21: $1.3bn) (FY21: $1.1bn) (FY21: $1.3bn) (FY21: $0.3bn) (FY21: $0.1bn)
ARTIST IMPRESSION
UNLISTED: LISTED: UNLISTED: UNLISTED: UNLISTED: UNLISTED: UNLISTED:
EXCHANGE TOWER, 2 THE TELSTRA DATA CENTRE LISAROW PLAZA SUNBURY MEDICAL CENTRE, AUBURN MEGA MALL, DANGAR STREET, FLAVORITE GLASSHOUSE
ESPLANADE, PERTH WA COMPLEX, CLAYTON VIC SHOPPING CENTRE NSW SUNBURY VIC SYDNEY NSW WICKHAM, NEWCASTLE NSW WARRAGUL VIC
Note: All figures above are in Australian dollars (currency exchange ratio of AU$1.000:NZ$1.1088 as at 30 June 2022). Numbers presented may not add up precisely to the totals provided due to rounding
1. AUM includes asset exchanged to be settled, cash and other assets
2. Platform total of $19.8bn includes Other AUM of $0.2bn across tourism, shopping centres and land syndicates in the US, NZ and WA Centuria ASX:CNI 18Diversifying fund and capital allocation across Centuria’s platform
DAILY LARGE REAL
SECTOR OFFICE INDUSTRIAL NEEDS HEALTHCARE FORMAT ESTATE AGRICULTURE
• Diversified funds and RETAIL RETAIL FINANCE
capital sources across FUND TYPE / AUM
$7.3 $6.0 $1.8 $1.7 $1.6 $0.8 $0.4
all verticals CAPITAL SOURCE ($BN)1
Unlisted closed
• Opportunities to align ended single &
multi asset1
$8.7 3.4 1.2 1.0 0.8 1.3 0.6 0.2
new funds and capital
with asset classes
Listed
REITs1
$6.8 2.6 4.1 0.1
• Broad capital strategies
and investor profiles
Unlisted
open ended
$2.3 0.2 0.7 0.2 0.7 0.2 0.2 0.2
• Various property
strategies across listed
and unlisted funds Unlisted
$1.9 1.1 0.6 0.2
institutional
1. Platform total real estate AUM of $19.8bn includes Other AUM of $0.2bn across tourism, shopping centres and land syndicates in the US, NZ and WA
Centuria ASX:CNI 19$3.1bn of FY22 gross real estate activity
FY22 gross real estate activity3
$3.1bn
Real estate
Industrial $718m
24 properties
finance
$2.5bn
FY22 exchanged
yet to be settled
Healthcare $670m
49 properties
Real estate
finance
$516m
37 real estate finance loans
Office $423m
5 properties
$1.2bn
$0.9bn
Daily needs retail $389m
5 properties
FY22 exchanged
and settled
$233m
69%
Agriculture
3 properties
unlisted
$145m
31%
Large format
retail
1 2 4 properties listed
FY19 FY20 FY21 FY22
1. Includes $735m of acquisitions exchanged at FY21 that have since settled
2. Includes $2,175m of acquisitions exchanged and settled in FY22, $403m of acquisitions
exchanged in FY22 yet to be settled and $516m of real estate finance transactions
3. Excludes FY22 divestments ($893m)
Centuria ASX:CNI 20High quality long-term income streams
Integrated management capabilities lead to strong asset management success
Top tenants by income (%)1,2 6.1 year weighted avg. lease expiry (WALE) by income1,2
~419
assets1,2 14.5
Government 11.8%
~2,480 Woolworths Limited
11.2
tenants1,2 ASX/NZX Listed 2.5%
7.6
Telstra Corporation Limited 4.8 5.4
1.7% 3.9
ASX/NZX Listed
Coles Group
ASX/NZX Listed 1.6%
Large format Office Daily needs Industrial Healthcare Agriculture
98.2% Wesfarmers
retail retail
avg rent collected over 1.5%
ASX/NZX Listed
entire real estate platform1
(July 2021 – June 2022)
Arnott’s
1.4%
97.2% total occupancy by area1,2
Multinational
100
Visy 98.6
1.3%
Multinational
97.0 97.6 97.7
Healius 1.1%
FY22 leasing terms agreed ASX/NZX Listed Office
93.1
Industrial
Over 503,638sqm General Distributors
1.0%
National Healthcare
469 deals
Daily Needs Retail
12.6% of total platform1 Heritage Lifecare Limited
0.9%
National Large Format Retail Office Daily needs Large format Healthcare Industrial Agriculture
retail retail
1. Tenancy profile is shown aggregated across all funds managed by Centuria and is not representative of any single fund
2. Excludes land, Development assets, US syndicates, Centuria Bass Credit, assets exchanged yet to be settled
Centuria ASX:CNI 21$2.1bn development pipeline to seed funds
FY22 COMMITTED PIPELINE FUTURE PIPELINE TOTAL
SECTOR COMPLETIONS (est. value on completion)2 (est. value on completion)2,3,4 PIPELINE
$M GLA $M GLA $M GLA $M GLA
• Development fees and Office - - 202 25,600 - - 202 25,600
profits provide growing
income Industrial 3 260 308 138,600 - - 308 138,600
Healthcare 37 5,081 613 51,940 375 25,948 988 77,888
Large format retail 7 486 33 8,628 - - 33 8,628
• CNI strategically uses
Other/social
its balance sheet to infrastructure3
36 10,000 163 12,090 371 93,804 534 105,894
seed and expand its
property funds Total1 83 15,827 1,319 236,858 746 119,752 2,065 356,610
FY22 COMMITTED PIPELINE FUTURE PIPELINE TOTAL
• $45.1m carrying value COMPLETIONS (est. value on completion)2 (est. value on completion)2,3,4 PIPELINE
of CNI balance sheet $M GLA $M GLA $M GLA $M GLA
development assets Funds/REITs 47 5,827 1,070 212,172 375 33,808 1,445 245,980
CNI balance sheet3,5 36 10,000 249 24,686 371 85,944 620 110,630
Total1 83 15,827 1,319 236,858 746 119,752 2,065 356,610
Note: All figures above are in Australian dollars (currency exchange ratio of AU$1.000:NZ$1.1088 as at 30 June 2022). Numbers presented may not add up precisely to the totals provided due to rounding
1. Development projects and development capex pipeline, including fund throughs
2. Committed pipeline includes planning commencements and projects under construction
3. Lakeview Queenstown JV reflected at a 25% interest
4. Includes opportunities undergoing development assessments or pre-planning approvals
5. Includes development projects with deposits paid by CNI balance sheet
Centuria ASX:CNI 22Unlisted property: AUM grows to $13.0bn (+18% over FY22)
Between
>12,000 2 - 6 Funds in the top
$620m $33m $21m $179m 32% 56%
Australasian investors FY22 gross equity FY22 recognised FY22 performance FY22 latent underlying Unlisted AUM with no Unlisted AUM with
10 index1 raised performance fees fee cash collected performance fees2 fund expiry review date expiry review dates at
or beyond five years
SECTORS FUNDS
0.4 0.3
0.1 0.4 Office Single asset funds
1.6 2.3
0.3 0.8
1.3 Industrial
Multi asset open
1.6 4.7 Healthcare ended funds
FY21 4.8 FY22 Daily needs retail 1.5 FY21 FY22
Multi asset closed
1.3 $11.0bn $13.0bn Large format retail $11.0bn 2.4 $13.0bn ended funds
1.7 Real Estate Finance
8.3
Agriculture
1.1 7.9
Other
1.7 1.8
1.7
1. At least two funds in the Top 10 in The Property Council of Australia/MSCI Australia Unlisted Retail Quarterly Property Fund Index to 30 June 2022 each
previous quarter for the last twenty-six quarters (overall investment for the twelve months to the end of each quarter)
2. The total amount of latent (unrecognised) future performance fees available to the Group are estimated at $179m. Unrecognised performance fees are
estimated based on current property valuations adopted within each fund and due to inherent uncertainties in relation to the future performance of each
property do not qualify for recognition in the current period under Centuria’s revenue recognition policy and may not entirely eventuate Centuria ASX:CNI 23Generating new unlisted investment opportunities
Strong support from Centuria’s direct unlisted investors, advisers Centuria unlisted funds represented on all major
and domestic bank private wealth divisions for unlisted funds investment platforms used by financial advisers
Single asset initiatives Multi asset closed-end & open-end fund initiatives
$287m $83m $71m $588m $568m $260m $181m $177m
CENTURIA GOVERNMENT CENTURIA NORTHGATE CENTURIA NZ CENTURIA CENTURIA CENTURIA NZ CENTURIA
INCOME PROPERTY FUNDS 25 GRENFELL GERALDTON INDUSTRIAL HEALTHCARE PROPERTY DIVERSIFIED PROPERTY HEALTHCARE PROPERTY AGRICULTURE
NO.1 & NO.2 STREET FUND TRUST FUND FUND1 FUND FUND FUND
• CGPIF1, $133m capital • JV with MA Financial • Closed-end wholesale • Open-end NZ industrial • Open-end healthcare • Open-end diversified • A new multi-asset NZ • Launched CAF fund with
raising oversubscribed fund fund to $588m and 21 fund launched in FY21 fund now $260m and 10 healthcare fund $177m seed asset
• 50% interest for $83.3m direct properties (Warragul Glasshouse)
• $42m capital raise properties now $568m and 24 • Sale and leaseback to
• Centuria’s largest single
• $49m capital raise completed properties • 97% occupancy, 4.9 year Heritage Lifecare • 19-year lease over seed
asset fund launch to date • Strong demand for quality
completed WALE (at June 22) asset to Flavorite Group
• Dominant shopping NZ industrial assets by • 99% occupancy, 10.8 • 100% occupancy,
• CGPIF2 established
• Active asset centre in the area, 49% unlisted investors year WALE (at June 22) 30-year WALE, triple-net • $103m capital raise
management of income derived from lease assets closed
opportunities Coles and Kmart
1. Includes development projects on an accounting carrying value
Centuria ASX:CNI 24Healthcare: Growing in an attractive sector
Targeting $2.0bn of Healthcare AUM by FY23 end
Centuria is an established Themes and megatrends
healthcare real estate manager Emerging Australian real estate sector2
Real estate AUM • Australian private hospital sector worth ~$41bn by 2041
• $1.7bn AUM (+55%) • ~30,000 beds,155 general overnight private hospitals, 35
rehabilitation clinics and 45 specialist mental health facilities
• AUM 81% AU, 19% NZ • Just 280 beds currently under construction (~2,200 private
• c.$1bn total healthcare development pipeline hospital beds required in the next 8 years to meet demand) VERMONT SOUTH MEDICAL CENTRE,
VERMONT SOUTH VIC
Unlisted funds & institutional demand Co-location models
• Morgan Stanley REI partnership grown to $215m AUM1 • PropCo partners and private real estate funding / PPP increasing
• CHPF open ended fund to $568m1 AUM (+200%) • Multi-use healthcare precincts
• $0.9bn AUM, 6 other unlisted healthcare funds • Long leases can support income predictability
BLOOMFIELD MEDICAL CENTRE,
ORANGE NSW
Ageing population and chronic disease occurrence3
Asset Management
• 65+ population forecast to more than double to 7.9m in 2050
• Over 200 healthcare tenants,107 properties
• Life expectancy increase to 88+ years by 2055
• Institutional grade short stay & day hospitals, mental
health facilities, medical & specialist centres and aged • Population with comorbidities increased to 78% (females),
care facilities in NZ 76% (males)
SUNBURY MEDICAL CENTRE,
SUNBURY VIC
1. Includes development projects on an accounting carrying value basis
2. Source: JLL
3. Source: Australian Institute of Health and Welfare – Health Expenditure Australia 2017-18. Figures exclude aged care, 41250DS0007
Gender Indicators, Australia, November 2019, ACFA – Sixth Report on the Funding and Financing of the Aged Care Sector – July 2019,
Australian Bureau of Statistics, Department of Treasury – Treasury projections from 2015 Intergenerational Report: Australia in 2055 Centuria ASX:CNI 25Agriculture: Diversification into a compelling sector
Targeting $0.8bn of Agriculture AUM by FY23 end
Themes and megatrends
Expanding Agriculture
Exports
Potential premium food product growth by 55% to 20301
$0.4bn AUM
7 assets, 3 funds
Supply chain
disruptions highlight access to local agriculture products
$0.2bn AUM
Centuria Agriculture Fund launched, Stable domestic environment FLAVORITE GLASSHOUSE, WARRAGUL VIC
Warragul Glasshouse seed asset Transparent legal tenure and land title systems
Triple net-leases High quality domestic agriculture
provide secure income streams Australian products are highly valued by global markets
Technology and farming advancements
Strong transaction Supporting higher revenues, yields, productivity, reduced waste
pipeline
provides further growth opportunities Protected cropping
Predictable outputs can mitigate key farming risks2
PINEGATTA FARM, DENILIQUIN NSW
1. Source: CSIRO. Growth opportunities for Australian food and agribusiness
2. Source: Protected Cropping Australia
Centuria ASX:CNI 26Centuria Bass Credit: A new unlisted growth opportunity
ARTIST IMPRESSION
$0.8bn 37 loans 91%
Real Estate Finance AUM funded worth $516m of loan volumes secured
(FY21: $0.3bn) by first mortgage security,
gross average LVR of 64%
RICHARDSON STREET, SOUTH PERTH, PERTH WA
Changing market conditions generate new growth opportunities
ARTIST IMPRESSION
Integration Non-banking Debt market Alternative
finance trends non-bank lenders
• Utilising Centuria’s • Predominantly • Margin compression, • Traditional bank
multi-sector real focused on first increasing construction lenders continue to
estate expertise and ranking mortgages costs causing reduce development
distribution developers to consider real estate debt
alternative debt exposure
• Centuria Bass JV set
solutions
to maintain high
margins
HEZLETT ROAD, NORTH KELLYVILLE, SYDNEY NSW
Centuria ASX:CNI 27Institutional AUM growth to $1.9bn (+12% over FY22)
Unlisted mandates and partnerships support new investment opportunities
ARTIST IMPRESSION
$1.9bn
• Morgan Stanley (MSREI) healthcare
partnership grows to $215m AUM1 $1.7bn
• Opportunities to expand healthcare
institutional capital WESTSIDE PRIVATE HOSPITAL, ADENEY PRIVATE HOSPITAL,
TARINGA QLD KEW VIC
• Prime office mandate filled
(2 assets, $634m AUM)
• $930m daily needs retail mandate
(11 assets, $600m AUM) EXCHANGE PLAZA, 140 ST GEORGES TERRACE,
PERTH WA PERTH WA
Family office and select single $0.3bn
asset JV’s broaden capital pools
e.g. Blackrock 140 St George’s
Terrace Fund
OMNIA WOOLWORTHS, WEST VILLAGE SHOPPING
FY20 FY21 FY22 DARLINGHURST NSW CENTRE QLD
1. Includes development projects on an accounting carrying value basis
Centuria ASX:CNI 28Listed property: AUM grows to $6.8bn (+24% over FY22)
ASX: ASX: NZX:
COF Australia’s largest pure-play CIP Australia’s largest pure-play APL Targeting long term
CENTURIA
office REIT CENTURIA
industrial REIT ASSET
total returns
OFFICE REIT INDUSTRIAL REIT PLUS
A quality portfolio of de-centralised, strategically located A quality portfolio of fit for purpose industrial assets,
Completing major council anchored office development
and affordable office space situated in infill locations with close key infrastructure
AUM1
23 18.9% AUM1
$4.1bn
88 16.1% AUM1,2
19.99%
$2.4bn High quality assets CNI co-investment3 High quality assets CNI co-investment $0.3bn CNI co-investment3
Included in the Included in the FY22 Included in the Included in the Munroe Lane development
FY22 acquisitions
S&P/ASX FTSE EPRA acquisitions1
S&P/ASX FTSE EPRA
NZ$147m MID CY23
$285m 300 Index
Nareit Global
Developed Index $647m 200 Index
Nareit Global
Developed Index Est. value on completion
Munroe Lane target completion
79% Portfolio income from government, ASX listed
and multinational tenants 88% Portfolio income from ASX listed, national
and multinational tenants 53%
68% Portfolio income from government, NZX listed
and multinational tenants4
1. Excludes assets exchanged in FY21 that settled in FY22
2. Includes commenced development projects valued on an as if completed basis
3. Includes ownership associates of Centuria Capital Group
4. As at 31 March 2022
Centuria ASX:CNI 29Strategy
SECTION FOUR
LISTED: 101 MORAY STREET, SOUTH MELBOURNE VICStrategy
Retain sole focus on Australasian Real Estate sector
Consolidate position as Grow platform strongly in popular alternative sectors – Healthcare, Agriculture markets
a leading Australasian as well as Credit (Centuria Bass)
funds manager
Vision Leverage our extensive unlisted network and institutional relationships for
unlisted value-add plays in traditional Real Estate sectors
• Continue to grow high-margin unlisted platform in Australia and New Zealand (presently 65% of real estate platform is unlisted)
• Build on diversification into Healthcare and Agriculture through open-ended unlisted funds CAF/CHPF - well supported
by Centuria network. These sectors are attracting strong investor demand
• Increased opportunity-set in credit markets. Centuria Bass credit funds proving popular with distribution
network and the potential for this division is enhanced by tighter traditional credit markets
• Continue to deploy for institutional partnerships in Retail and Healthcare with excess capacity
• Actively seeking value add office opportunities for unlisted network, this is a core Centuria skill set
Execution • Continue to actively manage COF/CIP, capitalise on industrial rental growth potential and repositioning where appropriate
• Growth through select corporate acquisitions where accretive and relate to our Real Estate bias
• Accessing development pipeline to create modern, market-leading assets for Centuria funds
Centuria ASX:CNI 31Appendices
SECTION FIVE
UNLISTED: MOORA ALMOND ORCHARD, RIVERINA NSWCenturia Capital Group
A leading Australasian real estate funds manager
Integrated Active Generating investment
platform management opportunities
Geography Asset Fund types Capital Integrated in-house Balance Platform
classes sources capability sheet support
Listed
Australia Office Listed Funds management Asset management Cash on hand Co-investments
REITS
Unlisted single asset Real estate Property & facilities
New Zealand Industrial Unlisted institutional Capital recycling Fund establishment
funds Transactions management
Multi asset Unlisted Diverse capital
Healthcare Development Leasing Underwriting
Closed-ended funds retail sources
Daily needs Multi asset
Unlisted wholesale Distribution Cornerstones
retail open-ended funds
Large format retail
Real estate
finance
Agriculture
Investment
bonds
Centuria ASX:CNI 33Group AUM movement1 ($bn)
Note: Assets under management (AUM) as at 30 June 2022. All figures above are in Australian dollars (currency exchange ratio of
AU$1.000:NZ$1.1088 as at 30 June 2022). Numbers presented may not add up precisely to the totals provided due to rounding
1. AUM includes assets exchanged to be settled, cash and other assets
2. Includes $735m of acquisitions exchanged at FY21 results that have since settled
Centuria ASX:CNI 34
LISTED: 870 LORIMER STREET, PORT MELBOURNE VICA $19.8bn leading Australasian real estate platform1
WA 22%
95 properties valued at $4,207m
NSW 22%
107 properties valued at $4,184m
NT
VIC 19%
82 properties valued at $3,598m
QLD
WA
QLD 18%
105 properties valued at $3,490m
SA
SA 4%
28 properties valued at $811m
NSW
ACT 2%
5 properties valued at $401m
ACT
TAS 0%
VIC 3 properties valued at $23m
AUCKLAND 9%
37 properties valued at $1,668m
TAS
OTHER NZ 4%
58 properties valued at $808m
Note: All figures above are in Australian dollars (currency exchange ratio of AU$1.000:NZ$1.1088 as at 30 June 2022). Numbers presented may not add up precisely to the totals provided due to rounding
1. Includes asset exchanged to be settled and real estate finance loans by property. Sub totals exclude cash and other assets
Centuria ASX:CNI 35COF: Australia’s largest pure CIP: Australia’s largest domestic APL: Targeting long term total
play office REIT pure play industrial REIT returns
• Delivered FY22 FFO of 18.2 cents per unit • Delivered FY22 FFO of 18.2 cents per unit
• Delivered FY22 Distributions of 16.6 cents per unit • Delivered FY22 Distributions of 17.3 cents per unit
PORTFOLIO SNAPSHOT FY22 FY21 PORTFOLIO SNAPSHOT FY22 FY21 PORTFOLIO SNAPSHOT MAR 22 MAR 21
Number of assets # 23 22 Number of assets # 88 62 Number of assets # 5 5
Book value $m 2,335.2 2,014.3 Book value $m 4,101.0 2,945.0 Book value3 $m 216.4 172.8
WACR % 5.58 5.81 WACR % 4.19 4.54 Occupancy by income % 58 98
NLA sqm 303,138 287,007 GLA sqm 1,330,182 1,083,814 WALE by income yrs 2.2 2.7
Occupancy by gross income % 94.7 93.1 Average asset size sqm 15,156 17,480
WALE by gross income yrs 4.2 4.3 Occupancy by income % 98.8 96.9
Average NABERS energy rating (by value) 2 Stars 4.8 4.7 WALE by income yrs 8.3 9.6
Average NABERS water rating (by value)2 Stars 3.9 3.2
Buildings generating solar power # 6 6
Average building age (by value) yrs 16 16
FY22 tenants by income FY22 tenants by income MAR 22 tenants4 by income
11% Auckland Council
26% The Warehouse Group
27% ASX listed 22% ASX listed 11% Countdown
23% Government 1% Government 4% Westpac
11% Listed multinational 5% Listed multinational 3% Better Health
18% Multinational 20% Multinational 3% Aviva
5% National 40% National 2% Mt Roskill 24/7 Ltd
16% Other 12% Other 2% Stoddard Rd Pharmacy
2% Bargain Chemist
3% Restaurant Brands
33% Other (multiple tenants)
1. Includes acquisitions exchanged and not yet settled
2. By value, excluding non-rated assets
3. Carrying values include work in progress (WIP) relating to costs incurred in relation to current and future development work which were not included in the inputs to the to the latest independent valuations as at 31 March 2022
4. Excludes 6-8 Munroe Lane, Albany, NZ
Centuria ASX:CNI 36Centuria LifeGoals
HY22 FLOWS FY22
FY22 FY21
ASSET/S UNDER MANAGEMENT CHANGE
$0.8bn ($m) ($m)
(%) APPLICATIONS ($M) REDEMPTIONS ($M)
AUM Prepaid funeral plans (Guardian)2 536.6 582.0 -7.8% 26.6
0.0
-50.2
-0.2
Capital guaranteed (Centuria Life)3 0.0 140.9 -100.0%
Unitised bonds (Centuria Life)3 230.7 141.6 62.9% 8.1 -41.9
Centuria LifeGoals 39.6 27.9 41.9% 21.0 -4.4
8.6% TOTAL 806.9 892.4 -9.6% 55.7 -96.6
total Australian investment
bond market share1
Centuria life fund managers
Approved by a wide
range of dealer groups
nationally
31 fund options
Including 3 ESG fund options
1. QDS report 30 March 2022
2. Centuria Life Limited (CLL) is the key service provider to Over Fifty Guardian Friendly Society
3. As part of a major restructure the Capital Guaranteed Bonds became Unitised Bonds following a policyholder vote and APRA approval
Centuria ASX:CNI 37Reconciliation of statutory profit to operating profit
FY22 ($m) FY21 ($m)
Statutory net (loss)/profit after tax (37.4) 149.6
Statutory EPS (cents)1 (4.8) 24.6
ADJUSTED FOR NON-OPERATING ITEMS
(Gain) on fair value movements in derivatives and investments 167.1 (79.8)
Transaction and other costs 4.4 4.5
Seed capital write back (0.7) -
(Profit) attributable to controlled property funds (13.9) (12.4)
Eliminations between the operating and non-operating segment 4.7 6.7
Equity accounting adjustments 3.1 0.2
Tax impact of above non-operating adjustments (12.8) (0.8)
Capitalised borrowing costs write-off - 2.2
Operating net profit after tax2 114.5 70.2
Operating EPS (cents)3 14.5 12.0
UNLISTED: OMNIA SHOPPING CENTRE, POTTS POINT NSW
1. Attributable to securityholders
2. Operating NPAT of the Group comprises of the results of all operating segments and excludes non-operating items such as transaction costs, mark to market movements on
property and derivative financial instruments, the results of Benefit Funds, Controlled Property Funds and share of equity accounted net profit in excess of distributions received
3. Operating EPS is calculated based on the Operating NPAT of the Group divided by the weighted average number of securities
Centuria ASX:CNI 38Co-investments reconciliation
CARRYING VALUE DISTRIBUTION
30 JUNE 22 INCOME FY22
CARRYING DISTRIBUTION
VALUE INCOME FY21
Strong alignment to Centuria’s
CO-INVESTMENTS FUND TYPE ($M) ($M) 30 JUNE 21($M) ($M) listed REITs
Centuria Industrial REIT (ASX: CIP)1 Listed 284.1 17.4 345.0 14.4
CNI is the largest unitholder of
Centuria Office REIT (ASX: COF)1 Listed 154.9 15.1 189.3 13.1
Asset Plus Ltd. (NZX: APL)1 Listed 17.3 0.9 21.9 1.1
Properties held for sale N/A 89.1 1.3 - - CIP COF APL
Properties held for development N/A 45.1 - 53.7 - 15.92%1 15.25%1 19.99%1
Centuria NZ Industrial Fund (CNZIF) Open-ended 39.9 1.7 48.6 1.0
multi asset
Centuria 111 St Georges Terrace Fund Single asset 31.8 2.5 31.0 2.3
Centuria Diversified Property Fund (CDPF) Open-ended 39.5 2.3 28.1 1.5
multi asset Properties held for development
Centuria Healthcare Direct Medical Fund No. 2 Multi asset 25.5 1.2 16.4 0.3 generate no distribution income
Centuria Agricultural Fund Open-ended 35.4 1.8 - -
multi asset
Prime Healthcare Holding Trust Multi asset 21.5 - - - Projects include
Matrix Trust Multi asset 11.1 0.3 5.9 - • Man Street, Queenstown
Primewest Property Income Fund Open-ended - - 15.6 - • Cook Street, Auckland
multi asset • Lakeview, Queenstown
Other unlisted real estate and debt funds Various 48.6 2.3 49.6 2.7 • Cudgen Road, Cudgen
SUB-TOTAL 843.8 46.8 805.1 36.4 • Young Street, Gosford
Capital adjustment2 (139.6) - 84.3
TOTAL 843.8 (92.8) 805.1 120.7
Note: All figures above are in Australian dollars (currency exchange ratio of AU$1.000:NZ$1.1088 as at 30 June 2022). Numbers presented may not add up precisely to the totals provided due to rounding
1. All information in relation to the financial contribution of the Group's co-investment stakes in COF, CIP and APL exclude interests held through Benefit Funds
2. Comprises of non-operating fair value gains or losses
Centuria ASX:CNI 39Definitions
Operating Segments: Group has six reportable operating segments. AUM: Assets under management IRR: Internal Rate of Return
These reportable operating segments are the divisions which report
CAGR: Compound annual growth rate NPAT: Net Profit After Tax
to the Group’s Chief Executive Officers and Board of Directors for the
purpose of resource allocation and assessment of performance. The CDPF: Centuria Diversified Property Fund comprises the Centuria NTA: Net Tangible Assets
reportable operating segments are: Diversified Property Fund ARSN 611 510 699 and its subsidiaries.
REIT: Real Estate Investment Trust
The Responsible Entity of CDPF is Centuria Property Funds Limited
• Property Funds Management: Management of listed and unlisted ACN 086 553 639CIP: WACR: Weighted Average Capitalisation Rate
property funds
Centuria Industrial REIT comprises the Centuria Industrial REIT WALE: Weighted Average Lease Expiry
• Developments: Completion of structured property developments ARSN 099 680 252 and its subsidiaries. The Responsible Entity of
which span sectors ranging from Commercial Office, Industrial and
CIP is Centuria Property Funds No. 2 Limited ACN 133 363 185
Health through to Affordable Housing and Residential Mixed Use
CHPF: Centuria Healthcare Property Fund comprises the Centuria
• Property and Development Finance: Provision of real estate Healthcare Property Fund ARSN 638 821 360 and its subsidiaries.
secured non-bank finance for development projects, bridge finance
The Responsible Entity of CHPF is Centuria Property Funds No.2
and residual stock
Limited ACN 133 363 185COF:
• Investment Bonds Management: Management of the Benefit Centuria Office REIT comprises the Centuria Office REIT ARSN
Funds of Centuria Life Limited and management of the Over Fifty
124 364 718 and its subsidiaries. The Responsible Entity of COF is
Guardian Friendly Society Limited. The Benefit Funds include a
Centuria Property Funds Limited ACN 086 553 639
range of financial products, including single and multi-premium
investments CNI, CCG or the Group: Centuria Capital Group comprises of
Centuria Capital Limited ABN 22 095 454 336 (the ‘Company’) and
• Co-investments: Direct interest in property funds and other liquid its subsidiaries and Centuria Capital Fund ARSN 613 856 358
investments
(‘CCF’) and its subsidiaries. The Responsible Entity of CCF is
• Corporate: Overheads supporting the Group’s operating segments Centuria Funds Management Limited ACN 607 153 588, a wholly
owned subsidiary of the Company
Non-operating segments: Non-operating items comprises
transaction costs, mark-to-market movements on property and CPFL: Centuria Property Funds Limited
derivative financial instruments, and all other non-operating activities.
CPF2L: Centuria Property Funds No. 2 Limited
Includes Benefit Funds and Controlled Property Funds. Represents
the operating results and financial position of the Benefit Funds DPS: Distribution per stapled security
which are required to be consolidated in the Group’s financial
EPS: Earnings per stapled security
statements in accordance with accounting standards
Centuria ASX:CNI 40Disclaimer
This presentation has been prepared by Centuria Capital Limited and Centuria Funds Management Limited as responsible entity of Centuria Capital Fund (together the stapled listed entity CNI).
Centuria Property Funds Limited (ABN 11 086 553 639, AFSL 231 149) ('CPFL') and Centuria Property Funds Management No. 2 Limited (ABN 38 133 363 185, AFSL 340 304) ('CPF2L') are fully owned subsidiaries
of CNI. CPF2L is the responsible entity for the Centuria Industrial REIT (ARSN 099 680 252) (ASX: CIP). CPFL is the responsible entity for the Centuria Office REIT (ARSN 124 364 718) (ASX: COF), the Centuria
Diversified Property Fund (ARSN 611 510 699) and the rest of Centuria's unlisted property funds. Investment in Centuria's property funds is subject to risks that are set out in the Product Disclosure Statement ('PDS')
for the fund. The PDS for any open fund is made available on Centuria’s website (centuria.com.au). Investors should read the PDS in full before making a decision to invest.
Past performance is not a guarantee of future performance.
This presentation is provided for general information purposes only. It is not a prospectus, product disclosure statement, pathfinder document or any other disclosure document for the purposes of the Corporations
Act and has not been, and is not required to be, lodged with the Australian Securities & Investments Commission. It should not be relied upon by the recipient in considering the merits of CNI or the acquisition of
securities in CNI or its subsidiaries. Nothing in this presentation constitutes investment, legal, tax, accounting or other advice and it is not to be relied upon in substitution for the recipient’s own exercise of
independent judgment with regard to the operations, financial condition and prospects of CNI.
The information contained in this presentation does not constitute financial product advice. Before making an investment decision, the recipient should consider its own financial situation, objectives and needs, and
conduct its own independent investigation and assessment of the contents of this presentation, including obtaining investment, legal, tax, accounting and such other advice as it considers necessary or appropriate.
This presentation has been prepared without taking account of any person’s individual investment objectives, financial situation or particular needs. It is not an invitation or offer to buy or sell, or a solicitation to invest
in or refrain from investing in, securities in CNI or any other investment product. The information in this presentation has been obtained from and based on sources believed by CNI to be reliable. To the maximum
extent permitted by law, CNI and the members of the Centuria Capital Group make no representation or warranty, express or implied, as to the accuracy, completeness, timeliness or reliability of the contents of this
presentation. To the maximum extent permitted by law, CNI does not accept any liability (including, without limitation, any liability arising from fault or negligence) for any loss whatsoever arising from the use of this
presentation or its contents or otherwise arising in connection with it. This presentation may contain forward-looking statements, guidance, forecasts, estimates, prospects, projections or statements in relation to future
matters (‘Forward Statements’). Forward Statements can generally be identified by the use of forward looking words such as “anticipate”, “estimates”, “will”, “should”, “could”, “may”, “expects”, “plans”, “forecast”,
“target” or similar expressions. Forward Statements including indications, guidance or outlook on future revenues, distributions or financial position and performance or return or growth in underlying investments are
provided as a general guide only and should not be relied upon as an indication or guarantee of future performance. No independent third party has reviewed the reasonableness of any such statements or
assumptions.
Neither CNI nor any member of Centuria Capital Group represents or warrants that such Forward Statements will be achieved or will prove to be correct or gives any warranty, express or implied, as to the accuracy,
completeness, likelihood of achievement or reasonableness of any Forward Statement contained in this presentation. Except as required by law or regulation, CNI assumes no obligation to release updates or
revisions to Forward Statements to reflect any changes.
The reader should note that this presentation may also contain pro-forma financial information. Distributable earnings is a financial measure which is not prescribed by Australian Accounting Standards (”AAS”) and
represents the profit under AAS adjusted for specific non-cash and significant items. The Directors of CFML consider that distributable earnings reflect the core earnings of the Centuria Capital Fund. All dollar values
are in Australian dollars ($ or A$) unless stated otherwise.
Centuria ASX:CNI 41AUSTRALIA Sydney Head Office Melbourne Office (02) 8923 8923 (03) 9616 6500 Level 41, Chifley Tower Level 32 2 Chifley Square 120 Collins Street Sydney NSW 2000 Melbourne VIC 3000 Brisbane Office Perth Office (07) 3905 7000 (08) 9321 7133 Level 2 Level 1 348 Edward Street 307 Murray Street Brisbane QLD 4000 Perth WA 6000 NEW ZEALAND Auckland Office +64 (9) 300 6161 Level 2, Bayleys House, 30 Gaunt Street, Wynyard Quarter Auckland 1010 simpleicon.com
You can also read