Case Study: "ACE Tablets" - Prepared by CMC IM Working Group Version 2.0 - CMC-IM Working Group
←
→
Page content transcription
If your browser does not render page correctly, please read the page content below
CMC-IM Working Group

 1
 2
 3
 4
 5
 6
 7
 8
 9
10
11
12
13
14
15
16
17
18
19
20
21
22
                  Pharmaceutical Development
23
24
                   Case Study: “ACE Tablets”
25
26
27
28
29                             Prepared by CMC‐IM Working Group
30                                       March 13, 2008
31
                                          Version 2.0

             Intended for Distribution

     ACE tablets V2.0                       Page 1                      March 13, 2008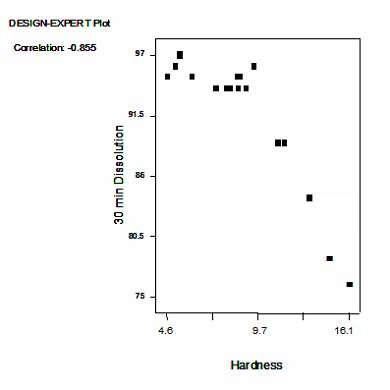
CMC-IM Working Group

32
33                                                             CONTENTS
34

35   Foreword ............................................................................................................................. 8

36   Acknowledgements ............................................................................................................ 9

37   1. Report on the Pharmaceutical Development of Acetriptan Tablets ....................... 10

38      1.1 Introduction and Overview ................................................................................... 10

39      1.2 Target Product Profile ........................................................................................... 10

40      1.3 Formulation and Pharmaceutical Manufacturing Selection ............................. 12

41      1.4 Control Strategy ..................................................................................................... 13

42   2. Selection of the Components of the Drug Product .................................................... 14

43      2.1 Drug Substance ...................................................................................................... 14

44      2.2 Excipients ................................................................................................................ 14

45   3. Drug Product Formulation Development .................................................................. 16

46      3.1. Formulation Development Overview .................................................................. 16

47      3.2 Development of a Discriminatory Dissolution Method ..................................... 17

48      3.3. Biopharmaceutics and Pharmacokinetics of ACE ............................................. 18

49      3.4 Prototype Formulation and Process Selection .................................................... 18

50          3.4.A Formulation Component Level Definition Study........................................... 20

51          3.4.B API Particle Size and Magnesium Stearate Interaction Study...................... 25

52      3.5 Summary of Formulation Component Studies ................................................... 28

53   4. Manufacturing Process Development ........................................................................ 29

54      4.1 Overview ................................................................................................................ 29

55          4.1.A Summary of the selected process .................................................................... 29

56      4.2 Process Optimization – Blending Unit Operation.............................................. 31

57          4.2.A Method for Determining Blend Homogeneity ................................................ 31

     ACE tablets V2.0                                               Page 2                                          March 13, 2008
CMC-IM Working Group
58 4.2.B Critical Parameters Affecting the blend homogeneity ................................... 32
59 4.2.C Scale-up of the Blending Process ................................................................... 35
60 4.2.D Conclusion for Blending ................................................................................. 36
61 4.3 Process Optimization – Roller Compaction Unit Operation ............................ 37
62 4.3.A Introduction ..................................................................................................... 37
63 4.3.B Failure Modes, Effects and Criticality Analysis (FMECA) approach to
64 Roller Compaction .................................................................................................... 38
65 4.3.C Initial Quality Risk Assessment (QRA-1) for the roller compaction and
66 milling stages ............................................................................................................. 38
67 4.3.D Process Development Work ............................................................................ 40
68 4.3.E DoE-2: Roller compaction response surface ................................................ 46
69 4.3.F Roller Compaction and Milling Conclusions ................................................. 51
70 4.3 G Second Risk Assessment for Compaction and Milling (QRA-2) ................... 53
71 4.4 Process Optimization – Lubrication Unit Operation ........................................ 55
72 4.4 A Lubrication Blending ...................................................................................... 55
73 4.5 Process Optimization – Tablet Compression Unit Operation .......................... 58
74 4.5.A Introduction ..................................................................................................... 58
75 4.5.B Compression DoE 2 ......................................................................................... 61
76 4.5.C Compression DoE 3 ......................................................................................... 68
77 4.6 The In vivo investigation ...................................................................................... 75
78 4.6.A Rationale for study ACEPK0015 .................................................................... 75
79 4.6.B Clinical pharmacokinetic study (ACEPK0015).............................................. 75
80 4.6.C Results .............................................................................................................. 76
81 4.6.D Exploration of an in vitro-in vivo correlation for ACE tablets ..................... 78
82 4.7 Summary Control Strategy for the ACE Tablets Manufacturing Process ...... 79
83 4.7.A Overview........................................................................................................... 79
ACE tablets V2.0 Page 3 March 13, 2008CMC-IM Working Group
84 4.7.B Unit Operation Control Strategy ..................................................................... 82
85 4.7.C Control of Drug Product Critical Quality Attributes ..................................... 85
86 4.7.D Control Strategy Conclusion........................................................................... 87
87 5. Container Closure System ........................................................................................... 87
88 6. Microbiological Attributes. ........................................................................................ 87
89 7. Summary of the Manufacturing Procedure .............................................................. 88
90 7.1 Manufacturing Formula for ACE 20 mg Tablets .............................................. 88
91 7.2 Description of Manufacturing Process and Process Controls for ACE, IR
92 Tablets ........................................................................................................................... 89
93 7.2.A Process Flow Diagram ............................................................................ 89
94 7.3 Description of Manufacturing Process................................................................. 89
95 7.4 Primary packaging................................................................................................. 91
96 8. Control of Critical Steps and Intermediates for ACE Tablets ............................... 91
97 8.1 Control of Drug Product ....................................................................................... 91
98 8.1.A Specification for ACE 20 mg Tablets ......................................................... 91
99
ACE tablets V2.0 Page 4 March 13, 2008CMC-IM Working Group
100 LIST OF FIGURES
101
102 Figure 1: Plot of % Target Tablet Weight vs % Label Claim for Individual Tablets Tested
103 from Formulation Definition Study ................................................................................... 22
104 Figure 2: Interaction profile for Hardness Response at Fixed Compression Pressure. .... 22
105 Figure 3: Interaction Profile for Dissolution Response at a Set Target Tablet Hardness of
106 12kP. .................................................................................................................................. 23
107 Figure 4: Contour plot of Dissolution response for 10% drug load at a set Target Tablet
108 Hardness of 12kP ............................................................................................................... 24
109 Figure 5: Interaction profile for Weight %RSD Response at Fixed Compression Pressure.
110 ............................................................................................................................................ 25
111 Figure 6: Interaction profile for Hardness Response at Fixed Compression Pressure. .... 26
112 Figure 7: Interaction profile for Tablet Weight % RSD Response at Fixed Compression
113 Pressure. ............................................................................................................................. 27
114 Figure 8: Contour Plot of Dissolution at a Set Target Tablet Hardness of 12kP. ............. 28
115 Figure 9: Manufacturing Process Flow for ACE tablets .................................................... 30
116 Figure 10: Correlation of Blend NIR CV with Tablet Content Uniformity RSD .............. 32
117 Figure 11: Cause and Effect Diagram for Blend Uniformity ...................................... 32
118 Figure 12: Blend Contour plots.......................................................................................... 34
119 Figure 13: NIR output of DoE Blending Experiments (Representative Results) .............. 34
120 Figure 14: Blending Control Data...................................................................................... 36
121 Figure 15: Process Map for Roller Compaction and Milling ............................................ 38
122 Figure 16: Initial Quality Risk Assessment (QRA-1) for the Roller Compaction and
123 Milling stages ..................................................................................................................... 39
124 Figure 17: Half-normal Plot and ANOVA for Effects on Ribbon Density ....................... 42
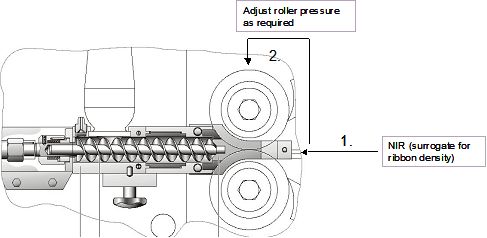
125 Figure 18: Relationship between Roller Pressure and Ribbon Density ............................. 43
126 Figure 19: Half-normal Plot and ANOVA for Effects on GSA......................................... 44
127 Figure 20: The Effects of Mill Screen Size and Mill Speed (600 or 1200 rpm) on GSA.. 45
128 Figure 21: Half-normal plot and ANOVA for effects on tablet dissolution ...................... 46
129 Figure 22: Contour plot for API particle size and roller pressure versus tablet dissolution
130 (% at 30 mins) with a 1% magnesium stearate level ........................................................ 47
131 Figure 23: Contour plot for API particle size and roller pressure versus tablet dissolution
132 (% at 30 min) with a 1.5% magnesium stearate level ........................................................ 48
133 Figure 24: Contour plot for API particle size and roller pressure versus tablet dissolution
134 (% at 30 min) with a 2% magnesium stearate level ........................................................... 48
135 Figure 25: Confirmed Linear Relationship between Roller Pressure and Ribbon Density 49
136 Figure 26: Description of Parameters associated with Roller Compactor ......................... 50
137 Figure 27: Scale independent Relationship Illustration ..................................................... 51
138 Figure 28: Roller Compaction: Summary of Cause and Effect Relationships identified
139 from Process Development Studies ................................................................................... 52
140 Figure 29: NIR in-process control feedback loop .............................................................. 53
141 Figure 30: Final Risk Assessment (QRA-2) for the Roller Compaction and Milling Stages
142 ............................................................................................................................................ 54
143 Figure 31: Effect of Blending Parameters on Tablet Hardness ......................................... 57
144 Figure 32: Effect of Blending Parameters on Drug Release at 30min ............................... 57
145 Figure 33: ACE Tablet Compression Process Flow .......................................................... 59
ACE tablets V2.0 Page 5 March 13, 2008CMC-IM Working Group
146 Figure 34: IPO Diagram for ACE Compression Step ........................................................ 60
147 Figure 35: Effect of Compression Force on Tablet Hardness............................................ 63
148 Figure 36: Effect of Compression Force on Tablet Dissolution at 15min ......................... 65
149 Figure 37: Correlation between Tablet Hardness and Dissolution at 15 Minutes ............. 65
150 Figure 38: Effect of Compression Force on Tablet Dissolution at 30min ......................... 66
151 Figure 39: Correlation between Tablet Hardness and Dissolution at 30 Minutes ............ 66
152 Figure 40: Correlation between Disintegration Time and Dissolution at 30min ............... 67
153 Figure 41: Example Plots of Dissolution versus Hardness for Different Tablet Variants . 70
154 Figure 42: Tablet Content Uniformity: data plot for one of six tablet batches .................. 71
155 Figure 43: Plot of %Target Weight versus % label Claim................................................. 72
156 Figure 44: Representation of Proven Acceptable Ranges for Compression ..................... 73
157 Figure 45: Average dissolution of all 5 tablet variants in the 1% SLS method ................. 77
158 Figure 46: Average plasma concentration-time profiles (0 to 48 hrs) for 20 mg ACE IR
159 variants and oral solution (geomean, n=12) ....................................................................... 79
160 Figure 47: Control Strategy for CQAs for ACE Tablets ................................................... 82
161 Figure 48: Control Strategy for Blending .......................................................................... 83
162 Figure 49: Control Strategy for Roller Compaction .......................................................... 84
163 Figure 50: Control Strategy for Compression .................................................................... 85
164
165
ACE tablets V2.0 Page 6 March 13, 2008CMC-IM Working Group 166 167 LIST OF TABLES 168 169 Table 1:Target Product Profile........................................................................................... 11 170 Table 2: Risk Assessment to Identify Variables Potentially Impacting Product Quality .. 12 171 Table 3: Potential impact of API Attributes on Drug Product Attributes .......................... 14 172 Table 4: Excipients in ACE tablets .................................................................................... 15 173 Table 5: Potential impact of Excipients on Drug Product CQAs ...................................... 16 174 Table 6: Formulation Composition Risk Assessment ........................................................ 20 175 Table 7: Risk Matrix for Drug Product CQAs for each unit operation ............................. 30 176 Table 8: Process Parameter Ranges for Blending .............................................................. 31 177 Table 9: Risk Matrix Table for Blending Unit Operation.................................................. 33 178 Table 10: Summary of Scale Up Blending Parameters ..................................................... 35 179 Table 11: Input attributes for Blending Operation ............................................................. 36 180 Table 12: Risk Matrix Table for Blending Unit Operation after Controls ........................ 37 181 Table 13: Process Parameter Targets for Lubrication........................................................ 55 182 Table 14: Cause and Effect Matrix Risk Analysis for Lubrication ................................... 55 183 Table 15: DoE Results: AQL Observations as a Response to Fill Ratio and Number of 184 Revolutions (
CMC-IM Working Group

209

210   Foreword
211
212   The last decade has seen a significant transformation in pharmaceutical quality regulation
213   from an empirical process to a more science and risk based approach. This case study is
214   an extremely important document for helping guide FDA and the industry toward the
215   “desired state” of pharmaceutical quality envisioned for the 21st Century. It is through
216   this and similar documents that we can determine how best to implement the principles of
217   ICH Q8, Q9, and Q10 to meet the requirements of this new regulatory paradigm.
218
219   I believe this case study, and others like it, will provide a foundation for discussion with
220   our scientific and regulatory constituents within industry and with our global regulatory
221   colleagues in other agencies. Such documents are necessary to enable dialogue and
222   understanding of what we all mean and expect from the ICH paradigms, and to ensure an
223   appropriate framework for future regulatory processes, including both review and
224   inspection of all pharmaceuticals. Not only does this case study provide a basis for
225   understanding and commitment to the process, it also helps identify the opportunities that
226   can be gained through the enhanced scientific experience and knowledge sharing.
227
228   I want to personally thank Conformia, FDA’s CRADA partner, the CMC-IM Working
229   Group team that Conformia convened and all of those individuals who contributed to
230   creating this Pharmaceutical Development Case Study on ACE Tablets . I truly believe
231   that it will be invaluable to all of us in moving forward in implementing a modern
232   approach to the regulatory processes. This case study is a perfect example of how
233   scientific collaboration can lead to synergism across our regulatory programs in order to
234   better serve the public.
235
236   Helen Winkle, Director, Office of Pharmaceutical Sciences, CDER, FDA
237
238

      ACE tablets V2.0                           Page 8                           March 13, 2008
CMC-IM Working Group
239 Acknowledgements
240
241 The acetriptan tablets (ACE) case study that follows is the first deliverable from
242 an industry led, not-for profit, working group focused on two areas of
243 implementation around the ICH Quality vision: track 1) a chemistry,
244 manufacturing and controls focus and track 2) an information management /
245 knowledge management focus. This group, called the CMC-IM Working group, is
246 comprised of Abbott Laboratories (Abbott), AstraZeneca (AZ), Conformia, Eli
247 Lilly and Company (Eli Lilly), GlaxoSmithKline (GSK) and IBM Global Business
248 Services (IBM).
249
250 Special thanks are due to the CMC-IM Working Group members who helped
251 author “ACE”: Liam Feely (Abbott), Ken Cline (Abbott), Steve Laurenz (Abbott)
252 Shuhong Zhang (Abbott), Julie Garren (Abbott), Mike Hannay (AZ), Anna Ahern
253 (AZ) Bryan Mobbs (AZ), John Smart (AZ), Liuda Shtohryn (AZ), John Berridge
254 (Conformia), Vineet Gulati (Conformia), Anjali Kataria (Conformia), Ken Morris
255 (Conformia), Joe Prang (Conformia), Sam Venugopal (Conformia), David
256 Maclaren (Eli Lilly), Jeff Hofer (Eli Lilly), Eric Jensen (Eli Lilly), Lindsay Wylie
257 (GSK), Norma Collinsworth (GSK), Jo Craig (GSK), Vance Novak (GSK), Ray
258 Stevens (GSK), Richard Young (GSK), Dennis Bell (IBM), Marc Weisenberg
259 (IBM) and Charlie Honke (IBM).
260
261 We also acknowledge EFPIA’s Examplain mock P2 discussion paper, which gave
262 us the ability to see that a more comprehensive case study could be used to
263 improve transparency and change the nature of dialogue between industry
264 and regulators.
265
266 Anjali Kataria, Chief Marketing Officer and Founder of Conformia
267 Principal Investigator, FDA-Conformia CRADA
268
ACE tablets V2.0 Page 9 March 13, 2008CMC-IM Working Group
269 1. Report on the Pharmaceutical Development of Acetriptan
270 Tablets
271 1.1 Introduction and Overview
272
273 This report presents a summary of the pharmaceutical development of acetriptan (“ACE”)
274 tablets. It emphasizes a science and risk-based approach to product and process
275 development, and presents findings as a knowledge-based report. Where relevant,
276 supporting data have been summarized in appropriate tables or illustrations
277
278 The scientific approach used begins with identification of the desired dosage form and
279 performance attributes through the target product profile. From this target product profile,
280 an initial list of critical quality attributes was developed. A risk assessment was
281 undertaken to identify the variables and unit operations which are most likely to impact
282 the critical quality attributes. This was then used to focus development activities on
283 potential high risk areas. A risk assessment, starting with the physico-chemical
284 characteristics of the API, led to the identification of a viable formulation and
285 manufacturing approach. Formulation development involved the use of prior knowledge
286 and structured experimentation to investigate the relationship between formulation
287 component levels, API attributes and the drug product quality attributes. An interaction
288 between API particle size and magnesium stearate level was demonstrated and acceptable
289 formulation component levels and API particle size ranges were identified. Development
290 of the manufacturing process focused on the unit operations posing greatest potential risk
291 to drug product quality. Using prior knowledge, models, extrapolation and risk assessment
292 processes, the material attributes and process parameters, which could have an impact
293 upon final product quality, were identified. For each unit operation experimentation was
294 undertaken to define the relationship between the input attributes, process parameters,
295 output attributes and final drug product quality. The intermediate critical quality
296 attributes, operating conditions and a control strategy were defined to mitigate risk and
297 ensure final product quality. An in-vivo study was then conducted to compare formulation
298 and manufacturing variables. This study revealed that the dissolution test procedure
299 provided excellent prediction of biopharmaceutical performance, but that the initial
300 acceptance criterion needed to be modified. Based on the pharmaceutical development
301 work and in-vivo results, a design space and science and risk-based approaches to
302 formulation component level adjustment, scale-up, site transfers and ‘real time release’
303 are proposed based on the enhanced product and process understanding.
304 1.2 Target Product Profile
305 ACE tablets are being developed for the treatment of migraine. The intent is to develop a
306 rapid onset therapy which will provide relief of the symptoms of migraine.
307
308 The pharmaceutical target profile for acetriptan is a safe efficacious convenient dosage
309 form, preferably a tablet, that will facilitate patient compliance. The tablet should be of an
ACE tablets V2.0 Page 10 March 13, 2008CMC-IM Working Group
310 appropriate size, with a single tablet per dose. The manufacturing process for the tablet
311 should be robust and reproducible, and should result in a product that meets the
312 appropriate drug product critical quality attributes, for example identity, assay,
313 appearance, chemical and microbiological purity, disintegration and/or dissolution as well
314 as content uniformity. The drug product should be packaged in a container closure system
315 that will provide adequate protection from moisture vapour, protection through
316 distribution and use as well as convenience of use for the patient.
317
318 A Target Product Profile is presented in the Table 1: below. From the profile, the initial
319 Critical Quality Attributes which were used to define satisfactory quality were identified.
320
321 Table 1:Target Product Profile
322
Quality Target Criticality
Attribute
Dosage form Tablet, maximum weight Not applicable
200mg
Potency 20 mg Not applicable
Pharmacokinetics Immediate release enabling Related to dissolution
Tmax in 2 hours or less
Appearance Tablet conforming to Critical
description shape and size
Identity Positive for acetriptan Critical
Assay 95 – 105% Critical
Impurities ACE12345 NMT 0.5%, Critical
other impurities NMT 0.2%,
total NMT 1%
Water NMT 1% Not critical – API not sensitive
to hydrolysis
Content Meets USP Critical
Uniformity
Resistance to 5-12kP Not critical since related to
Crushing dissolution
(Hardness)
Friability NMT 1.0% Not critical
Dissolution Consistent with immediate Critical
release, e.g., NLT 75% at
30mins
Disintegration NMT 15mins Not critical, a precursor to
dissolution
Microbiology If testing required, meets USP Critical only if drug product
criteria supports microbial growth
323
ACE tablets V2.0 Page 11 March 13, 2008CMC-IM Working Group
324 1.3 Formulation and Pharmaceutical Manufacturing Selection
325 The formulation type chosen was an oral standard release tablet, in consideration of the
326 known PK characteristics of the molecule. A rapid onset is desirable for the treatment of
327 migraine and a Tmax of less than 2 hours was desired, and subsequently achieved, with this
328 formulation.
329
330 A roller compaction granulation process was chosen based on prior scientific knowledge
331 of products with similar physical and chemical properties, and available technologies and
332 equipment. Factors that influenced the selection of a roller compaction process were: 1)
333 degradation of the drug on exposure to heat precluding drying following wet granulation,
334 and 2) poor flow properties precluding direct compression. Thermal degradation also
335 precluded drying following film coating. Roller compaction was also chosen in the
336 expectation of its meeting the expectation of its suitability for operating with excipients
337 which are compatible with acetriptan, active pharmaceutical ingredient (API)
338 processability and API stability requirements during manufacture, and since it should
339 result in a tablet that will have a shelf life of at least 2 years.
340
341 The development of ACE tablets and the associated manufacturing process used prior
342 knowledge from previous products and development projects. A risk analysis, in
343 accordance with ICH Q9, was used to establish which variables and unit operations were
344 likely to have the greatest impact on product quality. This initial risk assessment is shown
345 in Table 2 below.
346
347 Table 2: Risk Assessment to Identify Variables Potentially Impacting Product
348 Quality
349
350
351 The boxes shaded green were concluded, through prior knowledge, to present low
352 risk to the product critical quality attributes. The red boxes represent potential risks to the
353 product and formed areas for further study during development.
354
355 The proposed commercial formulation is an immediate release tablet. Only one tablet
356 strength is proposed for commercialization, a 200 mg tablet containing 20 mg of
357 acetriptan. Each tablet contains the following excipients: microcrystalline cellulose,
358 lactose monohydrate, croscarmellose sodium, magnesium stearate and talc. The
359 manufacturing process involves a preblending step, roller compaction of the acetriptan
ACE tablets V2.0 Page 12 March 13, 2008CMC-IM Working Group
360 with microcrystalline cellulose, croscarmellose sodium, magnesium stearate and lactose
361 monohydrate, then milling to produce granules before blending with magnesium stearate,
362 and talc. This is then followed by compression on a rotary tablet press. ACE tablets are
363 proposed to be supplied as white, biconvex, round tablets containing 20 mg of acetriptan
364 identified with “ACE” and “20” debossed on one side, in cartons containing a blister pack
365 of 6 tablets, or in polypropylene bottles containing 10 tablets. Further information on the
366 packaging is provided under Container Closure System, Section 5.
367
368 For the unit operations with the potential to impact quality, a further risk assessment was
369 used to identify process parameters and materials’ attributes that could impact product
370 quality. Experimental studies were then defined and executed to develop additional
371 scientific knowledge and understanding, to allow appropriate controls to be developed and
372 implemented thereby mitigating the risk to quality.
373 1.4 Control Strategy
374
375 Process understanding developed around ACE tablets demonstrated that blending, roller
376 compaction and compression are the critical unit operations that determine the quality of
377 the final product.
378
379 Considerable experimentation has been undertaken to gain process understanding of the
380 blending step. A blending design of experiments was used to determine the impact of API
381 particle size, microcrystalline cellulose particle size and environmental humidity on the
382 blending operation. Blend uniformity was found to be the intermediate critical quality
383 attribute that directly impacts the critical quality attribute of content uniformity. Blend
384 uniformity is monitored and controlled by use of NIR.
385
386 Roller compaction was studied using design of experiments investigating formulation
387 factors and roller compaction process parameters. The design of experiments studies
388 enabled cause and effect relationships to be identified between formulation variables,
389 intermediate attributes, process parameters and final product attributes. Ribbon density
390 was identified as the intermediate critical quality attribute which ensures drug product
391 dissolution criteria are met. Ribbon density is measured in-line by NIR as part of the
392 control strategy.
393
394 The compression design of experiments investigated the impact of input material
395 attributes and compression process parameters on final product attributes and showed that
396 tablet hardness is the output attribute that must be controlled because of its relationship to
397 tablet dissolution, and tablet weight due to its relationship to content uniformity. Control
398 of the compression step is ensured through in-process measurements at regular intervals
399 throughout compression. The tablet weight is controlled via an inferential feedback loop
400 with main compression force and fill-height.
401
ACE tablets V2.0 Page 13 March 13, 2008CMC-IM Working Group
402 2. Selection of the Components of the Drug Product
403 2.1 Drug Substance
404 The target product profile for ACE tablets was met by the investigation and selection of
405 the free base of acetriptan. Acetriptan is a weak base with a pKa of 4.9. It forms
406 crystalline tartrate, citrate, hydrochloride and sulphate salts. The tartrate and citrate salts
407 show no solubility advantages. The hydrochloride and sulphate salts showed small
408 improvements in solubility; but, each showed multiple polymorphic forms. Therefore, the
409 free base was chosen for further development.
410
411 Table 3 shows an evaluation of the API attributes that present a risk with respect to final
412 drug product quality. Those API attributes considered to have potential for impact on the
413 product quality are coloured in red. The selection of acetriptan free base and polymorphic
414 form took into consideration the attributes that could affect the drug product quality. The
415 impact of the API attributes on drug product quality and the manufacturing process was
416 evaluated during development and is detailed in Section.3. The API critical Quality
417 attributes that must be controlled to ensure drug product quality are identity, solid state
418 form, impurities, water content, residual solvents and particle size. The control strategy
419 for the API manufacturing process, which ensures that acetriptan with appropriate quality
420 attributes is produced, is detailed in API development reports.
421
422 Table 3: Potential impact of API Attributes on Drug Product Attributes
423
424
425
426 2.2 Excipients
427
428 In order to meet the target product profile, tablet excipients with appropriate
429 functionality were assessed based on scientific and prior knowledge. From IND 2-1234,
430 dated February 30, 2007, the chosen excipients had been used successfully for a roller
431 compacted formulation of an analogous agent. The excipients selected were
432 microcrystalline cellulose, lactose monohydrate, croscarmellose sodium, magnesium
433 stearate and talc.
434
435 Drug/excipient compatibility was assessed through HPLC analysis of binary mixtures of
436 drug to excipient, at a 1:1 ratio in the solid state, stored at 25°C/60% RH and 40°C/75%
437 RH (open and closed conditions) for 1 month. An interaction was seen with magnesium
ACE tablets V2.0 Page 14 March 13, 2008CMC-IM Working Group
438 stearate at 40°C/75% , however it was still used, as the drug-to-magnesium stearate ratio
439 in the final product is an order of magnitude less, there will be less direct contact when the
440 drug is diluted with other excipients and magnesium stearate is generally regarded to be a
441 better lubricant than the standard alternatives. Subsequent assurance of compatibility was
442 provided by stability data on formulations used in early clinical trials and the ongoing
443 stability studies on the formulation proposed for commercialization . No compatibility
444 issues were identified between acetriptan and the excipients in the final drug product.
445
446 The excipients included in the product for commercialization are listed together, with
447 their functionalities, in Table 4.
448 Table 4: Excipients in ACE tablets
449
Excipient Quantity Quantity per Function
per tablet tablet %
(mg)
Microcrystalline cellulose 80 40 Filler/Diluent
Lactose monohydrate 81.5* 40.75* Filler/Diluent
Croscarmellose sodium 6-8 3-4 Disintegrant
Magnesium stearate Lubricant
intra-granular 2-4 1-2
extra-granular 0.5 0.25
Talc 10 5 Glidant
*Quantity adjusted to compensate for amount of croscarmellose sodium and/or
magnesium stearate used in order to ensure 200mg overall tablet weight. Each tablet
contains 20 mg (10%) acetriptan
450
451 Based on scientific and prior knowledge of the excipients used in ACE tablets, a risk
452 assessment was conducted to determine the potential impact of the excipients on final
453 product quality (see Table 5). The excipients identified as high risk were investigated in
454 more detail throughout the formulation and manufacturing process development. The
455 excipients used in the formulation for ACE Tablets, are conventional and the amounts per
456 tablet are generally within standard quantities of usage. The specifications of the inactive
457 ingredients comply with the United States Pharmacopeia/National Formulary (USP/NF),
458 European and Japanese pharmacopoeias. Additional controls, above those in the
459 pharmacopoeia, include particle size limits on the two major excipients (lactose and
460 microcrystalline cellulose).
461
ACE tablets V2.0 Page 15 March 13, 2008CMC-IM Working Group
462 Table 5: Potential impact of Excipients on Drug Product CQAs
463
464
465 3. Drug Product Formulation Development
466 3.1. Formulation Development Overview
467
468 The target product profile was to develop an immediate release tablet dosage form for oral
469 dosing. The formulation should provide an acceptable tablet size. The manufacturing
470 process must be robust and reproducible. The drug product will have to meet the critical
471 quality attributes of identity, assay, appearance, impurities, microbiological, dissolution
472 and content uniformity while also delivering suitable stability in order to not constrain
473 commercialization in worldwide markets.
474
475 Identity – the API must be of the required chemical structure and solid state form in order
476 to deliver the desired efficacy and safety profile (See ICH Q6A).
477
478 Assay- is related to dose delivery to the patient, thus to efficacy and needs to comply with
479 appropriate limits for drug content (See ICH Q6A).
480
481 Appearance- the appearance of the tablets must be acceptable such that the patient will
482 comply with the dosing regime (See ICH Q6A)
483
484 Microbiological – the tablets must conform to relevant microbiological limit tests to
485 ensure patient safety. During development, it has been demonstrated that the water
486 activity is below 0.4; therefore, it is too low to support microbial growth.
487
488 Dissolution –dissolution needs to comply with the requirement for an immediate release
489 tablet as dictated by the target product profile. This requirement relates to efficacy of the
490 product.
491
492 Content Uniformity - is related to consistency of the dose delivered to the patient,
493 thus to efficacy and needs to comply with USP, JP and Ph.Eur acceptance criteria for
494 Uniformity of Dosage Units.
495
ACE tablets V2.0 Page 16 March 13, 2008CMC-IM Working Group
496 Impurities (including Degradation Product Content) - may impact patient safety.
497 Compound ACE12345 is the principal degradation product that was demonstrated to
498 form, at low levels, during stability studies. This is an unqualified impurity. Therefore, its
499 levels need to comply with the relevant ICH limits for unqualified, identified impurities.
500 The levels of any unspecified degradation product will need to comply with the relevant
501 ICH identification limits. In order to ensure patient safety, a limit for total degradation
502 products is included.
503 3.2 Development of a Discriminatory Dissolution Method
504
505 As acetriptan is a BCS Class II compound displaying poor solubility (less than 0.015
506 mg/mL) across the physiological pH range (see Biopharmaceutics and Pharmacokinetics
507 Section 2.1.3), it was recognized that development of a dissolution method that can act as
508 a surrogate of pharmacokinetics was an important initial step to allow ACE tablets
509 manufactured during development studies to be assessed in terms of in vivo performance.
510 If such a test could be established then it could be used to help establish design space(s).
511 By consideration of ICH Q6A guidance, the objective was a dissolution test method:
512
513 • that was able to distinguish amongst different input material, processing and
514 formulation variables.
515 • that achieved significant (e.g. greater than 75%) dissolution within a timescale
516 appropriate for a routine control test.
517 • that could demonstrate in vivo relevance.
518
519 A summary of the learning gained from the method development studies is provided
520 below.
521
522 The dissolution of ACE tablets was assessed in aqueous buffers across the pH range 1.2 to
523 6.8. At all of the pH levels investigated, low recoveries were observed due to the low
524 solubility of the 20 mg dose. From these studies, it was concluded that aqueous buffers
525 did not provide the optimum conditions for use as a routine control test capable of
526 differentiation between processing and formulation variables for ACE tablets.
527
528 In accordance with regulatory guidance documents, the use of surfactants was evaluated.
529 The dissolution of ACE tablets was assessed in Tween 80 and sodium lauryl sulphate
530 (SLS). Tween media were considered to be unsuitable due to coning of insoluble tablet
531 excipients leading to incomplete disintegration of ACE tablets. Dissolution in SLS media
532 exhibited the potential for: 1)differentiation between processing and formulation
533 variables, and 2) use as a routine control test. Following assessment of SLS
534 concentrations over the range 0.25% to 5.0% w/v SLS, the optimum surfactant
535 concentration was identified as 1.0% w/v SLS in water. At this concentration, the rate of
536 tablet dissolution was sufficiently slow to provide the potential for discrimination between
537 tablet variants while still affording complete dissolution within a timescale appropriate for
538 use as a finished product test.
539
ACE tablets V2.0 Page 17 March 13, 2008CMC-IM Working Group
540 The paddle speed was selected following evaluation of tablet dissolution at 50, 75 and
541 100 rpm. For all three paddle speeds investigated in 1.0% w/w SLS media, no coning of
542 insoluble tablet excipients was observed; complete dissolution was achieved after 60
543 minutes. From these data, it was concluded that a paddle speed of 50 rpm provided the
544 optimum conditions for use as a routine control test.
545
546 Therefore, the method proposed for ACE tablets uses dissolution apparatus equipped with
547 paddles (speed 50 rpm) and a volume of 900 ml of SLS (1.0% w/v) maintained at a
548 temperature of 37°C, followed by UV spectroscopy at a wavelength of 282 nm.
549
550 The acquired data demonstrated that 1.0% w/v SLS in is the most appropriate dissolution
551 medium for discrimination between tablet batches manufactured by variation of the most
552 relevant product attributes. At a paddle speed of 50 rpm, the 1.0% w/v SLS medium is
553 capable of reproducibly discriminating between tablets manufactured by variation of most
554 relevant input material, processing and formulation variables such as the API particle size,
555 roller pressure and concentration of filler and lubricant. The data also demonstrated that
556 the proposed method is suitable for use as a routine control test.
557 3.3. Biopharmaceutics and Pharmacokinetics of ACE
558
559 Acetriptan has been shown to be stable in gastrointestinal fluid, displays high
560 permeability when investigated using Caco-2 monolayers, and is not susceptible to efflux
561 by P-glycoprotein (P-gp). Solubility of acetriptan is low (0.015 mg/mL) and constant
562 across the physiological pH range due to the lypophillic nature of the molecule. As such,
563 acetriptan can be classified as Class II based on the biopharmaceutics classification
564 system (BCS).
565
566 Acetriptan appears to exhibit linear single-dose pharmacokinetics across the investigated
567 dose range 1 to 40 mg in both healthy volunteers and patients. The apparent mean
568 clearance and volume of distribution were approximately 2.3 L/hr and 80 L, respectively.
569 The mean elimination half-life was 24 hrs, and median Tmax of 1.3 hrs.
570
571 3.4 Prototype Formulation and Process Selection
572
573 Initial evaluation of physico-chemical properties of the drug substance provided the basis
574 for the selection of roller compaction as the dry manufacturing process. The API is
575 sensitive to heat and as such would not be chemically stable during a drying process
576 required for a wet granulation manufacturing process. Given the target clinical dose of 20
577 mg and in order to obtain an acceptable size tablet, drug concentrations of approximately
578 10% were required in the tablet. The flow properties of acetriptan and excipient blends
579 were not acceptable at a concentration of 10% acetriptan, indicating that acetriptan’s
580 physical properties were not suitable for direct compression. The roller compaction
581 process allows for higher drug loads even with acetriptan properties that are not generally
582 acceptable for direct compression. A roller compaction manufacturing process does not
ACE tablets V2.0 Page 18 March 13, 2008CMC-IM Working Group
583 expose the acetriptan to excessive heat and results in granules that are acceptable for
584 compression with reliable weight control. A roller compaction process was predicted to
585 achieve the required product attributes with the minimum process complexity and the
586 lowest risk, based on the API liabilities.
587
588 The initial prototype formulation component levels were selected based on prior
589 manufacturing platform knowledge, the properties of acetriptan and acceptable
590 compatibility with acetriptan. The prototype formulation has been utilized in other drug
591 products and resulted in acceptable large scale manufacturing process attributes.
592 Microcrystalline cellulose and lactose monohydrate are among the commonly used
593 diluents for dry granulation formulations, individually and in combination with each
594 other, as they exhibit appropriate flow and compression properties. The initial
595 magnesium stearate level was selected based on knowledge of this formulation and levels
596 required to produce acceptable ejection forces. The disintegrant level was selected to
597 produce short disintegration times that would be expected to produce an acceptable
598 dissolution rate for the immediate release of the poorly soluble drug.
599
600 The initial prototype formulation, which was also used in the pivotal clinical trials,
601 contained the following components:
602
603 Intra-granular: % w/w Total tablet weight
604 Acetriptan 10%
605 Lactose monohydrate 40.25%
606 Microcrystalline Cellulose 40%
607 Croscarmellose Sodium 3.0%
608 Magnesium Stearate 1.5%
609
610 Extra – granular:
611 Talc 5.0%
612 Magnesium Stearate 0.25%
613 Total 100.0%
614
615 A risk assessment on formulation composition is shown in Table 6 below. From this
616 assessment it was concluded that the input variables potentially having the greatest impact
617 on the drug product attributes were the API particle size and concentration, and the levels
618 of the disintegrant and lubricant.
619
ACE tablets V2.0 Page 19 March 13, 2008CMC-IM Working Group
620 Table 6: Formulation Composition Risk Assessment
621
622
623
624 The risk assessment also indicated that hardness, dissolution and dose uniformity should
625 be used as the response variables. It was expected that these would also indicate whether
626 friability or disintegration would be impacted by composition changes. All formulation
627 development experiments were conducted at small scale at either 2 kg or 5 kg. The
628 manufacturing process used to conduct the formulation experiments was a standard roller
629 compaction process, that included the following manufacturing unit operations:
630
631 • Mixing / blending prior to roller compaction
632 • Roller compaction / milling
633 • Blending / lubrication
634 • Tablet compression
635
636 The parameters used for these unit operations were representative of parameters that
637 would be used as a center point for the process development and all manufacturing
638 parameters were held constant throughout the formulation development experiments.
639
640 Knowledge from two key formulation development studies is presented in the following
641 sections. The first study is a formulation component level definition study designed to
642 establish component levels for the key excipients. The second study was an API particle
643 size and magnesium stearate interaction study: its design was based on the results of the
644 first study and was utilized to establish the acceptable magnesium stearate range.
645 3.4.A Formulation Component Level Definition Study
646
647 The formulation component level definition study was designed with the objectives of
648 establishing preliminary formulation component levels and demonstrating the rationale
649 for selection of the excipient levels and the target drug concentration. The study was also
650 utilized to determine if acceptable product attribute responses were obtained over the
651 range of excipient and drug concentrations studied.
652
653 A central composite response surface design was used with 17 trial runs to study the
654 impact of three formulation factors on the three key response variables. The factors
655 studied were as follows:
656
ACE tablets V2.0 Page 20 March 13, 2008CMC-IM Working Group
657 • Drug Concentration (Load): 5% - 15%
658 • Disintegrant (Croscarmellose Na) Level: 1% - 4% (intragranular)
659 • Lubricant (Magnesium Stearate) Level: 0.75% - 2.25 (intragranular)
660
661 One lot of acetriptan (d90 20 micron) was employed in the study; therefore, API particle
662 size was constant in all experiments.
663
664 The response variables studied were as follows:
665
666 • Tablet hardness at a fixed compression pressure
667 • Dissolution average at a fixed tablet hardness of 12 kP
668 • Tablet weight uniformity (based on correlation to content uniformity)
669
670 Tablets were compressed at three compression pressures and samples were also collected
671 at a target hardness of 12 kP , the compression pressure was adjusted to achieve this
672 hardness. A constant tablet weight of 200 mg was used with the filler amount adjusted to
673 achieve the target weight.
674
675 Figure 1 contains a plot of the % target tablet weight vs the % label claim for individual
676 tablets tested in this study. For each of the 17 experimental runs, 10 tablets were
677 individually weighed and then tested for drug content. The results compiled in Figure 1
678 demonstrate that tablet weight correlates with % label claim and that most of the
679 variability observed in dose uniformity is accounted for by the weight variability. These
680 results indicate that weight uniformity can be used as a predictive surrogate for drug
681 content uniformity, assuming blend uniformity going into compression. Based on this
682 correlation, 100 tablets were individually weighed for each experimental run in order to
683 obtain a more accurate measure of variability for each trial. The tablet weight uniformity
684 data is utilized in the analysis of the data from this study.
685
ACE tablets V2.0 Page 21 March 13, 2008CMC-IM Working Group
686 Figure 1: Plot of % Target Tablet Weight vs % Label Claim for Individual Tablets
687 Tested from Formulation Definition Study
688
108
106
104
% Label Claim
102
100
98
96
94
92
92 94 96 98 100 102 104 106 108
% Target Weight
689
690
691 Note in Figure 1: Red line shows theoretical line of perfect agreement between weight
692 and drug content.
693
694 Figure 2 presents the interaction profile for the hardness response at a fixed compression
695 pressure. The interaction profile illustrates the effect of drug load and magnesium stearate
696 level on tablet hardness. Increasing both variables results in a decrease in hardness with
697 some interaction between these two variables. The higher drug load shows a larger
698 decrease in hardness with increasing magnesium stearate level.
699
700 Figure 2: Interaction profile for Hardness Response at Fixed Compression Pressure.
701
Hardness, kP
12 5
Drug Load
15 5
Drug Load
8
15
4
Hardness, kP
Disintegrant
12
4
1 Disintegrant
8 4
1
4
0.75
Hardness, kP
12 0.75
Lubricant
Lubricant
8 2.25
2.25
4
5
7.5
10
12.5
15
1
2
3
4
1
1.5
2
2.5
702
703
ACE tablets V2.0 Page 22 March 13, 2008CMC-IM Working Group
704 In order to understand the impact of the formulation variables on dissolution, the
705 relationship was examined at a fixed tablet hardness of 12 kP. The hardness was fixed at
706 12 kP because a high hardness would be expected to be the worst case for the dissolution
707 response. If dissolution were studied at a fixed compression pressure the results could be
708 confounded by the impact of drug load and magnesium stearate level on the tablet
709 hardness. As both variables are increased the tablet hardness decreases at a fixed
710 compression pressure as presented in Figure 2. This decrease in hardness would
711 confound any potential impact the variables have on dissolution because the associated
712 decrease in hardness usually results in an increase in dissolution.
713
714 Figure 3 presents the interaction profile for dissolution at a set target tablet hardness of
715 12kP. This interaction profile demonstrates that the magnesium stearate level has minor
716 effects on dissolution with the different drug loads. There is a small decrease in
717 dissolution with increasing magnesium stearate when the disintegrant level is at 1%. This
718 interaction profile also shows that there is no effect of disintegrant level between 3-4% for
719 both lubricant levels and drug loads. The dissolution response is 80% or above for all
720 drug loads, disintegrant and lubricant levels studied, meeting the attribute target criteria of
721 >75%.
722
723 Figure 3: Interaction Profile for Dissolution Response at a Set Target Tablet
724 Hardness of 12kP.
725
100
Fixed Hardness Fixed Hardness Fixed Hardness
Diss30 Avg @ Diss30 Avg @ Diss30 Avg @
5
Drug Load
95 15
5
15
90 Drug Load
85
80
100
Disintegrant
95 4 4
90 Disintegrant
85 1 1
80
100
0.75 0.75
2.25
95
Lubricant
2.25
90 Lubricant
85
80
5
7.5
10
12.5
15
1
2
3
4
1
1.5
2
2.5
726
727 A contour plot for the 30 minute dissolution response for the 10% drug load at a fixed
728 tablet hardness is presented in Figure 4. This figure illustrates that the predicted average
729 dissolution is 93% or higher, when the disintegrant level is 3% - 4%, across all levels of
730 magnesium stearate. The figure also shows a relatively small decrease in dissolution with
731 increasing lubricant levels at the low disintegrant levels. The predicted average
732 dissolution response is 85% or above for all regions of the contour plot demonstrating that
ACE tablets V2.0 Page 23 March 13, 2008CMC-IM Working Group
733 at the 10% drug load all levels of disintegrant and lubricant will produce tablets meeting
734 the attribute target criteria of >75%.
735
736 Figure 4: Contour plot of Dissolution response for 10% drug load at a set Target
737 Tablet Hardness of 12kP
4
3.5
3
Disintegrant
96
2.5
2
93
1.5
1 90 87
.75 1 1.25 1.5 1.75 2 2.25
Lubricant
738
739
740 Figure 5 presents the interaction profile for the weight %RSD response at a fixed
741 compression pressure. The only trend identified for this response is that increasing drug
742 load increases tablet weight % RSD. This trend indicates that physical properties of the
743 API could impact the weight uniformity, which would be expected. The predicted tablet
744 weight uniformity % RSD responses are 2.6% or lower, which meets the attribute target
745 criteria of < 3.0%.
746
ACE tablets V2.0 Page 24 March 13, 2008CMC-IM Working Group
747 Figure 5: Interaction profile for Weight %RSD Response at Fixed Compression
748 Pressure.
749
Weight_RSD
2.5 15 15
Drug Load
2 Drug Load
1.5 5
5
1
Weight_RSD
2.5
Disintegrant
4
2 1 Disintegrant 4
1.5 1
1
0.75
Weight_RSD
2.5 2.25
Lubricant
2 0.75
2.25 Lubricant
1.5
1
5
7.5
10
12.5
15
1
2
3
4
1
1.5
2
2.5
750
751
752 The conclusions from the formulation component level definition study provided the basis
753 for formulation component level selection. An acceptable predicted response was
754 demonstrated for weight variation % RSD over the ranges studied. The dissolution
755 response at a fixed tablet hardness of 12 kP shows only minor effects when the lubricant
756 level is between 0.75 and 2.25% and the disintegrant level is between 3 – 4%. The
757 expected commercial dosage is 20 mg such that a 10% drug load would provide a tablet
758 size that is acceptably small enough for patients to swallow. The response surface for the
759 10% drug load was robust for dissolution performance and therefore 10% was selected for
760 use in the formulation. An interaction was observed between the drug load and
761 magnesium stearate levels with regard to the hardness response. This interaction
762 indicated the need for further study to determine if API physical properties (particularly
763 particle size) could impact the hardness response and what level of magnesium stearate
764 should be used in the commercial formulation.
765
766 3.4.B API Particle Size and Magnesium Stearate Interaction Study
767
768 The API particle size and magnesium stearate interaction study was primarily designed
769 based on the interaction observed in the formulation component level study between
770 acetriptan concentration and magnesium stearate level. The objectives of the interaction
771 study were to: 1) fully characterize how the acetriptan particle size could impact drug
772 product critical quality attributes; 2) establish the acceptable particle size limits for
773 acetriptan; and 3) to establish an acceptable magnesium stearate range. The study was
774 required to fully understand the impact of this interaction for a poorly soluble drug.
775 Either of these two variables could potentially impact the dissolution rate. Due to the
ACE tablets V2.0 Page 25 March 13, 2008You can also read