Canada's Propane Supply Chain - Reliability and resilience Presented to: The Canadian Propane Association and NRCan Final - August 2021 Custom ...
←
→
Page content transcription
If your browser does not render page correctly, please read the page content below
Canada’s Propane
Supply Chain
Reliability and resilience

Presented to: The Canadian Propane Association and NRCan

Final – August 2021

Custom Report Prepared by:
The Conference Board of Canada
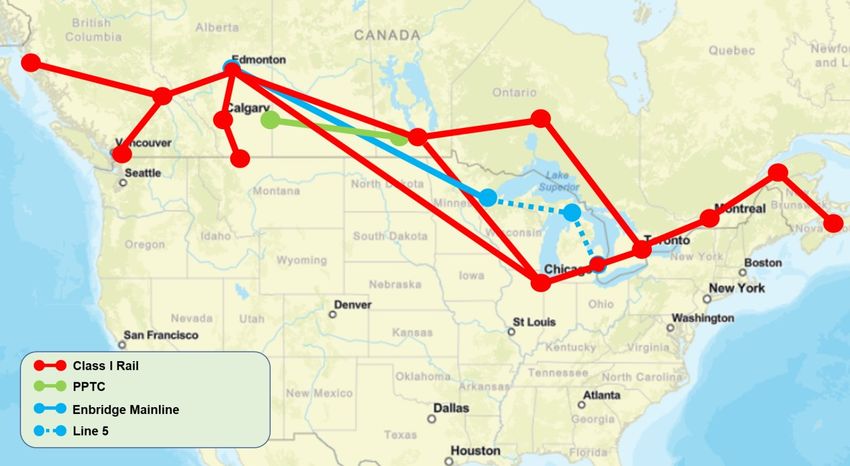
Table of Contents

Acknowledgements ........................................................................................................ 3

Executive Summary and Key Takeaways ...................................................................... 4

Canada’s propane market: overview and outlook ........................................................... 5

Propane supply in Canada ............................................................................................. 6

Propane storage .......................................................................................................... 11

Supply Outlook (2020-2030) ........................................................................................ 14

Disposition of Propane in Canada ................................................................................ 17

Overview of Domestic Demand .................................................................................... 18

Demand Outlook (2020-2030) ...................................................................................... 22

Propane Pricing and Market Dynamics in Canada ....................................................... 35

Prices and the Propane Supply Chain in Canada ......................................................... 36

Supply Chain Infrastructure for Propane in Canada ..................................................... 42

Emerging Trends and Uncertainties ............................................................................. 53

Case Studies ............................................................................................................... 55

Case 1: United Parcel Service Canada ........................................................................ 56

Case 2: Agropur Dairy Cooperative .............................................................................. 59

Canada’s Propane Supply Chain ................................................................................. 62

Appendices .................................................................................................................. 65

                                                                                                                                   2
Acknowledgements
This custom report was completed by The Conference Board of Canada’s Sustainability
Knowledge Area. The research team included Brett Goodwin, Research Associate, and
Dinara Millington, Consultant. Roger Francis, Director and Michael Burt, Vice President
completed an internal review.

Funding for this report was provided by the Canada Energy Regulator, The Canadian
Propane Association, NRCan, and Transport Canada.

The findings in this report are entirely those of The Conference Board of Canada. Any errors
or omissions in fact or interpretation remain the sole responsibility of The Conference Board.
Final creation of this report has been completed to align with The Conference Board’s policy
regarding custom publications not released publicly by The Conference Board.

                                                                                             3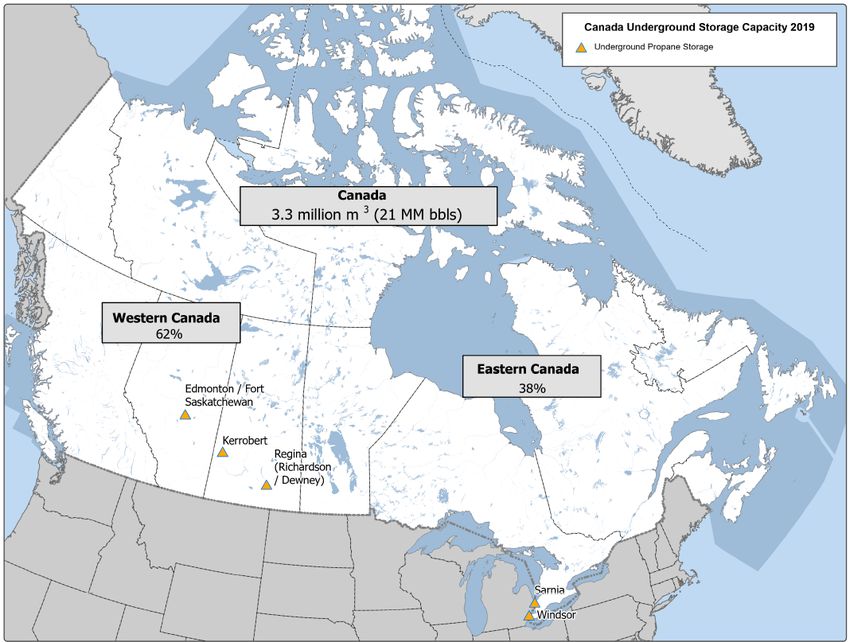
Executive Summary

This report is a companion to the Conference Board of Canada’s 2018 research output on
propane supply and demand in Canada – Fuelled Up: An Overview and Outlook of
Canada’s Propane Market and Industry (Fuelled Up).1 Fuelled Up was an assessment of the
supply and disposition of propane in Canada at a moment in time using historical data from
2006-2016.

This report provides supply and demand for the period 2010-2019 using new data, updates
to historic data, and new trends in the market as of data available at the end of March 2021.
Due to the volume of updates to data, direct comparisons between the reports are not
always feasible. To provide continuity between this and the previous report, we include brief
analyses for each chapter outlining structural and editorial changes. Where possible
substantive changes between the two reports are highlighted. Unless otherwise specified in
this report, Western Canada refers to BC, Alberta, Saskatchewan, and Manitoba. Eastern
Canada is defined as Ontario, Quebec, and the Atlantic provinces.

Key Takeaways
    •   Rapid growth in Western Canadian propane production dominates the past decade
        from 2010-2020. Production increased 115 thousand barrels per day (kb/d) from
        2010-2019, just under half of this volume, 54 kb/d, added between 2017-2019.
    •   Growth is expected to continue even as the engine of growth shifts from Alberta to
        liquids-rich production fields in northeastern British Columbia.
    •   Storage patterns have been volatile in recent years. Inventory intentions and the
        impact of the pandemic remain unknown.
    •   Hub price dynamics since 2014 have incentivized new downstream and midstream
        investments.
    •   Exports are the most significant development impacting propane disposition in
        Canada. The Edmonton-to-tidewater export corridor supported by high-throughput
        terminals in BC and Edmonton will facilitate increased overseas exports.
    •   Petrochemical facilities and the potential for propane use in upstream oil and gas
        extraction are driving near and longer-term opportunities for propane. Rising
        wholesale end-user consumption may reduce surplus propane in Edmonton.
    •   While retail demand continues to increase, overall demand is shifting further towards
        the wholesale end-use segment, including non-energy demand.2 Taken together with
        rising exports from BC, these trends could marginally move the Canadian market to
        less seasonality than in previous years.

1Murillo and others, Fuelled Up
2 Wholesale end-users include firms in the Industrial, Non-energy and Producers’ own-use demand sectors.
Retail end-uses include firms and customers in the Residential, Commercial, Transportation and Agriculture
sectors.
                                                                                                             4
Section 1

Canada’s propane market:
overview and outlook

                           5
Propane Supply in Canada

New in this study
Two additions have been made to detail supply:

      -    Propane derived from off-gases are included in the supply analysis and forecast as a
           distinct category. Off-gases had previously been excluded.
      -    The volume, location, and inventory trends for Canada’s bulk natural gas liquids
           (NGL) and propane storage infrastructure are included. With extremely long supply
           chains in Canada, storage is critical to balancing seasonal demand. Recent
           disruptions to propane supply demand a more substantial discussion of storage’s
           role in the supply chain.

Variances from previous forecast
Fuelled Up presented historical data for the period 2006-2016. Values for 2017 were
estimated based on data available as of 2018. The forecast was from 2018-2025. This
report is based on historical data for the period 2010-2019. Values for 2020 are estimates
and the forecast horizon runs from 2021-2030.

Total supply of propane totaled 332 kb/d in 2019, 93 kb/d above forecast expectations in
2018. Based on public data, actual production reached 303 kb/d in 2019 (compared to the
previous estimate of 238 kb/d). Cumulative production from 2017-2019 exceeded the
previous forecast by around 115 kb/d. This increase is a dominant featuring shaping
propane supply in the years since the previous report. Other factors include:

      •    Adjustments to historical data sets
      •    Inclusion of off-gas derived volumes in total supply
      •    Variances in methodology and macroeconomic assumptions
      •    Deployment of new capital infrastructure and the reversal of capital investment plans
      •    Global trade and macroeconomic trends including 2016’s weak energy markets

These factors impact the forecast. Breaking down the composition of variances, however,
highlights the important role growth one factor - gas processing - has had on the forecast.

Monitoring Trends
      •    Growth in gas processing increases greatly relative to the 10 years from 2006-2016,
           covered in the previous report.
      •    Expanding production in BC demonstrates that propane and other liquids-oriented
           strategies have matured in recent years.3 Since 2010, new production assets

3   British Columbia Oil & Gas Commission, Facility Inventory [BCOGC-41090].
                                                                                               6
account for 42 of the 54 kb/d or 78 per cent of the designed production capacity for
          propane in BC.
    •     Upstream assets and midstream processing plants deployed in BC over the last
          decade are designed to exploit the ‘wet’ gas of northeastern BC and Alberta’s
          Montney formation. Exploiting these resources is increasing the availability of NGL
          and propane in the extracted gas stream. Fuelled Up estimated the average gas
          plant in BC yielded 4.7 barrels (bbl) of propane for every million cubic feet (MMcf) of
          gas processed in 2017, rising to just over 5 bbl/MMcf by 2019. Actual data for that
          period results in a yield exceeding 7 bbl/MMcf by 2019. Our forecast estimates yield
          to continue rising to 9 bbl/MMcf by 2030.

Chart 1
Propane Supply - Variance from previous forecast in 2018
(kb/d)
          Gas Plants    Refinery LPG      Imports   Off-gas   Supply adjustments   Net Variance

 140,0

 120,0

 100,0

  80,0

  60,0

  40,0

  20,0

    0,0
                 2017

                                   2018

                                                    2019

                                                                   2024

                                                                                   2025

  -20,0

Source: The Conference Board of Canada

                                                                                                    7
Production
Natural gas production is the main source of natural gas liquids (NGLs) like ethane,
propane, and butane. Recent demand for certain NGLs has added value and been a driver
for increasing production especially for “wet” natural gas rich in NGLs.4

About 90 per cent of propane in Canada is produced/extracted at natural gas processing
facilities along major gas pipeline and gathering systems. The rest is produced as liquid
petroleum gases in Canadian refineries and from off-gases in upgraders in Alberta.
Canada’s total propane production reached just above 300 kb/d in 2019, increasing at a
compound annual rate of 5 per cent since 2010 (see Table 1).

Table 1
Propane Production
(kb/d; per cent)

                      2010      11       12      13      14      15       16      17      18       19         Δ (10-Yr)
                                                                                                            Chg.    CAGR
    Gas
    Processing        156       155     168     170      172     172     196      216     251      272      115          6%
    Refining           26        27      25      26       21      18      18       21      19       21       -5         -2%
    Off-gases           6         9       9       9        7       9      10       10      10       10       4           5%
    Total             188       191     202     204      201     198     223      247     280      303      114          5%
    Western
    Canada            107       114     124     128      130     128     150      178     212      233      126         8%
    Eastern
    Canada             82        77      78      76       71      69      73      69       67       70       -11        -2%
CAGR = Compound Annual Growth Rate
Sources: The Conference Board of Canada; Canadian Association of Petroleum Producers (CAPP), Statistical Handbook;
Government of British Columbia, “Natural Gas & Oil Statistics”; Government of Saskatchewan, “Gas Plant Report”, Statistics
Canada, Table 25-10-0026-01 (formerly CANSIM 128-0012).

Total propane production in Canada grew over the past decade driven by increasing
production from gas processing in Western Canada. While gas plant production volumes in
the west increased, Eastern Canada’s share of propane production declined. Production
from refineries over the 10-year period dropped, however propane production from oil sands
upgraders’ off-gases more than made up for the decline.

The complex interplay between natural gas production, gas composition, NGLs extraction
economics, and evolving processing and transportation infrastructure, have influenced
regional propane production levels across Canada. These trends are anticipated to continue
to impact the outlook for propane production in the coming years.

4Dry natural gas is at least 85 per cent methane, but often more. Wet natural gas contains methane, but also
contains NGLs such as ethane, propane, butane, pentanes.
                                                                                                                             8
Chart 2
Net Changes in Canadian Propane Production Between 2010 and 2019
(kb/d)
Gas Plants Refineries Off-gases Total
100,0
90,0
80,0
70,0
60,0
50,0
40,0
30,0
20,0
10,0
0,0
-10,0
-20,0
British Alberta Saskatchewan Ontario Quebec Atlantic
Columbia
Source: The Conference Board of Canada; CAPP, Statistical Handbook; Government of British Columbia, “Natural Gas & Oil
Statistics”; Government of Saskatchewan, “Gas Plant Report”, Statistics Canada, Table 25-10-0026-01 (formerly CANSIM 128-
0012).
Fuelled Up reported the same trend during 2006-2016: an absolute decline in refinery
production from eastern and western producers offset by a larger increase in propane
production from expanding gas processing in Western Canada. Updated data indicates this
trend remains although increases in production related to gas processing was greater in
magnitude from 2010-2019 than in the previous decade.
Imports
Canada imports relatively small volumes of propane primarily for Ontario and Quebec
markets. These imports balance regional demand. Total imports grew from 2 kb/d in 2010 to
5 kb/d for 2019, peaking just above 8 kb/d in 2014. (See Chart 3).
The record surge in imports during 2013-2014 was driven by an historic double-demand
’shock’.5 The volatility was brought on by a large, wet corn harvest in the United States (US)
followed by a severe cold snap impacting much of the Midwestern and Eastern US, and
Canada.6 Demand in some Canadian regions rose by more than 50 per cent in this period.7
Wholesale and retail prices increased rapidly especially eastern Ontario, western Quebec
5 ‘Shock’ in this context will refer to sudden and exogenous changes to demand-side factors impacting the level
of propane demand relative to historical trends. Exogenous demand shocks can act to both increase or decrease
domestic demand.
6 Natural Resources Canada and Canada Energy Regulator, Final Report to the Minister of Natural Resources
and the Minister of Industry.
7 Ibid.
9and Atlantic Canada. In some cases, prices rose more than 100 per cent.8 As prices rose,
volumes destined for export off the US Gulf Coast were pulled back into North American
markets and record volumes made their way into Canada as imports.9
Chart 3
Propane imports play important role in the Central and Atlantic Canada
(kb/d)
9
8
7
6
5
4
3
2
1
0
2010 2011 2012 2013 2014 2015 2016 2017 2018 2019
British Columbia Alberta Other Ontario Quebec Atlantic
Source: The Conference Board of Canada; Statistics Canada, Table 25-10-0026-01 (formerly CANSIM 128-0012).
While the 2013-2014 was an extreme case, it does not explain sustained higher average
rate of imports by Eastern Canada since 2015. (See Chart 3).
Analysis and assessment of data help identify several factors possibly contributing to
elevated import rates. In no order of priority, they include:
• A reduction in supply from Atlantic provinces. Production in this region fell by 8 per
cent annually from 6 kb/d in 2010 to a low of 4 kb/d by 2019. The decline may be due
to lower gas processing in Nova Scotia and the shuttering of the Come-by-Chance
oil refinery in Newfoundland.10 These constraints forced an increase in propane-by-
rail (PBR) shipments from Ontario and other US-based hubs which increased import
volumes.
• Growing demand due to fuel switching from distillate oil and fuel oil.11
• Eastern Canadian retailers diversified suppliers over the last decade. Some retail
distributors contracted annual supply with a wider range of wholesalers, looking
8 Ibid.
9 Milutinovic, Shelly, House of Commons Standing Committee on Natural Resources, “Evidence, December 9,
2014”
10 CBC News, “North Atlantic oil refinery in Come By Chance could close permanently”
11 Conference Board of Canada analysis.
10beyond Sarnia and domestic refineries in response to recent and potential disruptive
events, including both demand shocks and supply chain disruptions.12
• Weak hub prices following 2014, especially after the Cochin Pipeline reversal, added
extra supply to North American markets. This contributed to a global decline in
energy prices. As Edmonton spot prices for propane dipped into negative territory, a
wider basis opened between hub prices in Sarnia, Ontario, and supply points
accessible by rail like Conway, Kansas, and Edmonton, Alberta.
These factors help explain why imports rose as a share of total supply in the years since
2014 despite surging supplies of propane from Western Canada over the same period.
Propane Storage
Propane demand is highest during Canada’s cold winter months. Canadian farmers also rely
on propane to dry crops during the fall of each year. These seasonal demands present
logistical challenges. Producers are limited in their ability to increase propane production in
response to seasonal price fluctuations.
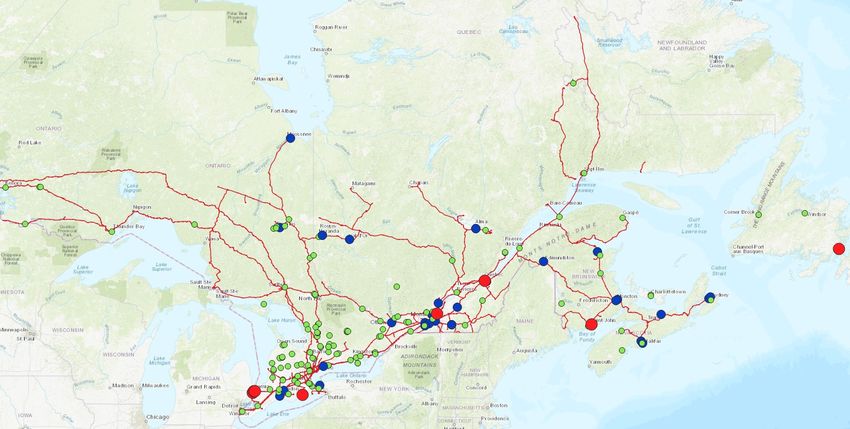
Figure 1
Underground Propane Storage in Canada (2019)
Source: Canada Energy Regulator, “Market Snapshot: Where Are Canada’s Propane Inventories for Winter Demand Stored?”
12 Ibid.
11Propane is stored in bulk in large underground salt caverns. Canadian caverns have a total
capacity of about 21 million barrels (MMbbl). Most is in Alberta (46 per cent), Ontario (38 per
cent), and Saskatchewan (16 per cent).13 Inventories fluctuate with seasonal demand.
Stocks rising in April and continuing to grow through summer and early fall.
Peaking in October or November inventories then decline as harvest progresses and
agricultural demand for crop drying drops off. Stocks recover slightly before the winter
heating season begins, peaking again in January until inventories are drawn down as they
meet heating demand across Canada and the US. (See Chart 4.)
The 2020 propane injection season (April to October) overlapped with the start of the
COVID-19 pandemic. As a result, propane exports to major markets such as the US
Midwest and Gulf Coast declined, and inventories increased. Low propane prices early in
the season caused sellers to put propane into storage in the hopes of higher winter 2020/21
prices. This resulted in a build-up of propane stocks in Canada that reached a record high in
October 2020 of 14.9 MMbbl, or roughly 70 per cent of the available storage. (See Chart 4.)
Chart 4
Total Canadian underground propane inventories, 2015-2020 (MMbbl)
16,00
14,00
12,00
10,00
8,00
6,00
4,00
2,00
0,00
Jan Feb Mar Apr May Jun Jul Aug Sep Oct Nov Dec
5-Yr Range 5-Yr Average 2019 2020
Source: Canada Energy Regulator; The Conference Board of Canada
Inventories in both Western Canada and Ontario were higher than levels reported in October
2019 when underground inventories were at their lowest levels in five years. (See Charts 5
and 6.)
13Canada Energy Regulator, “Market Snapshot: Where are Canada's propane inventories for winter demand
stored?”
12Chart 5
Eastern Canadian underground propane inventories, 2015-2020 (MMbbl)
7,00
6,00
5,00
4,00
3,00
2,00
1,00
0,00
Jan Feb Mar Apr May Jun Jul Aug Sep Oct Nov Dec
5-Yr Range 5-Yr Average 2020 2019
Source: Canada Energy Regulator; The Conference Board of Canada
Chart 6
Western Canadian underground propane inventories, 2015-2020 (MMbbl)
10,00
9,00
8,00
7,00
6,00
5,00
4,00
3,00
2,00
1,00
0,00
Jan Feb Mar Apr May Jun Jul Aug Sep Oct Nov Dec
5-Yr Range 5-Yr Average 2019 2020
Source: Canada Energy Regulator; The Conference Board of Canada
13Total Supply
Propane supply reached 332 kb/d in 2019 growing by 5 per cent since 2010. Increasing
domestic propane production from gas plants, refineries, and upgraders were the main
drivers. (See Table 2.)
Table 2
Canadian Propane Supply
(kb/d; per cent)
2010 11 12 13 14 15 16 17 18 19 Δ (10-Yr)
Chg. CAGR
Production 188 191 202 204 201 198 223 247 280 303 114 5%
Western Canada 107 114 124 128 130 128 150 178 212 233 126 8%
Eastern Canada 82 82 82 82 82 82 82 82 82 82 0 0%
Imports 2 2 3 6 8 6 7 7 6 5 3 9%
Western Canada 2 1 1 1 1 1 0 0 0 0 -1 -12%
Eastern Canada 1 1 1 5 7 5 6 7 6 4 4 22%
Supply
14 20 28 17 3 23 12 17 16 25 10 6%
Adjustments
Total Supply 205 213 233 227 212 227 242 271 301 332 127 5%
* supply adjustments include changes in inventories, inter-product transfers, and statistical adjustments
Sources: The Conference Board of Canada; CAPP, Statistical Handbook; Government of British Columbia, “Natural Gas & Oil
Statistics”; Government of Saskatchewan, “Gas Plant Report”, Statistics Canada, Table 25-10-0026-01 (formerly CANSIM 128-
0012).
The COVID-19 pandemic has caused many disruptions. Domestically, Canada saw a
decline in energy production and disposition in an already “dampened” energy sector.14 In
2020 total propane supply in Canada declined an estimated 38 kb/d or 11 per cent from
2019 values. (See Table 2.)
Supply Outlook (2020-2030)
From 2020 forward the COVID-related decline is expected to be offset by increased propane
production. Supply is forecast to rise from 294 kb/d in 2020 to 387 kb/d by 2030, an increase
of about 30 per cent. (See Chart 7.)
Liquids-rich natural gas production continues to be the main driver of NGL production growth
in Canada. In addition, ongoing midstream infrastructure investments, like the expansion of
the Empress Plant (completed in 2020) to add 30,000 b/d of propane-plus fractionation
14Refaei and others, Economic Recovery Pathways for Canada’s Energy Industry: Part 2 - Canadian Crude Oil
and Natural Gas.
14capacity to the company’s Empress East NGL system, will likely prompt higher recovery of
propane than the present.
After 2023 more than 90 per cent of the forecasted supply increase will be available to the
market. Past 2030, the trajectory is essentially flat as demand and supply dynamics are
driven by macroeconomic variables.
An important trend to monitor will be the shift from Alberta to BC as primary driver of supply
growth over the outlook period. From 2024-2030 production in Alberta and Saskatchewan
declines slightly, at rates of less than 2 per cent compound annual growth rate (CAGR). By
contrast, total BC supply is forecast to expand by 4 per cent annually (see Chart 8).
Chart 7
Total Supply Outlook
(kb/d)
450,00
400,00
350,00
300,00
250,00
200,00
150,00
100,00
50,00
0,00
Gas plants - West Gas plants - East Refinery LPG
Off-gas Imports Supply adjustments
Total Supply
Source: The Conference Board of Canada; CAPP, Statistical Handbook; Government of British Columbia, “Natural Gas & Oil
Statistics”; Government of Saskatchewan, “Gas Plant Report”, Statistics Canada, Table 25-10-0026-01 (formerly CANSIM 128-
0012).
15Chart 8
British Columbia an engine of production by 2024
(Short/ medium-term growth rates; kb/d)
CAG(D)R 2021-2023 CAG(D)R 2024-2030
18%
16%
14%
12%
10%
8%
6%
4%
2%
0%
British Columbia Alberta Saskatchewan Eastern Canada
-2%
-4%
Source: The Conference Board of Canada; Statistical Handbook; Government of British Columbia, “Natural Gas & Oil
Statistics”; Government of Saskatchewan, “Gas Plant Report”; Statistics Canada, Table 25-10-0026-01 (formerly CANSIM 128-
0012)
16Disposition of Propane in Canada
New in this report
Disposition of propane in Canada is through seven economic sectors and through exports.
Data is summarized by the wholesale and retail end-use segments and broken down
between western, eastern, and overseas markets.
Variances from previous forecast
Most significant is the growing share of Canada’s overall propane supply used by exports
and non-energy demand. Non-energy demand is an important theme in this report. Non-
energy demand covers applications for propane that do not require combustion of propane
as a fuel to produce secondary energy. Petrochemical manufacturing accounts for the
largest share of non-energy demand, primarily for production of ethylene and propylene.
Other examples include use as propellant in aerosol canisters, as a refrigerant, and as a
solvent in a range of activities from food manufacturing to upstream oil and gas extraction.
Chart 9
Variance from forecast: Propane disposition
(kb/d)
Non-energy Industrial Commercial
Residential Transportation Agriculture
Producers' own-use Total Domestic Demand
50,0
40,0
30,0
20,0
10,0
0,0
-10,0
-20,0
2010 11 12 13 14 15 16 17 18 19
Source: The Conference Board of Canada
Exports grew by 8.3 per cent annually from 2010 to 2019. Non-energy demand increased by
6 per cent annually over the same period. That compares to an estimated average annual
17decline in exports of 0.3 per cent in the 2006-2016 period of the previous report.15 Non-
energy demand grew faster over the decade 2010-2019 as well. These increases reflect
significant adjustments and updates to Statistics Canada’s data for non-energy demand in
Ontario between 2013-2016 (see Chart 9).16
Monitoring Trends
• Rapid growth in wholesale end-use segment and export demand is influencing long-
term market dynamics.
• Crude oil producers are injecting increasing volumes of NGL and propane into
unconventional oil sands deposits as solvent.
Overview of Domestic Demand
In 2019, total domestic demand for propane was estimated at 146 kb/d, or 44 per cent of
total propane supply (see Table 3). Propane demand increased over the 10-year period,
growing at a compound annual growth rate of 3 per cent since 2010.
Growth in non-energy demand exceeded the previous forecast. Methodological and
statistical adjustments are responsible for some historical variation; changes in the
configuration of petrochemical plants in Ontario likely also contributed to the temporary rise
in non-energy demand in Ontario between 2013-2017/18 (see Chart 19).17 Anticipated
growth in non-energy demand beyond 2020 is being driven by the petrochemical sector and
upstream oil and gas sector in Alberta.
Industrial and non-energy demand sectors were two thirds of 2019 demand. Increase in
non-energy results from propane being used in petrochemical processes such as ethylene
and propylene manufacturing.18 The increase in 2019 is not driven by new petrochemical
projects that consume propane exclusively to produce polypropylene (PP), which are set to
come online in early 2022. A smaller increase comes from the oil sands industry exploring
solvent-based technologies to extract bitumen from in situ wells in Alberta.19
15 Murillo and others, Fuelled Up
16 Statistics Canada, Table 25-10-0026-01
17 See Nova Chemicals, Second Quarter Earnings Report 2012; “Update on Our Growth Projects: Manufacturing
East.” See also Oil and Gas Journal, “Nova nears 100% NGL feedstock conversion at Corunna ethylene plant”
18 Note, the 2019 increase in non-energy demand is not the result of anticipated demand from Inter Pipeline’s
new PDH facility. No petrochemical facility is producing PP from a dedicated propane feedstock as of writing.
Propane is consumed in small quantities by existing NOVA Chemicals ethylene-production facilities in Joffre,
Alberta. See Murillo Natural Gas Liquids (NGLs) in North America – An Update Part II, p. 27; See also Nova
Chemicals, “Joffre, AB, Canada”
19 AER, ST3 – Supply and Disposition of Propane
18Table 3
Canadian Domestic Propane Demand
(kb/d; per cent)
Δ (10-Yr)
2010 11 12 13 14 15 16 17 18 19 Chg. CAGR
Industrial 37 42 51 43 41 39 36 41 49 49 12 3%
Commercial 25 27 31 26 25 24 26 25 23 26 1 0%
Residential 11 12 14 11 10 10 12 12 10 11 0 0%
Non-energy Use 25 30 40 54 40 42 42 22 20 43 18 6%
Transportation 9 9 10 8 7 7 8 8 8 8 -1 -1%
Agriculture 6 7 7 6 6 6 7 7 7 7 1 2%
Producers’ Own-Use 0 0 0 1 1 1 1 0 1 2 1 17%
Total Domestic
Demand 113 127 153 148 129 129 132 115 118 146 33 3%
Wholesale* 62 72 91 97 82 81 79 63 70 94 31 4%
Retail 50 55 62 51 48 48 53 52 48 52 2 0%
By Region
Alberta 39 45 56 48 43 51 44 48 55 79 40 7.4%
Other Western
15 15 16 16 16 15 14 15 17 18 3 2.0%
Canada
Western Canada 53 59 72 62 57 64 55 61 72 97 43 6.0%
Ontario 44 54 66 71 58 49 62 40 29 32 -13 -3.3%
Other Eastern
3 1.7%
Canada 16 16 16 16 16 17 17 16 17 18
Eastern Canada 59 69 81 86 73 65 78 55 46 49 -10 -1.8%
CAGR = compound annual growth rate
*Industrial, non-energy, and producer own-use segments. Retail-level includes all other end-use segment Note: Totals may not
be exact due to rounding.
Sources: The Conference Board of Canada; Statistics Canada, Table 25-10-0026-01 (formerly CANSIM 128-0012).
The commercial sector takes about 20 per cent of total demand, the remainder equally
distributed between residential, agriculture and transportation sectors. The most common
application for propane in these sectors is space heating. Significant changes from previous
trends were not evident for these sectors.
Technology Trend: solvent-based applications for propane in Canada
Pilot projects in Alberta are assessing the use of NGL-based solvents to reduce the energy
intensity of in situ bitumen extraction.20 Several variations are being looked but all share the
idea that solvents introduced into subsurface deposits will reduce the bitumen viscosity and
20 Umeozor, Zamzadeh and Millington, In Situ Oilsands Technology Trends Study.
19improve in situ bitumen extraction performance.21 Propane is one solvent under
consideration.
Apart from extraction, other technologies such as Solvent Deashphalting (SDA) are also
being explored. SDA plants treat and separate molecules within refinery residues in a
process that produces deasphalted oil (DAO) product and pitch. These products are
integrated into other refinery processes or fed into the production of higher-value
commodities like asphalt.22 SDA plants are considering propane for this process.23
Propane-as-solvent developments are driven by policy as much as technological and market
reasons.24 As climate regulation and carbon pricing mounts, there’s rising pressure on
upstream producers to reduce their energy and water-use intensity at unconventional
oilsands projects. If propane is integrated into the upstream processes for unconventional
crude oil and gas extraction, implications to long-term wholesale end-use demand in Alberta
could be significant. Precisely what the impact on non-energy demand will be remains
unknown.
Exports
Canada relies on rail to get propane to domestic and export markets. After 2014 when the
Cochin pipeline stopped shipping propane, rail’s importance increased.25 There are no
pipelines moving consumer-grade propane out of Western Canada, so it is shipped by rail or
truck to US and Eastern Canadian destinations.
Sarnia has a fractionator and refineries producing propane. It also receives propane from
the US and Western Canada by rail and pipeline. From Sarnia, propane is delivered by rail,
truck, and pipeline to Eastern Canada and to export markets in the US, especially
midwestern states.
Since May 2019 propane is also being railed to AltaGas’ Ridley Island Propane Export
Terminal (RIPET), in Prince Rupert, BC for export to overseas markets. In 2019, marine
transport accounted for 12 per cent of the 187 Mb/d of Canadian propane exports, second
only to rail (76 per cent), pipeline (7 per cent) and truck (5 per cent). (See Chart 10).
21 Ibid.
22 McDermott, “Solvent Deasphalting.”
23 Ibid.
24 Ibid.
25 Natural Resources Canada and Canada Energy Regulator Final Report to the Minister of Natural Resources
and the Minister of Industry.
20Chart 10
Net Change in Propane Exports, 2010-19
(kb/d)
Truck
Eastern
Canada
Railway
Pipeline
By Source
Truck
Western
Canada
Railway
Pipeline
Marine
Non-
US
Other*
By Destination
West Coast
Rockies
US
Gulf Coast
Midwest
East Coast
-40 -20 - 20 40 60 80 100 120
Sources: The Conference Board of Canada; Canadian Energy Regulator, Commodity Tracking System—Natural Gas Liquids.
Prices for propane are higher in overseas markets than in existing export markets in the US.
As more export capacity comes online on the West Coast, marine transport will play an even
larger role relative to that of rail and trucks today.
21Total Disposition
Total disposition of propane grew over the last 10 years thanks to increasing domestic
demand and increasing export volumes (see Table 4). In 2019, Western Canada disposed
of 74 per cent of propane, Eastern Canada 26 per cent.
Table 4
Total Canadian Propane Disposition
(kb/d)
Δ (10-Yr)
2010 11 12 13 14 15 16 17 18 19
kb/d CAGR
Domestic Demand 113 127 153 148 129 129 132 115 118 146 33 3%
Exports 81 81 99 100 90 112 115 138 152 187 106 9%
Total Disposition 194 209 252 249 220 241 248 254 271 332 139 6%
Western Canada 97 106 126 116 109 136 142 162 183 247 150 10%
Eastern Canada 97 103 126 133 111 105 106 91 87 86 -11 -1%
CAGR = compound annual growth rate.
Note: totals may not be exact due to rounding.
Sources: The Conference Board of Canada; Statistics Canada, Table 25-10-0026-01 (formerly CANSIM 128-0012).
Fuelled Up forecasted non-energy demand to remain flat between 2017-2019 before
increasing after 2020. With historical data now available, it shows non-energy demand is
coming online much faster having expanded by 21 kb/d since 2017-2019.
This growth in non-energy demand is contributing to the shift from retail to wholesale end-
use customers as a share of the overall disposition of propane among domestic sectors in
Canada. Similarly, growth in exports from BC grew by around 18 per cent (CAGR) from
2010-2019, twice the rate estimated in the previous study.
Detailed Demand Outlook (2020-2030)
From 2020-2030 domestic propane demand is projected to mirror general economic and
population growth for most end-use sectors. Total domestic demand is estimated to rise
from 146 kb/d in 2019 to 179 kb/d in 2030, a 23 per cent increase (see Charts 11 and 12).
Western Canadian production coupled with location and price advantages will continue to
increase domestic propane use in petrochemicals, oil sands, and West Coast exports.
22Chart 11
Domestic Propane Demand Outlook, by sector
(kb/d)
Non-energy Industrial Commercial Residential
Transportation Agriculture Producers' own-use
200
180
160
140
120
100
80
60
40
20
0
e = estimate; f = forecast
Source: The Conference Board of Canada
Chart 12
Domestic Propane Demand, by Province
(kb/d)
British Columbia Alberta Saskatchewan Manitoba Ontario Quebec Atlantic Territories
200
180
160
140
120
100
80
60
40
20
0
2010 11 12 13 14 15 16 17 18 19 20e 21f 22f 23f 24f 25f 26f 27f 28f 29f 30f
e = estimate; f = forecast
Source: The Conference Board of Canada
Marine terminal capacity in BC will be a limiting factor in growing West Coast exports. Yet
recent years have seen that capacity increase rapidly: expansions to RIPET doubled
23capacity at the terminal to 80 kb/d in 2021. The terminal is exporting around 50 kb/d as of
July 2021 and on target to increase further.26 In addition, Pembina’s Prince Rupert Terminal
(PRT) commenced operation in April 2021. The forecast incorporates an additional 25 kb/d
of export capacity to account for operations at PRT.
How will the rise in overseas exports and future growth in wholesale end-use demand driven
by the petrochemical sector impact the commercial and logistical dynamics of Canada’s
propane supply chain? This remains unknown but is a key consideration for the propane
industry.
As a growing share of supply is disposed towards overseas exports and domestic customers
in the wholesale end-user segment propane demand in Canada will become, on average,
less seasonal when compared to the sharply seasonal retail demand. This dynamic may
generate unforeseen supply chain impacts and implications for the broader Canadian
market.
The increasing size of wholesale end-use and overseas export (non-seasonal demand)
demand would not have an impact on reliability. There remains ample production to service
both wholesale offtakes and the stockpiling of propane in preparation for winter demand
peaks. A shift to overseas exports and non-energy demand is not a serious concern for the
reliability of the supply chain over the outlook period. There remains room for more slack to
come out of the surplus propane supply around Edmonton.
Non-energy demand from petrochemical plants is not expected to compete for storage
space with volumes required to maintain commercial, residential, and agricultural demand
during harvest and the winter heating season. The outlook suggests that sufficient summer
propane can be stockpiled to account for winter demand peaks and the trend towards
wholesale and overseas export demand in Canada should not impact the overall reliability of
the supply chain.
Industrial Propane Demand Outlook
The industrial sector was the largest domestic user of propane in 2019. The oil and gas
industry accounted for most of the sector’s total use of propane, followed by mining,
construction, and manufacturing.
Propane’s high heating content is suited to many industrial processes requiring heat.
Applications are varied and include metal manufacturing and manufacturing skim-milk
powder. It’s commonly employed for space heating applications like warehouses and at
remote work camps. In addition to heating, facilities use propane to supply back-up power
generation for critical infrastructure or remote installations not connected to the power grid.
Forklifts and other specialized machinery also use propane for motive power.
26 AltaGas Ltd., “Management’s Discussion and Analysis, Q2 2021”.
24Chart 13
Industrial Propane Demand Outlook, by province
(kb/d)
British Columbia Alberta Saskatchewan Manitoba Ontario Quebec Atlantic Territories
60
50
40
30
20
10
-
e = estimate; f = forecast
Source: The Conference Board of Canada
The outlook for industrial demand has improved relative to the previous report. It is forecast
to increase by a CAGR of 1.1 per cent over the outlook period, exceeding the prior forecast
in 2025 by around 10 kb/d.
Looking to 2030, the industrial sector’s share of total demand is projected to decrease from
34 per cent in 2019 to 29 cent in 2030. This is a relative decline, not an absolute one.
Stronger growth in non-energy demand is forecast relative to industrial demand over the
forecast horizon, resulting in the share of the total taken by the industrial segment declining
over the same period.
Depending on the stringency of policies like the Clean Fuel Standard (CFS) and the carbon
price on greenhouse gas (GHG) emissions, some industrial demand for propane will shift to
natural gas or electricity over the outlook. Where and at what rate this takes place remains
dependent on location, incumbent fuel source, and available alternatives.
As environmental and regulatory policies push end-users to reduce energy intensity,
however, a lower average emission intensity positions propane to displace some activities
currently powered by more emission intensive fuels.
Commercial Propane Demand Outlook
Propane is used in large urban centers and smaller communities. About 80 per cent of all
demand comes from three provinces, Ontario, Quebec, and Alberta (see Chart 14).
25Chart 14
Commercial Propane Demand Outlook
(kb/d)
British Columbia Alberta Saskatchewan Manitoba Ontario Quebec Atlantic Territories
35
30
25
20
15
10
5
0
e = estimate; f = forecast
Source: The Conference Board of Canada
Commercial consumers include wholesale and retail traders, warehouses, schools,
hospitals, and office buildings. Commercial customers also account for the arts and
entertainment sector, accommodation, and food services industries. These customers
primarily use propane for space heating.
Over the outlook period this sector’s demand is projected to remain flat. Various federal and
national energy efficiency regulations related to improving building codes and energy use
may limit demand growth (see Chart 14). This is consistent with the trajectory of the forecast
in the previous report.
Residential Propane Demand
Propane in the residential sector is primarily used for space and water heating. Ontario
consumes 53 per cent and Alberta 20 per cent. Ontario’s share of total residential propane
demand fluctuated over the last decade rising as high as 66 per cent to as low as 56 per
cent. The estimate for 2019 residential demand of 53 per cent was the lowest since 2010.
Again, this is not an absolute decline. Residential propane demand in Ontario rose from
2010-2019. The trend, however, suggests the composition of residential propane demand
between provinces may be changing overtime. The overall volume of propane is forecast to
grow slowly over the outlook period.
26Chart 15
Residential Propane Demand (kb/d)
British Columbia Alberta Saskatchewan Manitoba Ontario Quebec Atlantic Territories
16
14
12
10
8
6
4
2
0
2010 11 12 13 14 15 16 17 18 19 20e 21f 22f 23f 24f 25f 26f 27f 28f 29f 30f
e = estimate; f = forecast Source: The Conference Board of Canada
Transportation Propane Demand
Automotive propane amounted to 0.4 per cent of transportation fuels used in Canada.27
While road transportation is dominated by gasoline and diesel, propane is the third most
used fuel in passenger and light duty cars and trucks.
Chart 16
Transportation Propane Demand (kb/d)
British Columbia Alberta Saskatchewan Manitoba Ontario Quebec Atlantic Territories
12
10
8
6
4
2
0
2010 11 12 13 14 15 16 17 18 19 20e 21f 22f 23f 24f 25f 26f 27f 28f 29f 30f
e = estimate; f = forecast
Source: The Conference Board of Canada
27 Natural Resources Canada, Comprehensive Energy Use Database.
27Propane has found purchase among fleet operators. School divisions, police departments,
courier, and delivery companies have adopted propane partially in response to fuel
standards impacting the use of diesel.
Canadians consumed 8.6 kb/d of auto-propane in 2010. The total declined to 7.9 kb/d by
2019, a 0.9 per cent compound annual decline over the decade (see Chart 16). The demand
pattern over the last decade has been uneven, growth is fluctuating between positive and
negative periods (see Chart 17). Over the outlook period, demand for auto-propane is
projected to expand by 1.1 per cent annually to 2030 (see Chart 16).
Chart 17
Transportation demand fluctuates over the decade.
(kb/d)
British Columbia Alberta Saskatchewan Manitoba Ontario Quebec Atlantic Territories
2,0
1,5
1,0
0,5
0,0
-0,5
-1,0
-1,5
-2,0
-2,5
2010/11 11/12 12/13 13/14 14/15 15/16 16/17 17/18 18/19
Source: The Conference Board of Canada
The change observed for BC’s transportation demand from 2017-2018 is significant. The
increase is counter to the trend over the decade from 2007. Data for 2018 records a 67 per
cent increase over the prior year compared to an average annual variation of 15 per cent in
absolute terms (see Chart 17).
Statistics Canada has discontinued the Canadian Vehicle Survey. The previous report used
that survey’s data (2009) to extrapolate numbers for propane vehicles in different vehicle
categories and by province. Estimating propane vehicles by category and province using
this 12-year data is no longer valid and an up-to-date dataset would be required for
accuracy.
Clean energy policy and propane transportation demand
This analysis does not include an assessment of the impact of policies like the CFS on the
future capital stock of vehicles in Canada. Wide-spread fuel switching to electricity and
hydrogen in road transportation is not expected to have a great impact in this forecast
28period. As alternative energy adoption increases beyond 2030, fossil fuel use is forecast to
decline. The composition of fossil fuels still in use for transportation post 2030 remains
unknown and speculative.
Auto-propane has lower emission intensities than gasoline and diesel, and LPG vehicles
have a low pay-back period due to low fuel cost.28 As operating costs for diesel vehicles rise,
medium duty fleet operators will be incentivized to reduce costs by investing in lower
emission vehicles. There is an opportunity for propane to displace diesel fuel for road freight
transportation, a sector where diesel currently accounts for 66 per cent of total energy use in
Canada.29 Recent examples of this behavior include the conversion of around 140 school
busses in Halifax to run on auto-propane.30
Seizing short- and medium-term opportunities will not be straight forward. Newly revised
federal CFS policy identifies fuel switching to propane as one of the credit generation
options under the Compliance Category 3 “End-use fuel switching in transportation”.
However, the policy also states “this pathway on its own would not likely be sufficient to
incentivize investment that supports measurable incremental natural gas/propane uptake in
transportation.”31 This guidance on the application and impact of the CFS is an important
consideration. Fuel switching to auto-propane from gasoline or diesel will be highly
dependent on federal and provincial policies to incentivize consumer behavior.32
Agricultural Propane Outlook
Canada’s agricultural sector uses propane primarily as a source of heat and motive power.
It’s used to power irrigation systems and on-farm generators, and heat livestock buildings,
greenhouses, chicken coups, and other buildings.
Farmers rely on propane to dry crops before being delivered to elevators for transit to
market. Undried crops cause farmers financial loss due to penalties or, if left too wet for too
long, product loss. While only accounting for 2.3 per cent of total agricultural demand
propane has an outsized importance for farmers across the country. This is especially true in
Quebec and Ontario where more propane is needed kilo-for-kilo, to dry the same volume of
crop due to higher moisture conditions than Western Canada.33
Agriculture’s share of total propane demand was estimated at 5 per cent in 2019. Ontario
and Quebec account for more than 80 per cent of total Canadian agricultural propane
demand. Demand is forecast to expand at a compound annual rate of 1.1 per cent, 0.4 per
cent higher than the forecast in the previous report (see Chart 18).
28 The Conference Board of Canada; Canadian Propane Association, “Auto-Propane.”
29 Natural Resources Canada, Comprehensive Energy Use Database.
30 Canadian Propane Association, “Auto-Propane.”
31 Canada Gazette, "Part I, Volume 154, Number 51: Clean Fuel Regulations."
32 Ibid.
33 Natural Resources Canada, Comprehensive Energy Use Database.; Interview feedback
29Chart 18
Agricultural Propane Demand Outlook, by province
(kb/d)
British Columbia Alberta Saskatchewan Manitoba Ontario Quebec Atlantic Territories
8,00
7,00
6,00
5,00
4,00
3,00
2,00
1,00
0,00
2010 11 12 13 14 15 16 17 18 19 20e 21f 22f 23f 24f 25f 26f 27f 28f 29f 30f
e = estimate; f = forecast
Source: The Conference Board of Canada
Growth rates and the composition of agricultural demand among provinces is similar to the
previous report. Ontario and Quebec’s share declined from 86 to 82 per cent of total
demand from 2010-2019. Alberta and Manitoba accounted for most of the offsetting
increase.
Producer Consumption and Non-Energy Propane Demand
Traditionally propane consumed in the process of fractionating NGL mixes to produce
specification products and the propane consumed at refineries to produce specification
propane, are considered producer consumption. This is the smallest share of total propane
demand. Over the forecast period, producer consumption is projected to remain flat.
Provincial investment into Alberta’s petrochemical sector has the potential to increase the
use of propane to make plastics. Inter Pipeline’s Heartland Petrochemical Complex (HPC) is
expected to commence production of PP from propane in the second quarter of 2022.34 35
This plant would consume 22 kb/d of propane annually and while the suspension Pembina
and Kuwait Petrochemical Industries (KPI) planned PDH facility did reduce our estimate for
non-energy demand over the outlook period, additional investments in the petrochemical
34AER, ST3: Supply and Disposition of Propane.
35Inter Pipeline, “Inter Pipeline issues Notice of Change recommending Brookfield offer and provides update o
Heartland Petrochemical Complex.”
30industry in Alberta are under review by industry – expansion of the existing PDH/PP
opportunities remains a distinct possibility over coming years. (see Chart 19).
Chart 19
Non-Energy Propane Demand
(kb/d)
British Columbia Alberta Saskatchewan Manitoba Ontario Quebec Atlantic Territories
80
70
60
50
40
30
20
10
0
2010 11 12 13 14 15 16 17 18 19 20e 21f 22f 23f 24f 25f 26f 27f 28f 29f 30f
-10
e = estimate; f = forecast
Source: The Conference Board of Canada
Additional demand for propane is coming from the oil sands sector, specifically in situ
technologies utilizing propane and/or butane as a solvent.36 Solvent-aided extraction
reduces the emission intensity of produced bitumen, therefore, demand for propane is
projected to increase in line with sector’s adoption of these technologies.
Growth in non-energy demand in updated historical data is the most significant development
relative to the previous report. The expansion was not unanticipated. Updated data for the
period 2017-2019 indicates an acceleration of the timeline set out in Fuelled Up and is not a
deviation from that trend.
Exports
Canada is expected to remain a net exporter. Traditionally, propane exports were directed to
markets in the US. Since 2019 when propane started to be shipped to international markets
in Asia, the distribution of export volumes started to shift between new and existing markets
for Canadian propane.37
36Umeozor and others. In Situ Oilsands Technology Trends
37The US market has historically been the primary export market for Canadian propane. In recent years, a small
volume of propane was exported through the United States to Mexico. The size of these shipments is increasing
31The forecast projects propane exports to non-US destinations to increase. Currently there
are two operating export terminals on the West Coast, RIPET and PRT. In addition, three
new facilities and facility expansions are proposed and awaiting regulatory approval and (or)
a final investment decision (FID):38
• Pembina is examining the opportunity to expand capacity at the PRT. The company
confirmed that engineering work on an expansion project to increase capacity to 45
kb/d is “well advanced”, however, the project is currently listed as deferred according
to July 2021 filings by Pembina – FID is expected by the first quarter of 2022.39 40
• Vopak Pacific Canada (VPC) is a bulk liquids storage terminal proposed by Royal
Vopak. The project would add 40 kb/d storage and export capacity built in the vicinity
of the RIPET and using the same rail infrastructure. LPG could be stored and
exported at this facility.41
• Finally, Pacific Traverse Energy (PTE) has submitted a proposal to build a LPG
export terminal with a design capacity of 46 kb/d constructed near Kitimat, BC.42 This
project is currently under review by the proponent.43 The project design includes a
new rail terminal for offloading LPG connected to a 15 km pipeline which extends to
the export terminal. In a first for the Canadian supply chain, PTE is plans to utilize a
Floating Storage and Offloading Vessel (FSO) to facilitate loading to the transport
vessel.44
If all projects receive regulatory approvals and a positive FID, the incremental export
capacity for propane on the West Coast could rise by around 130 kb/d.45
As more export terminal capacity comes online the destination for exports is shifting away
from the US and toward new overseas markets. Based on the projects with regulatory
approvals and an FID in place, overseas exports will account for 25 per cent of the overall
export market over the outlook period compared to virtually zero as of January 2018 (see
Chart 20).46
in recent years however the total trade remains small compared to the increasing export volumes to overseas
markets. Mexico-Canada exports of propane-by-rail are not a subject of the analysis in this report.
38 “Market Snapshot: New Propane Export Terminal in British Columbia Allows Canadian Propane Direct Access
to Asian Markets.”
39 Pembina Pipeline Corporation, “Management’s Discussion and Analysis, Q2 2021”.
40 Pembina Pipeline Corporation, “Pembina Highlights Growing Momentum with Business Update and Extensive
Opportunity Portfolio”
41 Royal Vopak, “Vopak Pacific Canada”.
42 Pacific Traverse Energy, “Northwestern BC Kitimat LPG Export Project”.
43 Lubberts, “PTE propane project put on hold”.
44 Pacific Traverse Energy. 2021. Northwestern BC Kitimat LPG Export Project.
45 Based on design capacities for VPC, PTE-Kitimat, and the expansion of Pembina’s PRT.
46 Canada Energy Regulator. Commodity Statistics, Natural Gas Liquids
32Chart 20
Canadian Propane Exports, by Regional Source and Destination
(kb/d)
Total U.S. Exports Total Overseas Exports Total Exports
From West From East
250,00
200,00
150,00
100,00
50,00
0,00
e = estimate; f = forecast
Source: The Conference Board of Canada
Total Demand
Canadian propane demand is expected to increase considerably over the outlook—growing
by 55 kb/d by 2030 — relative to 2019 levels (see Chart 21).
Domestic demand and exports will account for nearly equal shares of total propane
disposition by 2030. As domestic demand is projected to increase due to petrochemical and
oil sands sector developments, the completion of LPG terminals in BC will ensure exports to
overseas markets grow and play a more significant role in the outlook.
Non-energy demand will eclipse the share of domestic industrial demand for propane sooner
than anticipated in the previous report. Fuelled Up estimated non-energy demand to exceed
industrial demand after 2023. Updated data for 2017-2019 indicates non-energy demand will
now surpass industrial demand as the largest category by 2022. That year non-energy
applications will account for 39 per cent of total demand, compared to 29 per cent for
industrial demand (see Chart 21).
Exports are also growing rapidly, shifting away from the US towards overseas demand.
From virtually zero shipments in April 2019, marine terminals are expected to export 25 per
cent of total exports forecast for that year. This is a substantial shift in the composition
Canada’s external market for propane. This share will expand as the capacity of West Coast
marine export terminals increases, provided there is midstream capacity to carry propane to
the coast.
33Chart 21
Total Canadian Disposition by domestic end use and export destination
(kb/d)
450
400
350
300
250
200
150
100
50
0
Domestic Wholesale Domestic Retail Total Exports Total Disposition
e = estimate; f = forecast
Source: The Conference Board of Canada
Demand for propane in the energy-use segment continues to grow across industrial,
commercial, agriculture and transportation sectors at a compound annual rate just over 1
per cent from 2020-2030. Residential demand is expected to grow at just under one per cent
growth annual over the same period. This reflects slower growth, between 0.1 and 0.2 per
cent, for each of these demand sectors compared to the previous forecast in Fuelled Up.
34Section 2
Propane Pricing and Market
Dynamics in Canada
35Prices and the Propane Supply Chain in
Canada
Propane prices vary between different regions of the country, times of the year and level of
the supply chain. The cost of propane at any point along the supply chain reflects product
cost plus margin for the seller. When the price of fuel in one market falls above or below the
price in another over time, the differential reflects an imbalance, an arbitrage opportunity for
the owners of propane in the surplus market to sell fuel at a higher price into the – so long
as they can secure the midstream transportation in time and at the right price.
This price-as-signal dynamic is at play in each of the major trends identified in Section 1 of
this report: exports to overseas markets are surging because high propane prices in Asia
and low propane prices in Edmonton signalled to midstream investors that there was a
significant opportunity building to move propane from Edmonton to the West Coast.
Similarly, low prices for propane in Edmonton signalled to the Government of Alberta and to
private industry the opportunity to take low-cost, surplus propane in Edmonton and convert it
into high-value PP plastic by backing the construction of PDH facilities..
In short, prices and supply chain dynamics are intricately linked. Market dynamics shape the
supply chain infrastructure just as emerging market opportunities along the supply chain,
send signals back to the market over time.
This section is not an in-depth discussion on pricing. Pricing and pricing mechanisms are not
within the public realm. This was to be expected. The contractual environment that “prices”
the supply chain limits releasing details. Therefore, this section aims to provide an overview
only of the complexity and challenges pricing can exert on the propane supply chain.
Propane prices
Propane prices vary depending upon whether fuel is purchased from production plant
terminal hubs, a wholesaler, or a retail distributor. The price paid at any level of the market
reflects the accumulated cost and profit of the propane supply chain. Propane prices are
typically determined using a cost-plus model that sets the price for fuel equal to the cost of
the product, plus cost of transportation and storage, plus the margin taken by the seller.47
Spot Prices
The spot price is the basic unit of the cost-plus model for propane in North America. Spot
prices reflect the upstream cost of extracting NGL and crude, midstream transportation
costs, and the cost of producing the propane via fractionation or refinery processing. The
47 OPIS, Glossary Terms, “Cost-plus”.
36You can also read