Can Social Media Rhetoric Incite Hate Incidents? Evidence from Trump's "Chinese Virus" Tweets
←
→
Page content transcription
If your browser does not render page correctly, please read the page content below
Can Social Media Rhetoric Incite Hate Incidents?
 Evidence from Trump’s “Chinese Virus” Tweets

 By ANDY CAO, JASON M. LINDO, AND JIEE ZHONG*

 We investigate whether Donald Trump's "Chinese Virus" tweets
 contributed to the rise of anti-Asian incidents. We find that the number of
 incidents spiked following Trump’s initial “Chinese Virus” tweets and the
 subsequent dramatic rise in internet search activity for the phrase.
 Difference-in-differences and event-study analyses leveraging spatial
 variation indicate that this spike in anti-Asian incidents was significantly
 more pronounced in counties that supported Donald Trump in the 2016
 presidential election relative to those that supported Hillary Clinton. We
 estimate that anti-Asian incidents spiked by 4000 percent in Trump-
 supporting counties, over and above the spike observed in Clinton-
 supporting counties.

 1. Introduction
 Just how far-reaching is the influence of high-profile individuals and what sorts of
behaviors can they alter? Research has shown that high-profile individuals can affect consequential
pro-social behaviors like interest in preventative health care (Fendrick et al., 2003; Evans et al.,
2014; Roberts and Dusetzina, 2017; Alatas et al., 2019) and voting (Jackson and Darrow, 2005;
Austin, Pinkleton, and Epstein, 2008; Garthwaite and Moore, 2012; Chou, 2015; Xiong,
forthcoming). In this paper, we investigate whether this sort of influence can extend to anti-social
behaviors as well. The answer to this question is increasingly relevant given ongoing debates about
restrictions on the freedom of speech in instances in which that freedom may cause harm. Perhaps
most visible among these recent debates is President Donald Trump’s use of social media prior to
the storming of the United States Capitol, followed by his subsequent suspensions from Twitter
due to concerns about “further incitement of violence” (Needleman, 2021) and from Facebook,

*
 Cao (andycao@tamu.edu): Department of Economics, Texas A&M University; Lindo (jlindo@tamu.edu):
Department of Economics, Texas A&M University, NBER, and IZA; Zhong (jieezhong@tamu.edu): Department of
Economics, Texas A&M University. Authors are ordered alphabetically by last name following the convention in
economics publishing. Corresponding author: Zhong. We gratefully acknowledge Thomas Fujiwara, Karsten
Müeller, and Carlo Schwarz for sharing their data on the number of Twitter users across counties, the Stop AAPI
Hate reporting center for making available their data on anti-Asian incidents, and Bing He, Caleb Ziems, Sandeep
Soni, Naren Ramakrishnan, Diyi Yang, and Srijan Kumar for making available their code and data. We also thank
Andrew Barr and Daniel Sturm for their detailed comments.
Instagram, Snapchat, and Twitch due to similar concerns (Tyko, 2021). 1 Facebook has
subsequently changed its policies to allow less leniency for public figures and will consider
reinstating his accounts in January 2023 “when it will look to experts to decide whether the risk to
public safety has receded”; in the meantime, Trump has asked federal courts to require Twitter to
reinstate his account on the grounds of unfair censorship (Isaac and Frenkel, 2021; Polantz, 2021).
While it is infeasible to disentangle the contribution of Trump’s speech from other factors that may
have contributed to the Capitol Hill violence, the president’s earlier use of Twitter during less
volatile and consequential periods provides an opportunity to understand whether the speech of
high-profile individuals may incite anti-social behavior more generally. Towards this end, in this
study we consider whether President Donald Trump's remarks about China on Twitter during the
COVID-19 pandemic led to an increase in the number of anti-Asian incidents in the subsequent
days.
 Our analysis focuses on incidents that occurred around the time Trump began attributing
COVID-19 to China. We use data on incidents from the Stop AAPI Hate reporting center, which
tracks incidents of hate, violence, harassment, discrimination, shunning, and child bullying against
Asian Americans and Pacific Islanders in the United States (Jeung et al., 2021).2 Our analysis of
national trends shows an extremely large spike in incidents on March 20, 2020. We argue that this
spike is indicative of a causal effect of Trump’s influence given its timing relative to Trump’s
initial references to the “Chinese Virus” (one tweet on March 16, another on March 17, followed
by four on March 18), which were followed by a spike in the number of anti-Asian Covid-19
tweets on March 19 (He et al., 2020). Further supporting this interpretation of the results, we show
that Google search queries for “Chinese Virus” also spiked on March 19, the day before the spike
in anti-Asian incidents; that “Trump” and “Trump Chinese Virus” are the search queries most
closely related to search queries for “Chinese Virus.” Moreover, in difference-in-differences and
event-study analyses leveraging spatial variation, we find that the spikes in anti-Asian Covid-19
tweets and anti-Asian incidents are more pronounced in counties that supported Donald Trump in
the 2016 presidential election relative to those that that supported Hillary Clinton.

1
 More recently, Twitter permanently suspended Marjorie Taylor Greene’s personal account in January 2022 for
repeated violations of its COVID-19 misinformation policy (Garner and Hornberger 2022).
2
 Jeung (2020) provides victim narratives describing these types of incidents for incidents reported through March
25, 2020.

 2
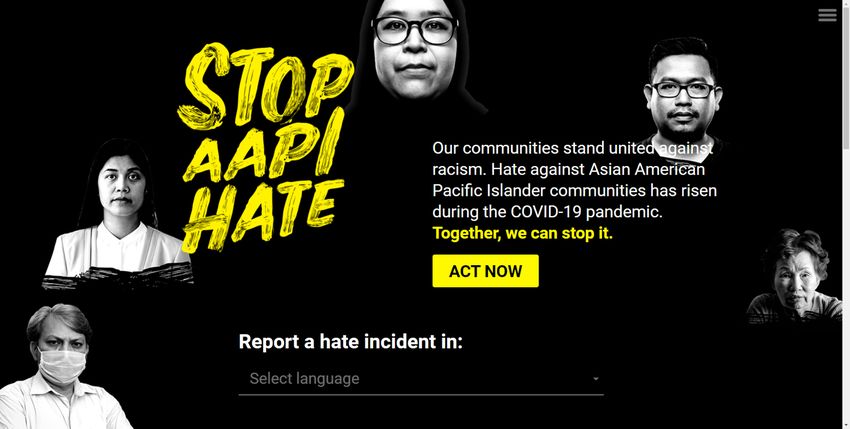
Our work complements a handful of other studies that have examined anti-social effects of
the specific content disseminated through media, including research showing that radio
programming in Rwanda calling for the extermination of the Tutsi minority had a significant
impact on participation in killings by militia groups and ordinary civilians (Yanagizawa-Drott
2014); that radio content incited anti-Semitic and pro-Nazi acts by ordinary citizens (Adena et al.
2015 and Wang 2021); and that the fictional portrayal of the KKK in the film The Birth of a Nation
caused lynchings and race riots in the United States in the early 20th century (Ang 2020). Our work
also complements recent research on social media showing that county-level Twitter penetration
reduced the Republican vote share in the 2016 and 2020 presidential elections without having any
effects on Congressional elections and previous presidential elections (Fujiwara, Müeller, and
Schwarz 2021).
 The remainder of this paper is organized as follows. In the next section, we describe the
data on reports of anti-Asian incidents. We then discuss the context surrounding Trump’s “Chinese
Virus” tweets and national trends in Section 3. Section 4 presents the results of our analyses
comparing Trump-supporting counties and Clinton supporting counties. In subsequent sections,
we consider mechanisms, discuss the limitations of our analyses, and conclude.

 2. Reports of Anti-Asian Incidents
 Since the Coronavirus outbreak in 2020, the number of reported anti-Asian hate crime
incidents has risen dramatically among most major cities in the United States, including New York
City which saw an 833% increase in racially motivated crimes against Asian Americans (Center
for the Study of Hate and Extremism, 2021). This is of particular concern because Asian
Americans are one of the most highly urbanized segments of the U.S. populations, with
approximately 95 percent living in urban areas (Population Reference Bureau, 2004).
 Our analysis of Anti-Asian incidents is based on self-reports of incidents to the “Stop AAPI
Hate” Reporting Center, from the beginning of 2020 through April of 2020. The Stop AAPI Hate
webpage (stopaapihate.org) has a very simple layout that allows visitors to immediately begin
reporting an incident (Appendix Figure A1). Those reporting incidents are asked a total of 18
questions including: the date the incident occurred, the kind of incident they experienced (based
on 10 categories), and their state and zip code, in addition to other details about their experience,
demographics, and contact information.

 3
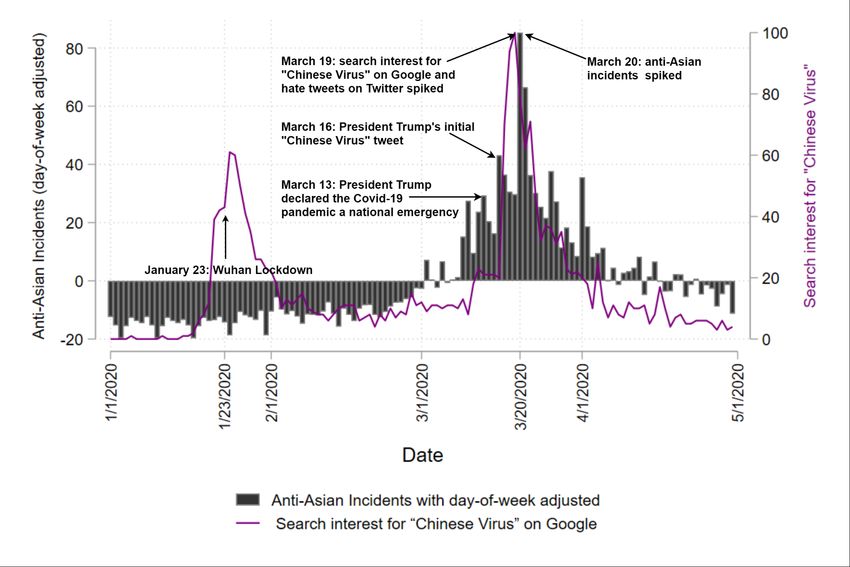
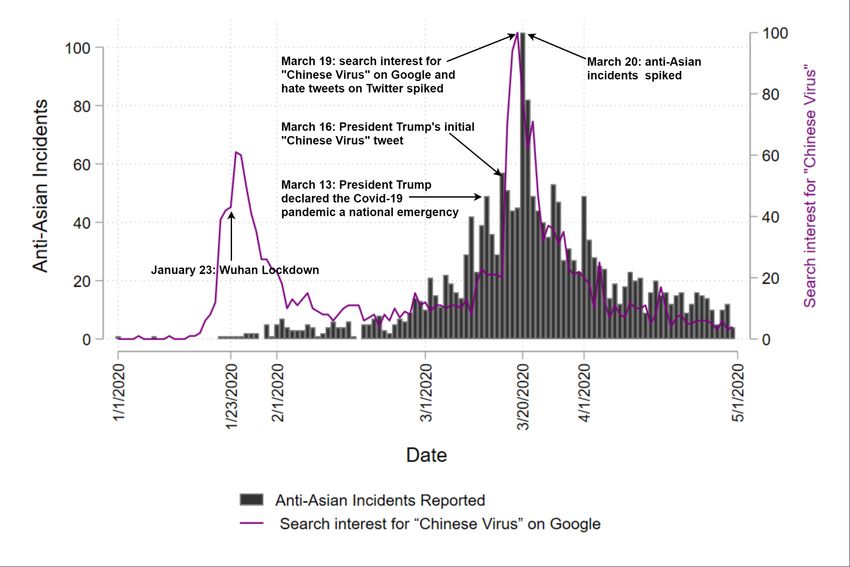
In terms of the subcategories comprising these incidents, 54 percent involved verbal
harassment or name-calling, 18 percent involved avoidance/shunning (e.g., deliberate avoidance
of, distancing from, or social rejection for racial/ethnic group), 12 percent involved physical
assault (including being coughed or spat on), 4 percent involved a workplace discrimination, 3
percent involved refusal of service (at a business establishment, public transit, or private
transportation such as ride-share services), and 2 percent involved online misconduct, with the
remaining 8 percent of incidents in other categories.3 Moreover, nearly all the incidents in our data
were reported by victims who directly experienced an incident in person. This is a key distinction
from studies that have considered online hate speech, such as He et al. (2020), which is usually
not directed at any specific individual and may not be seen by members of the disparaged group.
 Though we expect these data to substantially understate the degree to which these incidents
occur across the United States, we view them as providing a useful proxy for such incidents. We
discuss the limitations of these data—and the implications for the interpretation of the results of
our analyses—in Section 6.

 3. Context and National Trends
 Figure 1 shows the number of incidents reported as occurring on a given date (not the date
of the report) from January 2020 through May 2020. For context, Figure 1 also plots a measure of
(US-based) web search activity for “Chinese Virus” based on Google Trends4 and Table 1 provides
a timeline of significant events related to the pandemic and the use of potentially stigmatizing
language. We discuss the patterns in these data in the following subsections. Note that similar
patterns are evident if daily incident counts are adjusted so that they are relative to the average
number observed on the same day of the week over the analysis window (Appendix Figure A3).
They are also similarly evident in urban areas and rural areas (Appendix Figure A4).

3
 These category descriptions are shown to individuals reporting incidents. See Appendix Figure A1.
4
 Google Trends provides access to search requests made to Google. The data is aggregated and normalized. Each
data point is divided by the total searches of the geography and time range it represents to compare relative
popularity. The resulting numbers are then scaled on a range of 0 to 100 based on a topic’s proportion to all searches
on all topics.

 4
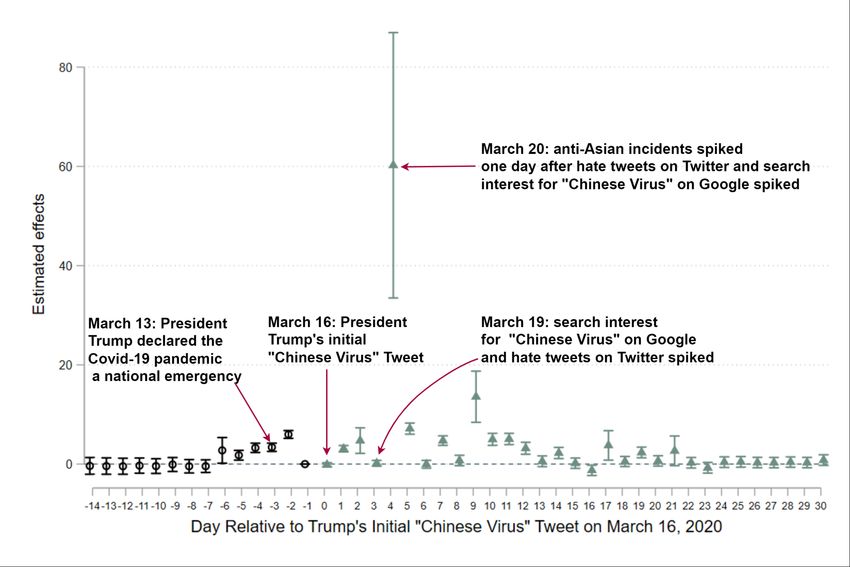
Figure 1
 Anti-Asian Incidents and Google Search Interest in “Chinese Virus” Over Time

Notes: This figure plots the trend in anti-Asian incidents and the popularity of the term "Chinese Virus" against a timeline.
The bars in gray show the number of hate incidents reported as having occurred on a given day. Hate incidents include
both hate crimes as well as hateful acts that are not legally defined as crimes, such as verbal harassment, shunning,
and refusal of service at restaurants. The purple line chart shows the interest over time for the term "Chinese Virus" on
Google. Numbers represent search interest relative to the highest point (100) on the chart for the given time in the
United States. Data are from "Stop AAPI Hate" and Google Trends.

 Table 1
 Timeline of Events
Date Event
1/23/2020 Chinese authorities lockdown Wuhan
1/30/2020 WHO declares coronavirus an international emergency
2/3/2020 U.S. declares public health emergency
2/11/2020 WHO issues guidance to use “coronavirus” and “COVID-19,” and to avoid “stigmatizing”
3/1/2020 The first case of COVID-19 in New York during the pandemic is confirmed
3/6/2020 US Secretary of State Pompeo uses “Wuhan virus” on Fox and Friends and CNBC
3/8/2020 US Congressman Paul Gosar uses "Wuhan virus" on Twitter
3/9/2020 US Congressman Kevin McCarthy uses “Chinese coronavirus” on Twitter
3/11/2020 WHO declares COVID-19 a pandemic
3/13/2020 President Trump declares the Covid-19 pandemic a national emergency
3/16/2020 Trump's initial “Chinese Virus” Tweet
3/17/2020 Trump's second “Chinese Virus” Tweet
3/18/2020 Trump has four “Chinese Virus” Tweets on this single day
 Trump uses ‘Chinese Virus” in a press conference and responds ‘it’s not racist at all’ when
3/19/2020 asked; hate tweets spike on Twitter; Google search queries for Chinese virus spike
3/20/2020 Anti-Asian incidents spike
Sources: The American Journal of Managed Care Staff (2021), Darling-Hammond et al., (2020), He et al., (2020).

 5
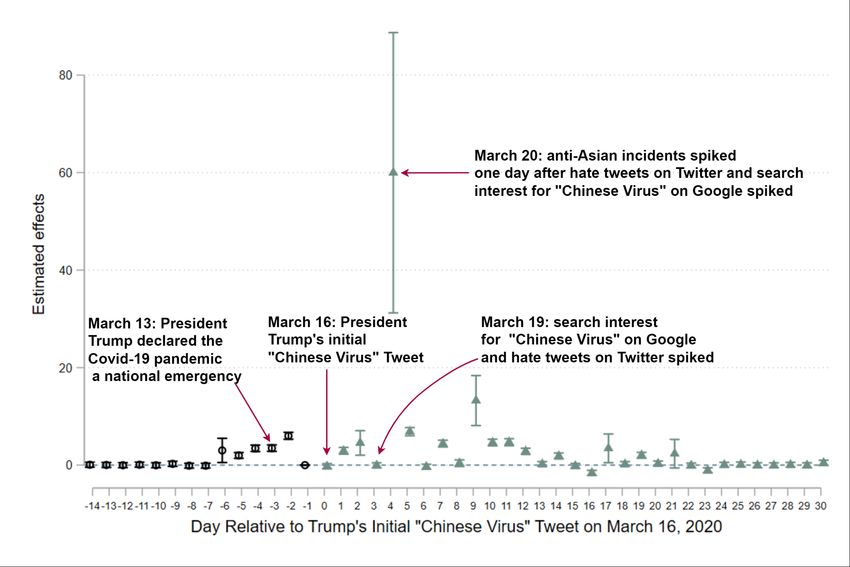
3.1 Before Trump's initial "Chinese Virus" tweet
 The number of incidents was fairly stable from late January throughout most of February
and then began to rise rapidly towards the end of February and into March. Over this period of
time, concerns about the pandemic were escalating as the virus spread throughout China and then
to other parts of the world. On January 23, Chinese authorities implemented a lockdown for the
city of Wuhan. One week later, the World Health Organization declared the virus an international
emergency. Days later, the United States declared a public health emergency. These data show a
growing number of incidents over time, a dramatic spike on March 20, and a subsequent decline.
 Google Trends shows a rise and fall in search queries for “Chinese Virus” around the time
of the Wuhan lockdown. This fact highlights that this term was in use well before Trump used the
term in public. Recognizing the potential for this sort of language to do harm, on February 11 the
World Health Organization recommended the use of “coronavirus” and “COVID-19” to describe
the virus instead of potentially stigmatizing alternatives (World Health Organization 2020).
Having already fallen from its earlier levels around the time of the Wuhan lockdown, search
interest for “Chinese Virus” remained steady throughout most of February and the first half of
March. This is particularly notable in light of the fact the first case of COVID-19 in the United
States was confirmed on March 1 and some U.S. political officials used the terms “Chinese Virus”
and “Wuhan Virus” in public during this period of time.5

 3.2 Trump's initial “Chinese Virus” tweets and the immediate aftermath
 On March 13, Donald Trump declared a national emergency concerning the COVID-19
pandemic. On March 16, he used the term “Chinese Virus” for the first time in public, in a tweet
about his intent to support industries affected by the pandemic.6 A day later he used the term again,
this time in the context of highlighting that the effects of the pandemic varied across states (in an
apparent effort to argue for state-specific responses rather than a federal response). One day later,

5
 Specifically, on March 6, the former Secretary of State Mike Pompeo was interviewed on Fox and Friends, a
morning news show hosted by Fox News Channel. During the interview, Pompeo repeatedly addressed the
coronavirus as the “Wuhan Virus” in addition to criticizing the Chinese government for lack of transparency and
false information. This marked the first time that anyone from the Trump administration used such language in
public. Congressman Paul Gosar also used the term “Wuhan Virus” on Twitter on March 8 and congressman Kevin
McCarthy used the term “Chinese coronavirus” on Twitter on March 9.
6
 Data for Trump’s tweets is collected from Trump Twitter Archive. This archive checked Twitter every 60 seconds
to record every Trump tweet into a database.

 6
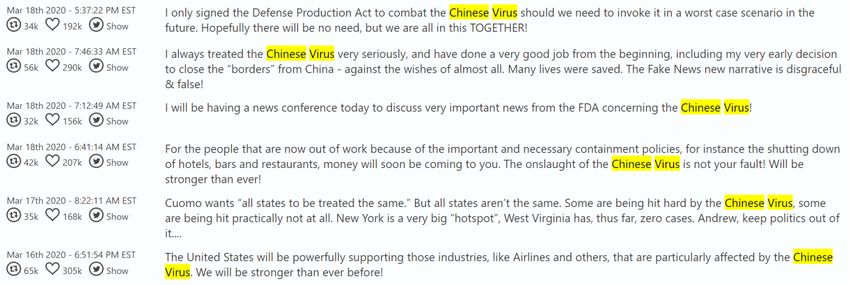
there was a marked increase in the intensity with which Trump used potentially inflammatory
language. In particular, he used the term “Chinese Virus” in four separate tweets on March 18.
Moreover, in this set of tweets Trump: referenced the “onslaught of the Chinese Virus”; stated that
it was “not your fault!” to people who were out of work; stated that he did “a very good job…to
close the ‘borders’ from China”; and explained that he “signed the Defense Production Act to
combat the Chinese Virus.” The full text of these tweets is shown in Figure 2.
 These tweets would have been seen by a very large number of Americans.7 Surveys before
the pandemic indicate that 19 percent of adult Twitter users in the United States “followed” Trump
on Twitter, including 31 percent of Republicans and 13 percent of Democrats (Wojcik, Hughes,
and Remy, 2019). Naturally, many more people are exposed to Trump’s tweets via retweets, quote
tweets, media coverage, and personal interactions. Relative to Trump’s other original tweets during
this period of time, Trump’s first tweets referring to the “Chinese Virus” were popular. Trump
posted 35 original tweets from March 16 to March 18 and these tweets averaged 146,737 likes and
29,196 retweets. His tweets referring to the “Chinese Virus” exceeded these numbers with an
average of 185,956 likes and 38,907 retweets.8
 The next day, on March 19, Trump used the term on television for the first time—in a
coronavirus taskforce press conference—and declared “it’s not racist at all” when confronted by a
reporter. This instance led to especially heightened attention because photos from the press
conference showed that his notes had “corona” and “coronavirus” crossed out and replaced with
“Chinese” (Smith, 2020).
 Web-based search queries for “Chinese Virus” began to spike the day after Trump first
used the term in public and reached an apex on March 19, the same day he used the term in a press
conference and the day after he used the term in four separate tweets (Figure 1). While it is possible
that this timing could be coincidental, Google Trends data on related queries (Table 2) suggests
that this is highly unlikely. In particular, Google Trends information on “related queries” captures
the degree to which users search for different terms during a search session.9 Based on these data,

7
 Notably, over this period of time U.S. media coverage of COVID-19 arguably focused disproportionately on
Trump, and was more negative in tone compared to non-U.S. media (Sacerdote, Sehgal, and Cook 2020).
8
 Trump also retweeted 65 times over these days. Including these retweets, his 100 posts on Twitter across these
days averaged 51,358 likes and 14,492 retweets. All of these numbers are authors’ calculations.
9
 Google does not disclose how they define a search session. Generally, a search session consists of all the search
requests from a user within a given timeframe. A session lasts until there's inactivity. A common value for the
inactivity threshold is 30 minutes and is sometimes described as the industry standard.

 7
searches for “Chinese Virus” were not strongly associated with Trump before he used the term in
public. From the beginning of the year through March 15, the top five search queries related to
“Chinese virus” were: corona virus, Chinese corona virus, coronavirus, Chinese virus 2020, and
China virus. This changed after Trump’s used the term on March 16. From March 16 to March 20,
the top search queries related to searches for “Chinese Virus” were: Chinese virus Trump, Trump,
the Chinese virus, Donald Trump Chinese virus, and Trump Twitter. From March 21 through the
end of April, searches for “Chinese virus Trump” continued to be among those most closely related
to searches for “Chinese virus,” only trailing “the Chinese virus.”
 Along similar lines, data from He et al. (2020) shows that the number of hateful anti-Asian
COVID-19 tweets from Twitter users in the United States began to spike the day after Trump first
used the term in public (Figure A2).10 Moreover, the number of such tweets reached its highest
point on the same day as the searches for “Chinese Virus.”11
 As shown in Figure 1, the very next day (March 20) there is a clear and dramatic spike in
the number of anti-Asian incidents, 125.35% percent higher than the day prior. Though the number
of incidents remains elevated the following day (March 21) they subsequently return to prior levels.
This pattern is consistent with the pattern of ant-Asian hate speech observed on Twitter (Figure
A2). Trump faced criticism for his use of this term in subsequent days, he did not use the term in
his next press conference, and on March 23 he tweeted “it is very important that we totally protect
our Asian American community in the United States, and all around the world.”
 The same general pattern in incidents is evident for verbal harassment or name-calling
(Figure A5, Panel A) and avoidance/shunning (Figure A5, Panel B), i.e., the two most frequent
incident types. Patterns are more difficult to discern for less-frequent incident types (Figures A6
through A7), such as physical assault, workplace discrimination, refusal of service, and online
misconduct. That said, we note that the daily high for incidents of physical assault coincided with

10
 He et al. (2020) constructed this dataset by collecting all covid-related tweets using keywords such as “covid” and
“corona” and then classifying which tweets involved anti-Asian hate. The latter was done using a classifier that was
trained on a subset of hand-labeled tweets using machine learning.
11
 Along similar lines, Hswen et al. (2021) document that half of tweets with the hashtag #chinesevirus showed anti-
Asian sentiment versus one fifth of tweets with the hashtag #covid19; that anti-Asian sentiment in tweets with these
hashtags was greater the week after March 16 than the week before; and that this growth in anti-Asian sentiment was
significantly larger for tweets using the hashtag #chinesevirus. In addition, Crisis Text Line, a group that provides
free mental health support via text message, saw a 50% increase in texts received from people identifying as Asian
the week of March 16, after that number of texts had remained fairly stable at around 2,200 per week during the
preceding month (Fernández Campbell and Ellerbeck 2020).

 8
the day that Trump first used “Chinese Virus” publicly and the second daily high coincided with
the spike in incidents overall (Figure A6, Panel A).

 Figure 2
 Trump Initial Tweets Referencing the “Chinese Virus”

 Table 2
 Top search queries from the United States related to searches for "Chinese Virus"

 1/1/20 - 3/15/20 3/16/20 - 3/20/20 3/21/20-4/30/20
 corona virus (100) chinese virus trump (100) the chinese virus (100)
 chinese corona virus (98) trump (98) chinese virus trump (83)
 coronavirus (59) the chinese virus (45) new chinese virus (30)
 chinese virus 2020 (36) donald trump chinese virus (11) donald trump chinese virus (2)
 china virus (29) trump twitter (6)
Notes: Each column displays Google Trends "top search queries" related to searches for "Chinese Virus" over the
specified period of time, based on different queries that occur in the same "search session." Numbers in parentheses
represent the degree to which searches for the phrase are related to searches for "Chinese Virus" during the same
search session, on a Google Trends 0-100 scale. This analysis focuses on US-based searches only.

 9
4. Estimates Comparing Trump- vs Clinton-Supported Counties
 If the spike in incidents is a result of Trump’s influence, we would expect to see a larger
spike in anti-Asian behavior in areas where Trump has greater support.
 To investigate this, we compare counties won by Donald Trump in the 2016 presidential
election relative to those won by Hilary Clinton.12 We focus on incident rates per 100,000 Asian
residents for counties with at least one incident reported following January 1, 2020.13 In Figure 3,
we show how this incident rate changed over time, separately for Trump-supported and Clinton-
supported counties. For comparison, we also show how hateful anti-Asian COVID-19 tweets
changed over time across these sets of counties.14 For both Trump-supported counties and Clinton-
supported counties, these figures show a spike in anti-Asian COVID-19 tweets following Trump’s
initial “Chinese virus” tweet, which was followed by a spike in anti-Asian incidents. Both spikes
are larger in Trump-supported counties. County-level averages for the two weeks before and after
Trump’s initial “Chinese virus” (Table A1) show a similar pattern of elevated incidents (and anti-
Asian COVID-19 tweets) that is larger in Trump-supported counties than in Clinton-supported
counties.
 A difference-in-differences estimate based on the same county averages indicates that anti-
Asian Covid-19 tweets spiked by 11.9 per 100,000 Asian residents in Trump-supported counties,
over and above the increase observed in Clinton-supported counties.15 Put in other terms, anti-
Asian tweets spiked 235 percent more in Trump-supported counties than in Clinton-supported
counties. Similar calculations indicate that anti-Asian incidents spiked by 58.7 per 100,000 Asian
residents in Trump-supported counties, over and above the increase observed in Clinton-supported
counties. Again put in other terms, anti-Asian incidents spiked by over 4000 percent more in
Trump-supported counties than in Clinton-supported counties.

12
 Election outcomes are from the New York Times: https://www.nytimes.com/elections/2016/results/president.
13
 Data on the number of Asian residents are 2019 estimates from the U.S. Census Bureau, data series CC-
EST2019-ALLDATA-[ST-FIPS].
14
 These are from the same Twitter data described above, with counties geocoded based on the latitude and
longitude of each tweet. Note that not all tweets have this information because users can turn off the GPS option
from their settings. Since it is unlikely that users would do so in a manner coinciding with Trump’s “Chinese virus”
tweets, we do not think this is a serious issue for our purposes.
15
 This calculation reflects the day-of-spike average for Trump-supported counties minus the pre-“Chinese Virus”
tweet average for Trump-supported counties (22.389 - 2.971 = 19.418), minus the same difference for Clinton-
supported counties (9.289-1.790 = 7.499).

 10
Figure 3
Daily Anti-Asian Incidents and Anti-Asian COVID-19 Posts on Twitter,
 Based on County Support of Trump vs Clinton in 2016 Election

 Panel A: Trump-Supported Counties

 Panel B: Clinton-Supported Counties

 11
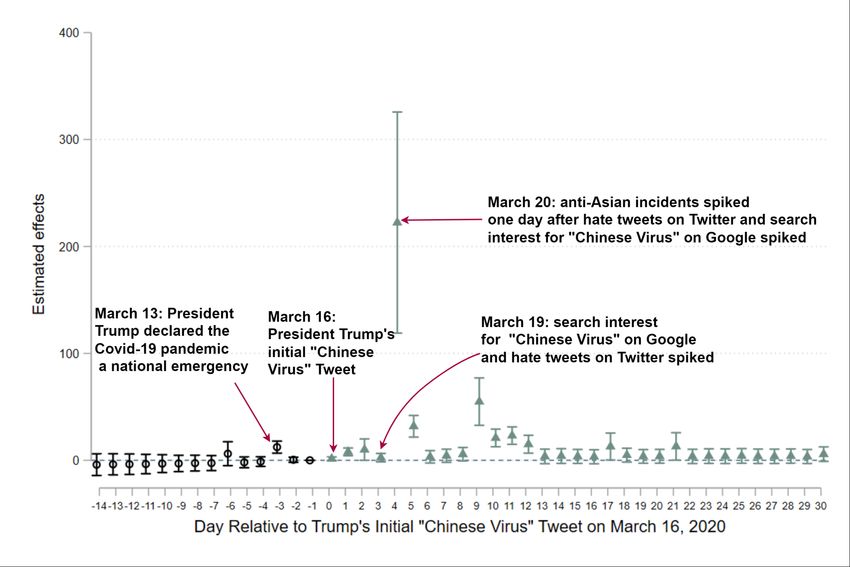
We also investigated this issue with an event-study specification that compares how anti-
Asian behavior changes over time in Trump-supported counties relative to Clinton-supported
counties, using data on incidents from 14 days before Trump’s first “Chinese Virus” tweet through
30 days after that tweet. We estimate the following specification via ordinary least squares:

 !" = ∑#$%&
 #'(),#+'( # 2016! × ( = " − 16) + !" + ! + " + !" .

The outcome variable !" is the number of anti-Asian incidents that occurred on a particular day
in a particular county per 100,000 Asian residents. We include county fixed effects ! , which
control for fixed differences across counties in the rate of anti-Asian behavior, and date fixed
effects " , which control for changes over time in the rate of anti-Asian behavior experienced in
all counties. We also control for the logarithm of daily Covid-19 cases (cumulative) across counties
and over time, which allows for within county changes in the spread of the virus to influence anti-
Asian behavior directly, though the estimates are nearly identical if this control variable is
omitted. 16 We are primarily interested in the coefficients # on the interactions between an
indicator variable for whether a county supported Donald Trump in the 2016 presidential election
( 2016! ) and k indicator variables ( = − 16) for being k days from March 16, the
date of Trump’s first tweet to mention “the Chinese virus.” This set of coefficients reflects the
degree to which anti-Asian incidents are differentially elevated for Trump-supporting counties
relative to other counties k days from Trump’s tweet, over and above differences that are expected
based on the differences that are observed across counties at other times, the changes observed
across all counties over time, and the changes that are expected based on the fluctuating number
of Covid-19 cases within counties over time.17 Given that Trump’s tweets may have also affected
Clinton-supporting counties (as suggested by the results shown in Figure 3 and Table A1), these
coefficient estimates may understate the overall effect on anti-Asian incidents.
 Figure 4 plots the resulting # estimates, with circles representing estimates corresponding
to days before Trump’s first “Chinese virus” tweet and triangles representing estimates

16
 Covid data are from the COVID-19 Data Repository by the Center for Systems Science and Engineering (CSSE)
at Johns Hopkins: https://github.com/CSSEGISandData/COVID-19/tree/master/csse_covid_19_data.
17
 Following Cameron, Gelbach, and Miller (2011), the 95% confidence intervals we report are based on two-way
clustered standard error estimates that allow errors to be correlated within counties over time and also across
counties on the same date.

 12
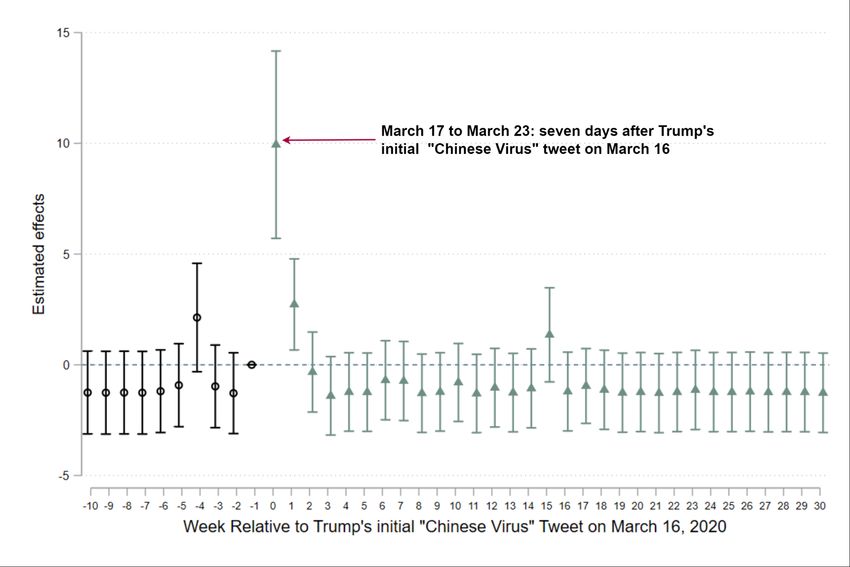
corresponding to subsequent days.18 The estimated effects are largely close to zero for the days
before Trump’s first “Chinese virus” tweet, and even on the day of that tweet, indicates similar
pre-tweet trends in anti-Asian incidents between counties with greater and lesser support for
Donald Trump. Following the president’s initial tweets (one on March 16, another on March 17,
and four on March 18) and the subsequent spike in anti-Asian tweets and “Chinese virus” searches
(on March 19), there is a large spike in the rate of anti-Asian incidents in counties that supported
Donald Trump in the 2016 presidential election relative to those that supported Hilary Clinton.
Indeed, the point estimate indicates an additional 60 out of every 100,000 Asians reported being
victimized in Trump-supporting counties, over and above changes in Clinton-supporting counties,
which is nearly identical to the difference-in-differences estimate reported above.
 When we exclude counties in which the vote share was evenly split between Trump and
the other candidates, and thus increase the contrast in support for Donald Trump across groups in
our sample, we see even larger relative spikes in reported anti-Asian behavior in Trump-supporting
counties.19 An analysis by week (instead of day) illustrates that this spike was not just a shift in
the timing of incidents that might have otherwise happened at a slightly later date. Specifically,
there was a relative spike in anti-Asian incidents in Trump-supporting counties the week following
Trump’s initial tweets, it remained elevated the following week, and then fell back to parallel the
trend in Clinton-supporting counties (Figures A12 and A13).20
 Just as nationwide trends in overall incidents were mirrored by incidents of verbal
harassment or name-calling and avoidance/shunning, our analyses of Trump- and Clinton-
supporting counties indicates that the general pattern for overall incidents (Figure 4) is mirrored
in analyses of verbal harassment or name-calling and avoidance/shunning (Figure A13, Panel A).
That said, the estimated effect on shunning is an order of magnitude larger than the estimated effect
on verbal assault. We also find significant effects on the very same day for refusal of service

18
 See Appendix Figure A9 for estimates based on the specification that omits the control for Covid-19 cases.
19
 Relative to these estimates using all counties, Appendix Figure A10 shows a spike nearly twice as large if the
analysis excludes counties where the share voting for Donald Trump was 40-60 percent and a spike more than three
times as large if the analysis excludes counties where the share voting for Donald Trump was 30-70 percent.
20
 We note that the weekly estimates depicted in this figure are flat and virtually identical for weeks -10 to -2 and
weeks 3-30, which supports the common trends assumption that the analysis replies upon. We note that these
estimates are not centered on zero, however, because incidents rose slightly more in Trump-supporting counties than
Clinton-supporting counties in the week prior to Trump’s first “Chinese Virus” tweet (which serves as the omitted
period for the event-study specification), which was also evident in Figure 4.

 13
(Figure A14, Panel A). There is little evidence of effects on physical assault, workplace
discrimination, or online misconduct (Figure A15, Panel B and Figure A15).21

 Figure 4
 Estimated effects on anti-Asian incidents in Trump- vs Clinton-Supported Counties

Notes: This figure plots the estimated effects of Trump's initial “Chinese virus” tweet on anti-Asian incidents in counties
that supported Trump in 2016 versus those that supported Clinton. Estimates control for the logarithm of the total
number of Covid-19 cases plus one, county fixed effects, and date fixed effects. The outcome variable is the number
of anti-Asian incidents per 100,000 Asian residents. Data, restricted to incidents fourteen days before Trump’s initial
“Chinese virus” tweet and 30 days after that tweet, are from the Stop AAPI Hate database. Confidence intervals are
based on two-way standard-error estimates allowing for clustering within counties over time and across counties on
the same date (Cameron, Gelbach, and Miller, 2011).

21
 There is perhaps some evidence of an effect on the following day for incidents in the “other” category
(Figure A15, Panel C).

 14
5. Mechanisms
 In terms of the mechanisms underlying these effects, one may wonder if the difference-in-
differences and event-study estimates may have resulted from differential exposure to Trump’s
“Chinese virus” tweets as opposed to differential responses conditional on exposure. We have
investigated this possibility in several ways. First, we used Twitter-usage data from Fujiwara,
Müeller, and Schwarz (2021), generously shared by the authors, to calculate the number of Twitter
users identified in each county from 2014-2015. We calculate an estimated 2,390,091 Twitter users
in Clinton-supported counties versus 402,202 in Trump-supported counties (among counties with
at least one reported anti-Asian incident in 2020). Thus, while imperfect, this evidence suggests
that the disproportionate spike in incidents in Trump-supported counties was not driven by greater
exposure to his tweets in such counties.22
 Along similar lines, we have also investigated how media outlets outside of Twitter may
have contributed to propagating the effects we identify. We did so using Nexis Uni (formerly
LexisNexis Academic) to identify the number of media outlets using the phrase “Chinese Virus”
each day. These data (depicted in Figure 5) show that it was very infrequently used in newspapers,
newswires, TV/radio (wires), and online prior to Trump’s tweets. They also show a massive
increase immediately after Trump’s tweets, which gradually declined in the following months. A
similar trend is evident for use in the New York Times and CNN (Figure 5), which we interpret as
evidence of widespread exposure to the phrase “Chinese virus” beyond Trump supporters.
 One might also wonder if the apparent effects of Trump’s “Chinese Virus” tweets resulted
from a heightened media attention to those particular tweets relative to his other tweets. However,
there are no apparent irregularities in the number media outlets mentioning both “Trump” and
“Twitter” around that time (Figure A16). Along similar lines, the frequency with which Trump
was tweeting was not irregular at that time (Figure A17).

22
 We recognize that it is likely that per-user exposure to Trump’s tweets is likely to be higher in Trump-supported
counties than Clinton-supported counties. That said, Twitter users in Trump-supported counties would have to be 84
percentage points more likely to be exposed to his tweets than Twitter users in Clinton-supported counties in order
to be more numerous than those exposed to his tweets in Clinton-supported counties.

 15
Figure 5
 Media Outlets using the phrase “Chinese virus”

Note: The red vertical lines are drawn the date of Trump’s first “Chinese virus” tweet (3/16/2020). New York Times
mentions include the newspapers only while CNN mentions include newswires, transcripts, and web.

 Closely related, but regarding a potential confounder rather than a mechanism, the
differences we observed across Trump- and Clinton-supported counties could result from
differences in concerns about COVID-19 across these counties. That said, as we noted above, these
estimates are robust to the inclusion of county-day controls for COVID-19. Whereas that approach
captures changes in local concerns to a degree, it leaves open the possibility that differences in
more-general concerns about COVID-19—perhaps propagated by national media sources—may
have changed differently for Trump- and Clinton-supported counties in a way that could explain
the differences in described in the previous section. We investigated this possibility by evaluating
search interest for “Covid” in the state where Trump received the greatest support in the 2016
presidential (West Virginia) versus search interest for “Covid” in the state where Clinton received
the greatest support (California). As shown in Figure 6, search interest for “Covid” began to
increase rapidly in both states before Trump’s initial “Chinese Virus” tweet and increased

 16
somewhat more rapidly in California than West Virginia between the time of that tweet and the
spike in anti-Asian incidents. Given these empirical regularities, we think it is unlikely that
differences in general concerns about COVID-19 explain the spike in anti-Asian incidents in
Trump-supported counties relative to that observed in Clinton-supported counties.

 Figure 6
 Trends in general interest in “Covid”

Note: Google Trends search interest data are standardized so that 100 represents peak search interest. This has
been done separately for California and W. Virginia.

 6. Limitations
 While our findings strongly suggest that Trump’s tweets resulted in increased anti-Asian
behavior, the analyses are not without limitations. The nature of our empirical approach highlights
a short-term spike in reported anti-Asian behavior. We are limited by statistical power in our
capacity to speak to the longer-term effects of the president’s rhetoric on anti-Asian sentiment or

 17
behavior. Specifically, while there is no detectible increase in anti-Asian behavior in Trump-
supporting counties over the subsequent weeks, we cannot rule out the possibility of meaningful
long-run effects.23 Furthermore, it is possible that Trump’s tweets had indirect and longer-term
effects on anti-Asian behaviors outside of his core group of supporters. If stronger in Clinton-
supporting counties, these indirect effects would lead us to underestimate the impact of his tweets
over the longer term.
 The data used in the paper, while novel, also have limitations. As with much self-reported
crime data, we expect that there is significant underreporting of anti-Asian incidents to the STOP
AAPI HATE reporting center. Assuming that this underreporting is uncorrelated with the effects
we consider, estimated effects on the number of reports will be a conservative lower bound for the
true effect on the number of incidents (whereas estimated percent changes will be accurate despite
the measurement error). 24 However, there may be a concern that Trump’s tweets influenced
reporting of anti-Asian incidents independently of any effects on whether such incidents occurred.
Similarly, individuals may have been more likely to report incidents after Trump’s first “Chinese
virus” tweet because the STOP AAPI HATE reporting center only began collecting data on March
19, 2020. That said, we note that our analyses focus on the date of the incident (and not of the
report), and the data include a very large number of reports of incidents that occurred before this
date (Figure 1). In addition, the spike in incident occurrences does not correspond to the date when
the largest number of reports were filed. Specifically, the data show a spike in incidents occurring
on March 20 whereas more reports were filed on March 23 than were filed on March 20 or March
21, or on any other day in March or April of 2020 (Figure A18). Finally, we note that the relative
spike in reported incidents in Trump-supporting counties is the opposite of what we would expect
if it were driven primarily by an increase in reports resulting from increases in awareness of or
sensitivity to anti-Asian incidents amongst more-liberal leaning individuals.

23
 For example, the upper bound of the 95 percent confidence interval of the estimated effect over the period
covering the 3rd to 28th week after Trump’s initial tweet includes effects as large two-thirds of the mean level of anti-
Asian incidents in Clinton supporting counties in the week before Trump’s initial tweet. This estimate is produced
using a straightforward difference-in-differences approach in which we drop the 1st and 2nd week after Trump’s
initial tweet.
24
 Authors’ estimates from the National Crime Victimization Survey (NCVS) and FBI’s Uniform Crime Report
(UCR) hate crime statistics suggest that the number of hate crime incidents may be more than 30 times the reported
number. Reports of incidents to the STOP AAPI HATE reporting center may understate the number of incidents by
an even greater magnitude since the center is relatively new and many victims may be unaware of its existence.

 18
Another important limitation of our analysis is that we do not know the motivations of
the actors or the exact mechanism by which Trump's tweets generate anti-Asian behavior. For
example, the actors may be engaging in these acts because they believe their behavior is in
service of a societal moral good that Trump has signaled (Ginges and Atran, 2009; Fiske and
Rai, 2014) or the acts may be instances of a loss of self-control that the actors will regret
(Dollard et al., 1939; Baumeister and Heatherton, 1996; Card and Dahl, 2011). Alternatively,
the effects may represent an "emboldening effect" whereby individuals' determination of morally
acceptable speech and behavior is influenced by the behavior they observe from elites, including
tacit signals about what they condone (Newman et al., 2020). The effects might also be a result
of “othering” whereby Trump’s words heightened perceived differences in a manner that
marginalized Asians (Grover et al., 2020; Reny and Barreto, 2020). Naturally, any of these
effects may be amplified through the effects of peers (Sacerdote, 2014).

 7. Conclusions
 While there has been extensive media attention related to President Trump’s rhetoric and
influence, it is often difficult to separate his direct effect from underlying trends in behavior that
coincide with his comments. We take advantage of new high-frequency data to demonstrate that
his inflammatory remarks about COVID-19 resulted in a significant spike in anti-Asian behavior,
with these effects concentrated in counties with greater support for the president, which is notable
because these counties are disproportionately rural while the vast majority of Asian Americans
live in urban areas. Google search data underscores the direct link between Trump’s remarks, the
rise in interest in the “Chinese Virus”, and the spike in subsequent anti-Asian behavior.
 Our findings provide empirical support for President Trump’s capacity to influence not
only the beliefs of his supporters, but also their actions. While a large body of work suggests that
high-profile individuals can increase pro-social beliefs and behaviors, we demonstrate that they
can have significant detrimental effects as well, even when the technology of social media
substantially limits what they can say. This finding may have important implications given the
recent rise of populist leaders pushing antisocial beliefs and behaviors on topics ranging from
vaccine hesitancy to the treatment of immigrants.

 19
REFERENCES

M. Adena, R. Enikolopov, M. Petrova, V. Santarosa, E. Zhuravskaya, Radio and the Rise of the
Nazis in Prewar Germany. The Quarterly Journal of Economics. 130(4), 1885-1939 (2015).

V. Alatas, A. G. Chandrasekhar, M. Mobius, B. A. Olken, C. Paladines, When celebrities speak:
A nationwide twitter experiment promoting vaccination in Indonesia. National Bureau of
Economic Research. Working Paper 25589 (2019).

AJMC Staff, A Timeline of COVID-19 Developments in 2020. American Journal of Managed
Care, January 1, 2021. https://www.ajmc.com/view/a-timeline-of-covid19-developments-in-
2020).

D. Ang, The Birth of a Nation: Media and Racial Hate. HKS Faculty Research Working Paper
Series. RWP20-038 (2020).

E. W. Austin, R. V. Vord, B. E. Pinkleton, E. Epstein, Celebrity endorsements and their potential
to motivate young voters. Mass communication and society. 11(4), 420-436 (2008).

R. F. Baumeister, T. F. Heatherton, Self-regulation failure: An overview. Psychological inquiry,
7(1), 1-15 (1996).

A. C. Cameron, J. B. Gelbach, D. L. Miller, Robust Inference With Multiway Clustering.
Journal of Business and Economic Statistics, 29(2), 238-249 (2011).

D. Card, G. B. Dahl, Family violence and football: The effect of unexpected emotional cues on
violent behavior. The Quarterly Journal of Economics, 126(1), 103-143 (2011).

Center for the Study of Hate and Extremism, “Report to the Nation: Anti-Asian Prejudice & Hate
Crime” (2021).

H. Y. Chou, Celebrity political endorsement effects: A perspective on the social distance of
political parties. International Journal of Communication. 9, 24 (2015).

P. Cram, A. M. Fendrick, J. Inadomi, M. E. Cowen, D. Carpenter, S. Vijan, The impact of a
celebrity promotional campaign on the use of colon cancer screening: the Katie Couric effect.
Archives of Internal Medicine. 163(13), 1601-1605 (2003).

S. Darling-Hammond, E. K. Michaels, A. M. Allen, D. H. Chae, M. D. Thomas, T. T. Nguyen,
M. M. Mujahid, R. C. Johnson, After “The China Virus” Went Viral: Racially Charged
Coronavirus Coverage and Trends in Bias Against Asian Americans. Health Education &
Behavior, 47(6), 870-879 (2020).

J. Dollard, N. E. Miller, L. W. Doob, O. H. Mowrer, R. R. Sears, Frustration and aggression
(Yale University Press, 1939).

 20
D. G. R. Evans, J. Barwell, D. M. Eccles, A. Collins, L. Izatt, C. Jacobs, A. Donaldson, A. F.
Brady, A. Cuthbert, R. Harrison, S. Thomas, A. Howell, Z. Miedzybrodzka, A. Murray, The
Angelina Jolie effect: how high celebrity profile can have a major impact on provision of cancer
related services. Breast Cancer Research, 16(5), 1-6 (2014).

A. Fernández Campbell, A. Ellerbeck, Federal agencies are doing little about the rise in ant-
Asian Hate. NBC News, April 16, 2020. https://www.nbcnews.com/news/asian-america/federal-
agencies-are-doing-little-about-rise-anti-asian-hate-n1184766.

A. P. Fiske, T. S. Rai, Virtuous violence: Hurting and killing to create, sustain, end, and honor
social relationships (Cambridge University Press, 2014).

T. Fujiwara, K. Müller, and Carlo Schwarz, The Effect of Social Media on Elections: Evidence
from the United States. NBER Working Paper 28849.

J. Garner and T. Hornberger, Marjorie Taylor Greene has been suspended from Twitter
permanently, January 3, 2022. https://www.cbsnews.com/news/marjorie-taylor-greene-twitter-
suspended-covid-misinformation/

C. L. Garthwaite, T. J. Moore, Can celebrity endorsements affect political outcomes? Evidence
from the 2008 US democratic presidential primary. The journal of law, economics, &
organization, 29(2), 355-384 (2013).

J. Ginges, S. Atran, What motivates participation in violent political action. Annals of the New
York Academy of Sciences, 1167(1), 115-123 (2009).

R. Gover, S. B. Harper, L. Langton, Anti-Asian hate crime during the COVID-19 pandemic:
Exploring the reproduction of inequality. American journal of criminal justice, 45(4), 647-667
(2020).

Y. Hswen, X. Xu, A. Hing, J. B. Hawkins, J. S. Brownstein, G. C. Gee, Association of “#
covid19” Versus “# chinesevirus” With Anti-Asian Sentiments on Twitter: March 9–23, 2020.
American Journal of Public Health, 111(5), 956-964 (2021).

M. Isaac and S. Frenkle, Facebook Says Trump’s Ban Will Last at Least 2 Years, June 4, 2021.
https://www.nytimes.com/2021/06/04/technology/facebook-trump-ban.html

D. J. Jackson, T. I. A. Darrow, The influence of celebrity endorsements on young adults’
political opinions. Harvard international journal of press/politics, 10(3), 80-98 (2005).

R. Jeung, “Incidents of Coronavirus Discrimination, March 19-25, 2020, A Report for A3PCON
and CAA.” Stop AAPI Hate, 2021; https://stopaapihate.org/wp-content/uploads/2021/04/Stop-
AAPI-Hate-Report-Week1-200325.pdf).

 21
R. Jeung, A. Y. Horse, T. Popovic, R. Lim, “Stop AAPI Hate National Report.” Stop AAPI Hate,
2021; https://stopaapihate.org/wp-content/uploads/2021/05/Stop-AAPI-Hate-Report-National-
210316.pdf.

S. E. Needleman, Twitter Bans President Trump’s Personal Account Permanently. Wall Street
Journal, January 8, 2021. https://www.wsj.com/articles/twitter-says-it-is-permanently-
suspending-account-of-president-trump-11610148903.

B. Newman, J. Merolla, S. Shah, D. Lemi, L. Collingwood, S. Ramakrishnan, S, The Trump
Effect: An Experimental Investigation of the Emboldening Effect of Racially Inflammatory Elite
Communication. British Journal of Political Science, 2020, 1-22.

K. Polantz, Trump wants court to force Twitter to reinstate his account, October 2, 2021.
https://www.cnn.com/2021/10/02/politics/donald-trump-twitter-lawsuit/index.html.
Population Reference Bureau, 2004. Asian American Children Are Members of a Diverse and
Urban Population. https://www.prb.org/resources/asian-american-children-are-members-of-a-
diverse-and-urban-population/.

T. T. Reny, M. A. Barreto, Xenophobia in the time of pandemic: othering, anti-Asian attitudes,
and COVID-19. Politics, Groups, and Identities, 2020, 1-24.

M. C. Roberts, S. B. Dusetzina, The effect of a celebrity health disclosure on demand for health
care: trends in BRCA testing and subsequent health services use. Journal of community genetics,
8(2), 141-146 (2017).

B. Sacerdote, R. Sehgal, M. Cook, Why Is All COVID-19 News Bad News? National Bureau of
Economic Research, Working Paper 28110 (2020).

A. Smith, Photo of Trump remarks shows 'corona' crossed out and replaced with 'Chinese' virus.
NBC, March 19, 2020. https://www.nbcnews.com/politics/donald-trump/photo-trump-remarks-
shows-corona-crossed-out-replaced-chinese-virus-n1164111.

K. Tyko, President Trump blocked from posting to Facebook, Instagram 'indefinitely,' at least
through end of term. USA Today, January 7, 2021.
https://www.usatoday.com/story/tech/2021/01/07/facebook-trump-instagram-social-media-
accounts-block-indefinitely-zuckerberg/6580221002/.

T. Wang, Media, Pulpit, and Populist Persuasion: Evidence from Father Coughlin. American
Economic Review. 111(9), 3064-3092 (2021).

S. Wojcik, A. Hughes, E. Remy, “About one-in-five adult Twitter users in the US follow Trump”
(Pew Research Center, 2019).

World Health Organization, (WHO), “Social Stigma associated with COVID-19” (2020;
https://www.who.int/docs/default-source/coronaviruse/covid19-stigma-guide.pdf).

 22
H. Xiong, The Political Premium of Television Celebrity. American Economic Journal: Applied
Economics (2021) [not yet published in print].

D. Yanagizawa-Drott, Propaganda and conflict: Evidence from the Rwandan genocide. The
Quarterly Journal of Economics, 129(4), 1947-1994 (2014).

Bing. He et al., Racism is a Virus: Anti-Asian Hate and Counterhate in Social Media during the
COVID-19 Crisis. https://arxiv.org/abs/2005.12423 (2020).

 23
APPENDIX

 Figure A1
Stop AAPI HATE webpage (stopaaiphate.org), Last Accessed 10/4/2021

 Panel A: Homepage

 Panel B: Question 2 (after question about incident date)

 24
Figure A2
 Daily Anti-Asian COVID-19 Posts on Twitter
 Relative to Trump’s First Public use of “Chinese Virus”

Note: Data are from He et al. (2020), which identifies 40,606 anti-Asian hate tweets from U.S.
users.

 25
Figure A3
Daily Anti-Asian Incidents, adjusted by day-of-week averages

 26
Figure A4
Daily Anti-Asian Incidents by County Urbanicity

 Panel A: Urban areas (county population > 150,000)

 Panel B: Rural areas (county population < 150,000)

 27
Figure A5
Daily Anti-Asian Incidents, Verbal Assaults and Shunning

 Panel A: Verbal Assault

 Panel B: Shunning

 28
Figure A6
Daily Anti-Asian Incidents, Physical Assaults and Workplace Discrimination

 Panel A: Physical Assaults

 Panel B: Workplace discrimination

 29
Figure A7
Daily Anti-Asian Incidents, Refusal of Service and Online Misconduct

 Panel A: Refusal of Service

 Panel B: Online misconduct

 30
Figure A8
Daily Anti-Asian Incidents, Other Incident Types

 31
Figure A9
Estimated effects on anti-Asian incidents in Trump- vs Clinton-supported counties,
 omitting control for the daily logarithm of cumulative Covid-19 cases in a county

 32
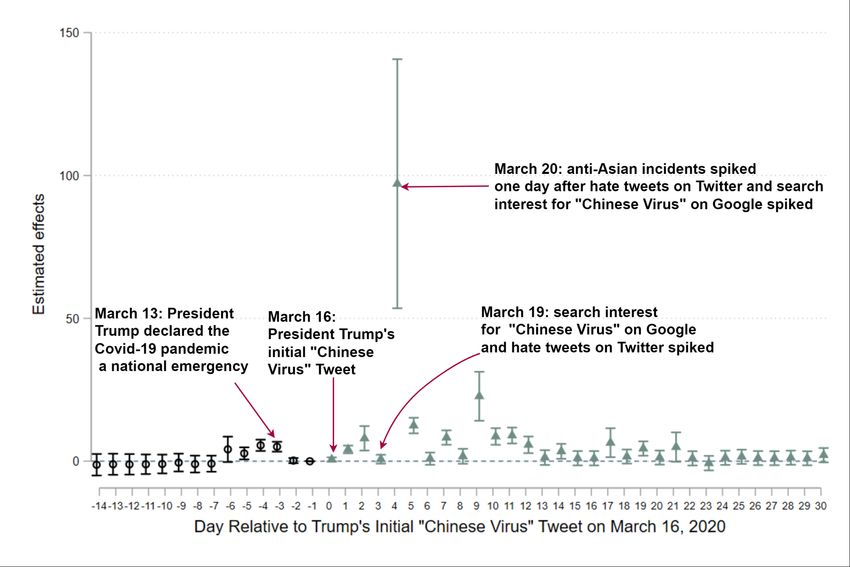
Figure A10
 Estimated effects on anti-Asian incidents in Trump- vs Clinton-supported counties,
 omitting counties with similar levels of support

 Panel A: Excluding counties with 2016 Trump vote share between 40 and 60 percent

 Panel B: Excluding counties with 2016 Trump vote share between 30 and 70 percent

Notes: These figures plot the estimated effects of Trump's initial “Chinese virus” tweet on anti-Asian incidents in
counties that supported Trump in 2016 versus those that supported Clinton. Panel A excludes counties for which
Trump received between 40 and 60 percent of the 2016 presidential vote. Panel B excludes counties for which Trump
received between 30 and 70 percent of the 2016 presidential vote. Estimates control for the logarithm of the total
number of Covid-19 cases plus one, county fixed effects, and date fixed effects. The outcome variable is the number
of reported anti-Asian incidents per 100,000 Asian residents. Data, restricted to incidents 3/2/20-4/15/20, are from the
Stop AAPI Hate database. Confidence intervals are based on two-way standard-error estimates allowing for clustering
within counties over time and across counties on the same date (Cameron, Gelbach, and Miller 2011).

 33
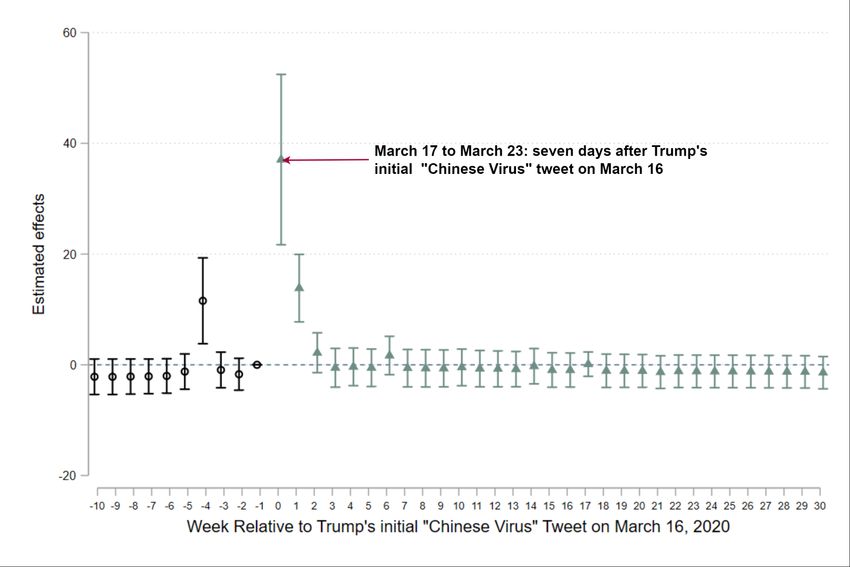
Figure A11
 Estimated effects on anti-Asian incidents in Trump- vs Clinton-Supported Counties,
 using data aggregated into 7-day periods

Notes: These figures plot the estimated effects of Trump's initial “Chinese virus” tweet on anti-Asian incidents in
counties that supported Trump in 2016 versus those that supported Clinton. Estimates control for the logarithm of the
total number of Covid-19 cases plus one, county fixed effects, and week fixed effects. The outcome variable is the
number of reported anti-Asian incidents per 100,000 Asian residents. Data, restricted to incidents 1/1/20-10/19/20, are
from the Stop AAPI Hate database and are aggregated to 7-day periods (i.e., “weeks”) relative to Trump’s initial
“Chinese Virus” tweet on March 16, 2020. For example, week “0” includes March 17 through March 23, 2020, the 7-
day period starting the day after Trump’s initial tweet. Confidence intervals are based on two-way standard-error
estimates allowing for clustering within counties over time and across counties on the same week (Cameron, Gelbach,
and Miller 2011).

 34
You can also read