CALLOWAY - ANNUALREPORTS.COM
←
→
Page content transcription
If your browser does not render page correctly, please read the page content below
CALLOWAY
                                                                                                      REAL ESTATE INVESTMENT TRUST
                                                                                                      2012 Annual Report

                                                              CALLOWAY REAL ESTATE INVESTMENT TRUST
                                                                                                                                     We continue to build on our
                                                                                                      Moving Ahead                   strengths as a retail space
                                                                                                                                     provider while looking at new
                                                                                                      Looking forward                and innovative opportunities to
                                                                                                                                     help ensure a stronger future.

                                                              2012 ANNUAL REPORT

700 Applewood Crescent, Suite 200, Vaughan, Ontario L4K 5X3
           Tel: 905-326-6400 Fax: 905-326-0783
                  www.callowayreit.com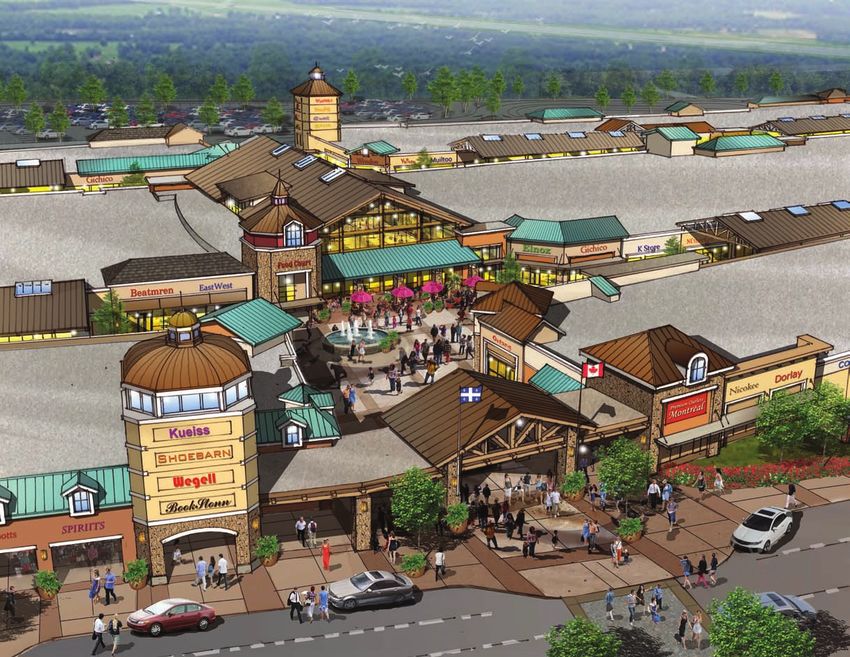
Corporate Information
FINANCIAL Our financials for 2012 shows
definitive growth in the past
HIGHLIGHTS 12 months.
Trustees Bankers
Peter Forde 2, 3
TD Bank Financial Group
Chief Operating Officer BMO Capital Markets
SmartCentres Group of Companies RBC Capital Markets
CIBC World Markets
Mitchell Goldhar 2 Scotia Capital
President, Chief Executive Officer
SmartCentres Group of Companies
(in thousands of dollars, except per Unit 2012 2011 2010 Al Mawani
and other non-financial data) President, Chief Executive Officer Auditors
Calloway Real Estate Investment Trust PricewaterhouseCoopers LLP
Toronto, Ontario
Financial Information Jamie McVicar 1, 3
Investment properties 6,209,837 5,655,773 5,215,851 Trustee
Total assets 6,480,407 5,955,456 5,475,679 Kevin Pshebniski 1, 2
Debt 2,647,615 2,701,812 2,666,583 President Legal Counsel
Hopewell Development Corporation Osler Hoskin & Harcourt LLP
Debt to gross book value
2
48.7% 49.0% 51.3%
Toronto, Ontario
Interest coverage3 2.3X 2.2X 1.9X Huw Thomas 1, 2
Equity (book value) 3,639,497 2,553,497 2,286,184 Trustee
Rentals from investment properties 546,119 511,917 479,198 Michael Young 2, 3
NOI
5
358,688 338,925 319,650 Principal Registrar & Transfer Agent
Quadrant Capital Partners Inc. Computershare Trust Company of Canada
Net income excluding income tax,
Toronto, Ontario
gain/loss on disposition and 1 Audit Committee
fair value adjustments 220,381 198,618 146,261 Investment Committee
2
3
Corporate Governance and Compensation Committee
Net income 1,044,941 206,791 534,450
Cash provided by operating activities 213,543 199,506 133,415 Investor Relations
FFO excluding current income taxes Bart Munn
Senior Management Chief Financial Officer
and one-time adjustment6, 7 226,351 203,388 174,315 Tel: 905-326-6400 x7631
AFFO
6
217,582 196,542 164,068 Al Mawani Fax: 905-326-0783
President, Chief Executive Officer TSX: CWT.UN
Distributions declared 196,960 185,319 165,453
Units outstanding
8
132,279,778 124,738,959 114,939,541 Bart Munn
Chief Financial Officer
Weighted average – basic 126,389,478 118,930,508 106,135,541 Annual General Meeting
Weighted average – diluted
9
126,969,705 119,429,430 106,504,173 Rudy Gobin May 9, 2013, at 9:30 am
Executive Vice President, Asset Management St. Andrew’s Club & Conference Centre
Per Unit Information (Basic/Diluted) 150 King Street West, 27th Floor
Mario Calabrese Toronto, Ontario M5H 1J9
FFO excluding current income taxes Vice President & Controller
and one-time adjustment6, 7 $1.795/$1.787 $1.710/$1.703 $1.642/$1.637
Steve Liew
AFFO6 $1.722/$1.714 $1.653/$1.646 $1.546/$1.540 Vice President, Acquisitions & Finance
Distributions 1.55 1.55 1.55
Anthony Facchini
Payout ratio10 90.3% 94.0% 100.5% Vice President, Operations
Refer to page 19 in the MD&A for footnotes. John Darlow
Vice President, Leasing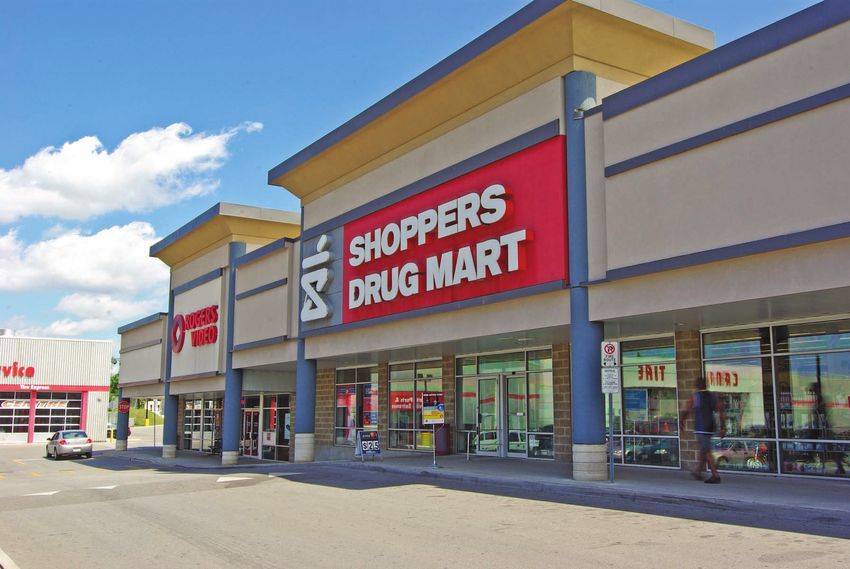
THE BEST WAY TO
KEEP GOING IS TO KEEP
LOOKING FORWARD
Calloway’s successes have been built on a solid business
philosophy of strong portfolio management matched with
informed investment strategy. So while we are conservative
by nature, we remain innovative. This philosophy has served
us well over the years, and 2012 was no exception. We
continue to take advantage of opportunities that leverage
our core competencies while evolving our portfolio of
properties. We know that by applying the same principles
that helped us to grow – great locations, great partnerships
and great management – we will continue to maintain a
stable base for long-term growth for our fellow Unitholders.
2
CALLOWAY REAL ESTATE INVESTMENT TRUST
2012 Annual Report

Moving our
Portfolio Forward

                                        25.9 Million sq. ft. of income-producing properties
                                        85.0% GLA in Walmart-anchored centres
                                        99% Occupancy
                                        $14.37 Net rent per square foot
                                        $20.20 Net rent per square foot (excluding anchors)

Our income-producing properties. Calloway’s portfolio of income-producing properties
continues to realize excellent returns for our Unitholders. The reasons? The right combination of
convenient locations, thoughtful design and dynamic long-term tenants.

Calloway has strategically placed its large-format shopping centres in densely populated urban
areas or prominent suburban locations, enabling consumers to choose from a wide range of
value-focused retailers.

With ample parking, recently built retail spaces tailored to retailer specifications, and low operating
costs, retailers can realize greater economies and efficiencies. And consumers can take advantage
of a one-stop shopping experience featuring many of their favourite stores.

One of those stores is Walmart, which continues to be Calloway’s largest tenant, anchoring
91 of Calloway’s shopping centres. As our lead tenant, and Canada’s dominant retailer, Walmart
helps generate high volumes of customer traffic, helping to further strengthen Calloway’s
presence in markets across the country.

                            GROSS REVENUE BY TENANT

                            Walmart 25.4%                        TOP 2–10
                                                                 RETAILERS 25.1%

                            Local
                            TENANTS 6.0%

                            REGIONAL                             TOP 11–25
                            RETAILERS 3.6%                       RETAILERS 14.1%

                            OTHER NATIONAL
                            RETAILERS 25.8%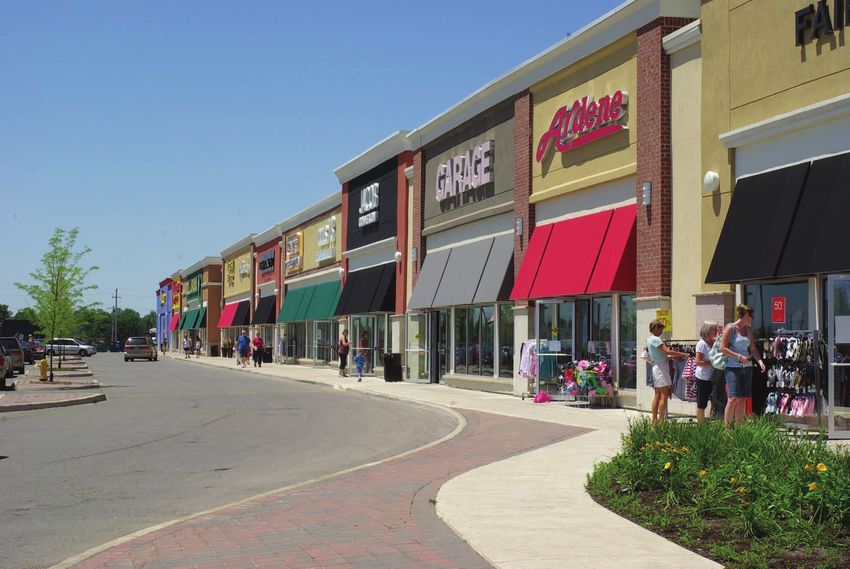
3
CALLOWAY REAL ESTATE INVESTMENT TRUST
2012 Annual Report
LEASE BY MATURITY Major Tenants
in millions of sq. ft.
Large Format
2013 0.8 Walmart
2014 1.4 Canadian Tire
2015 1.5 Loblaws
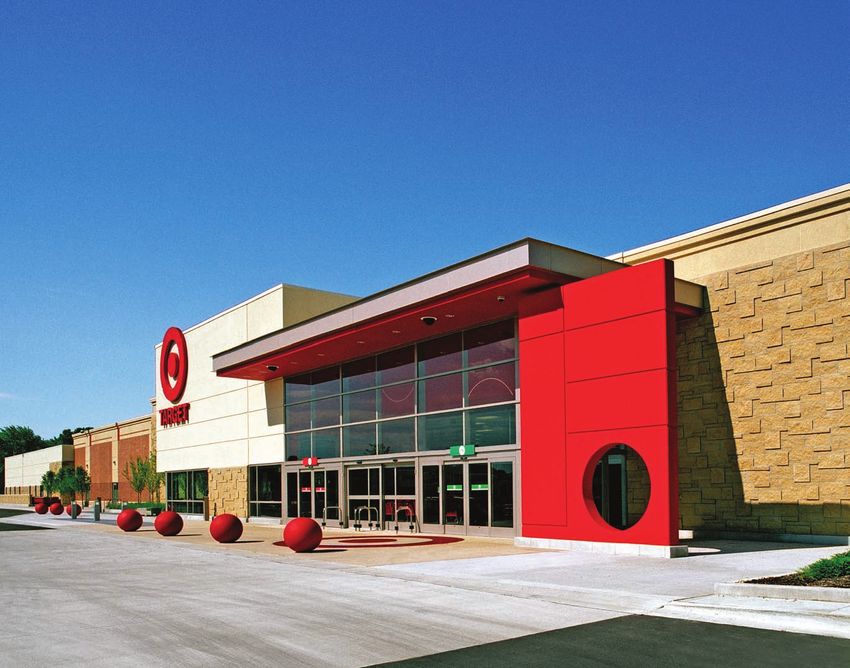
2016 1.7 Target
2017 1.7 Best Buy/Future Shop
2018 1.9 Winners/Marshalls
2019 2.1 Home Depot
2020 2.0
Sobeys
Rona
2021 2.4
Lowes
2022 2.8
*mtm 0.1
Mid-Size Format
vacant 0.3
Shoppers Drug Mart
Home Outfitters
0 0.5 1.0 1.5 2.0 2.5 3.0
LCBO
*mtm – Month to month and holdovers
Staples
Mark’s/Forzani
Small Format
Canadian Banks
Reitmans
Tim Hortons
McDonald’s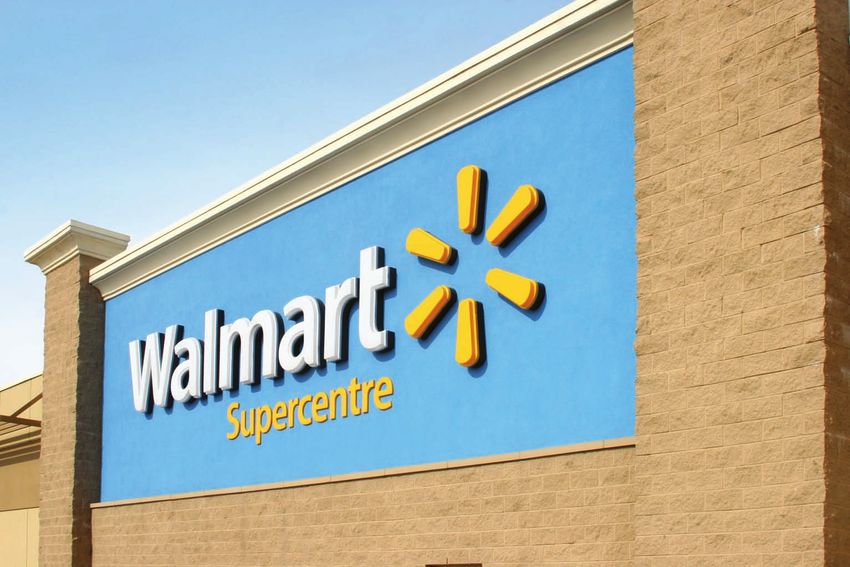
4
CALLOWAY REAL ESTATE INVESTMENT TRUST
2012 Annual Report
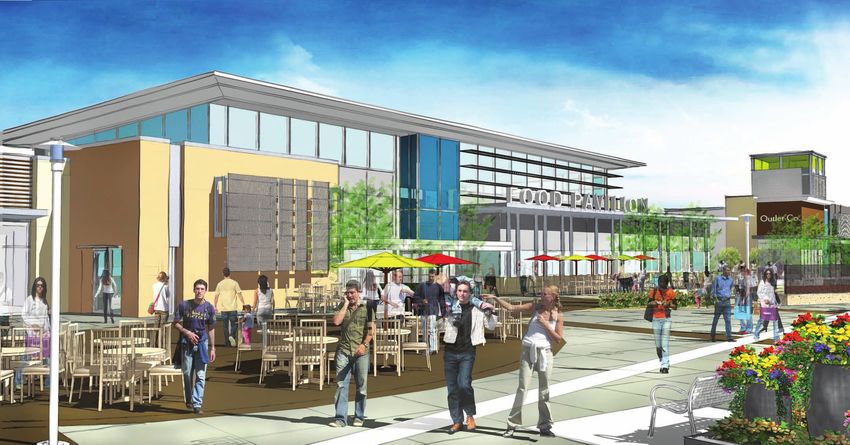
Looking forward with
a New Partnership
Halton Hills offers a natural location
for the new Toronto Premium
Outlets, serving a market of six
million people in the GTA.
Toronto Premium Outlets, Halton Hills, Ontario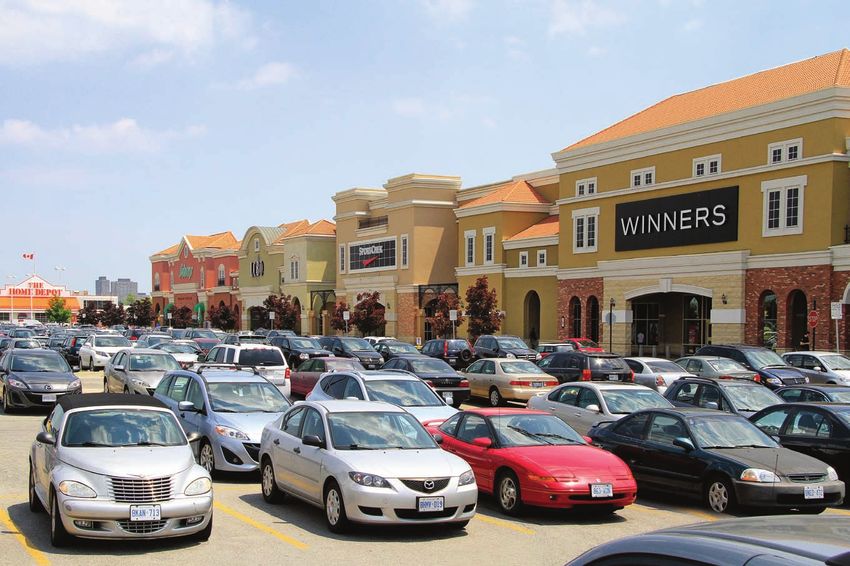
5
                                                                  CALLOWAY REAL ESTATE INVESTMENT TRUST
                                                                                     2012 Annual Report

Toronto Premium Outlets, Halton Hills, Ontario

Our joint ventures with Simon Property Group. Calloway, together with Simon
Property Group, broke ground in April 2012 for Canada’s first upscale outlet centre, Toronto
Premium Outlets. Located in Halton Hills, in the Greater Toronto Area, this new, 500,000-square-
foot complex of more than 100 high-quality stores will serve a market of six million people
within a one-hour drive of the centre.

Then, in October 2012, the Calloway-Simon alliance announced Montreal Premium Outlets,
located in Mirabel. Another massive undertaking, comprising 350,000 square feet and 80 stores,
the centre will service over four million people in the area. Construction begins in 2013. Each
premium centre will feature an unparalleled mix of leading designers and international name
brands, a great opportunity for Canadian consumers to shop the finest retailers in the world.
At the same time, both developments will bring significant economic benefits to their
respective communities.

The Calloway-Simon alliance itself is a perfect combination of competencies. Calloway’s strong
domestic presence matched with Simon Property Group’s global retail experience will help to
further advance the evolving commercial retail landscape in Canada.

Montreal Premium Outlets, Mirabel, Quebec

                                                                 Montreal Premium Outlets,
                                                                 to be constructed in
                                                                 Mirabel, will offer upscale
                                                                 shopping at 80 high-quality
                                                                 international retailers.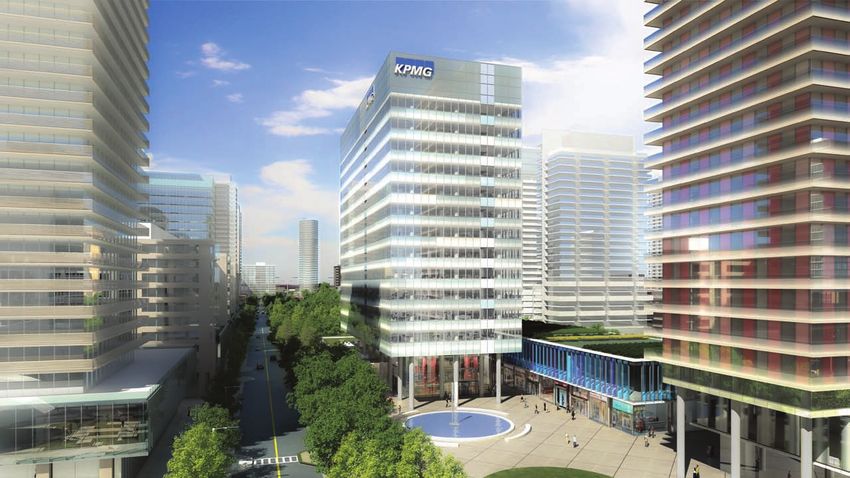
6
CALLOWAY REAL ESTATE INVESTMENT TRUST
2012 Annual Report

Looking Forward
with Intensification
                                                                     VMC Transportation Hub, Vaughan, Ontario

                                        Vaughan Metropolitan Centre
                                        is a massive undertaking, offering
                                        a concentrated community that
                                        includes retail, commercial and
                                        residential spaces.

Investing in a major mixed-use development for greater return. Vaughan
Metropolitan Centre (VMC) is the single biggest development in Canada today: Calloway is at
center stage with a 53-acre mixed-use development of six million square feet of commercial,
residential and retail real estate.

It’s also one of the most exciting and dynamic projects Calloway has ever undertaken. A joint
venture with the City of Vaughan, SmartCentres and Calloway, this major mixed-use development
is located within the VMC at the new Spadina-York subway station. The first phase will be a
15-storey, 300,000-square-foot office tower with global accounting firm KPMG as the lead
tenant. Construction begins in 2013, with completion slated for 2016.

KPMG Tower, VMC, Vaughan, Ontario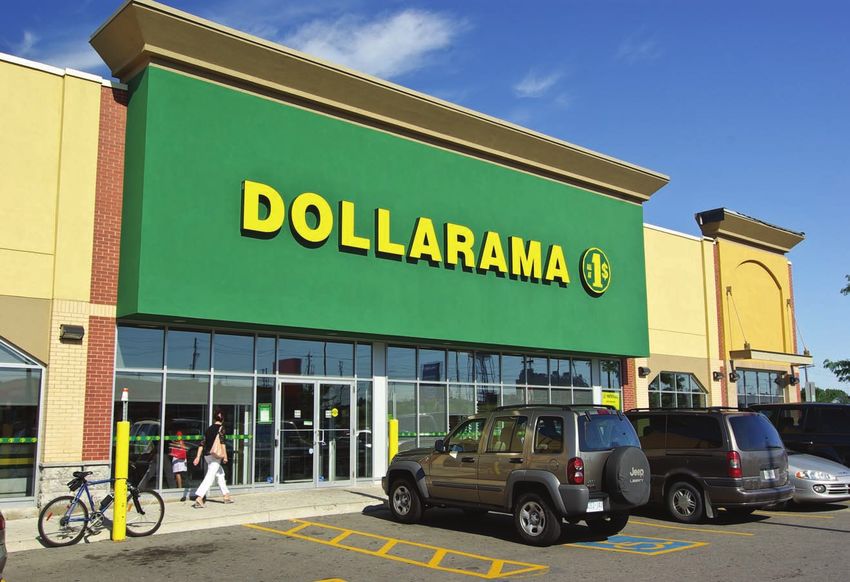
7
                                                                    CALLOWAY REAL ESTATE INVESTMENT TRUST
                                                                                       2012 Annual Report

MOVING AHEAD TO
ENHANCE OUR PORTFOLIO

                                    Our strategy remains unchanged:
                                    continual modification of our portfolio
                                    to help ensure maximum returns.

Our latest acquisitions and dispositions. In 2012,                       AREA BY AGE
                                                                         YEAR BUILT BY PERCENTAGE
Calloway acquired two major retail facilities in Duncan, B.C.,
and Dartmouth, N.S., a total of 400,000 square feet of space,
                                                                         % 100
for $102.7 million. While these were not developed by
SmartCentres, both are anchored by Walmart stores,                                                 72.1
                                                                            75
following the same SmartCentre strategy we’ve used
with continued success.
                                                                            50

Calloway also made the decision in 2012 to sell seven non-core                             24.0
                                                                            25
centres located in Ontario and Nova Scotia. The proceeds have
                                                                                    3.9
helped us to capitalize our larger development projects, enabling
                                                                             0
us to achieve ongoing growth and profitability.                                   BEFORE   1995- 2002-
                                                                                    1995   2001 PRESENT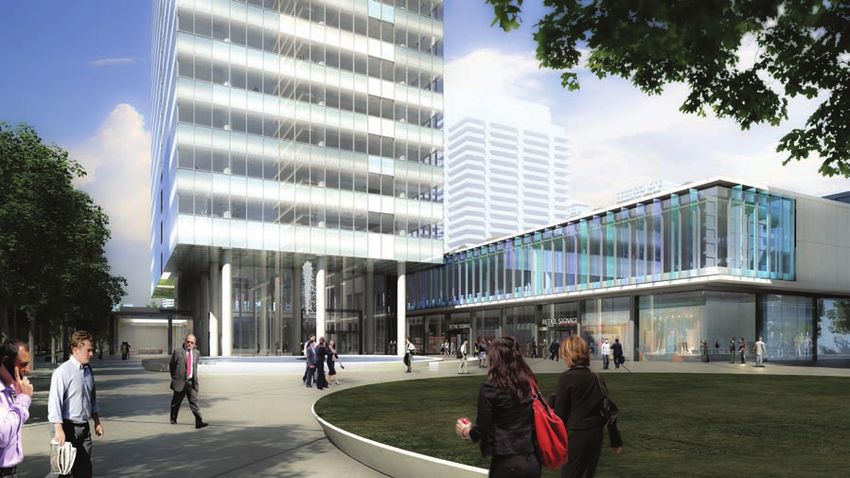
8
CALLOWAY REAL ESTATE INVESTMENT TRUST
2012 Annual Report

Moving Ahead with
Strategic Management

                                        Guided by the strength of our seasoned
                                        management team, Calloway continues
                                        to follow its strategy of prudent risk
                                        management to help deliver consistently
                                        high returns for our Unitholders.

Our strategy for success. The ongoing goal of our                  GROSS LEASABLE AREA
management team is to maintain 99%+ occupancy and 85%+             OF PORTFOLIO
                                                                   30.4 MILLION SQ. FT. UPON COMPLETION
retention rates, while maintaining lease renewal rent increases
in the 5–10% range. To do this, the team is constantly seeking
ways to further enhance the quality of our assets and              INCOME-PRODUCING
                                                                   25.9M. SQ. FT.
maximize same-store net operating income growth. To this
end, Calloway REIT is harvesting 3.6 million square feet           Remaining
                                                                   Earnouts
of development and acquisition in the pipeline (excluding          1.2M SQ. FT.
mezzanine financing), including our two Premium Outlet
                                                                   Premium
Centres in the greater Toronto and Montreal areas. And we          Outlets®
will continue to deploy capital in selective acquisitions, while   0.3M SQ. FT.

disposing of non-core assets.                                      Remaining
                                                                   Developments
                                                                   2.1M SQ. FT.
At the same time, the team sees successful growth will
occur through our intensification projects in higher-growth        Mezzanine
                                                                   Financing
markets such as the Vaughan Metropolitan Centre and                0.9M SQ. FT.
Westside Mall and in re-merchandising opportunities where
Zellers is vacating and the space is being leased by Target
or Real Canadian Superstore.
9
CALLOWAY REAL ESTATE INVESTMENT TRUST
2012 Annual Report
Our 2012 results
at a glance
We are committed to providing our
Unitholders with the highest possible
return on investment. And we believe
it all starts by planning with precision.
+ $600 million 890,000
Portfolio increase from $5.6 billion Number of square feet renewed by tenants
to $6.2 billion
–4.5%
+ 400,000 Sq. ft. Reduction in leverage
Increase in square footage from 25.5 million to
25.9 million, due to EARNOUTS and acquisitions
99%
Occupancy
+ $150 million
Amount of capital raised by issuing 4.05%
8-year unsecured debentures
–3.7%
Payout ratio declined to 90.3%
+ 4.9%
Increase in FFO per unit10
CALLOWAY REAL ESTATE INVESTMENT TRUST
2012 Annual Report
FELLOW
UNITHOLDERS
Where we are and where we’re going. The success of any company is based on its
ability to critically assess current opportunities so that it can confidently plan for the future. At
Calloway, we firmly believe this, which is why we continue to build on our strengths as a premier
provider of value-priced retail space in open-format department store-anchored centres, while
taking advantage of new and innovative opportunities.
We know that by moving ahead, and looking forward, we can help ensure an ever-stronger
future for Calloway and its Unitholders.
RESILIENT RETAIL CENTRES. Our continued focus on operating well-located retail centres with
value-oriented tenants that provide essential goods and services has provided stability with
growth as these centres continue to remain virtually full. Our portfolio registered a 99% level of
occupancy for the third consecutive year. Our extensive portfolio of open-format centres affords
Calloway deep market knowledge and strong tenant relationships. Combined with operational
efficiencies and low cost of capital, these help deliver cash-flow stability, growth and solid
performance results for investors.
We will continue to manage our
existing portfolio and judiciously invest
in our properties to help ensure long-term
stability and growth while mitigating
risk for our investors.11
CALLOWAY REAL ESTATE INVESTMENT TRUST
2012 Annual Report
INTELLIGENT GROWTH. In addition to our consistent focus on our existing business, we are
executing targeted new growth initiatives with the right partners.
We’ve partnered with Simon Property Group, the industry leader in the outlet business, to
develop Premium Outlets in Greater Toronto and Greater Montreal. Premium Outlets retail
centres are distinguished by their unparalleled mix of leading designer and name brands selling
directly to consumers at significant savings in an architecturally distinct setting with charm and
ambience. Phase One of Toronto Premium Outlets will contain over 80 stores and will open in
August 2013. Simon Property Group, one of the world’s largest real estate groups, currently
has 70 Premium Outlets worldwide.
In addition, we recently partnered with SmartCentres to develop a 53-acre jointly owned site
in the prime part of Vaughan Metropolitan Centre (VMC). This development is a multi-use urban
centre including office and residential towers, pedestrian shopping areas, open green space
and urban squares. The City of Vaughan’s new downtown, VMC is being developed around a
transportation hub, including the terminus of the York University subway extension scheduled for
opening in 2016, located wholly within the Calloway/SmartCentre site. Construction of the first
phase – the 300,000-square-foot KPMG Tower, built to a LEEDS Gold standard and with a tunnel
link to the VMC subway – will commence in 2013 and is scheduled for completion in 2016.
STABILITY AND GROWTH. The long-term strategy for Calloway is growth underpinned by
stability. Our ability to invest in targeted development opportunities with experienced partners
will result in a higher risk-adjusted return on investment for our Unitholders. Our portfolio of retail
centres, our capital structure, the pre-leasing before development philosophy and partnering with
strong development partners are all designed to assure investors that we are well positioned to
succeed in stronger as well as weaker economic cycles.
So what does the future hold for Calloway?
A look at what we’ve achieved in the past is a good indication: We will continue to manage our
existing portfolio and judiciously invest in our properties and new opportunities to help ensure
long-term stability and growth while mitigating risk for our investors.
In closing, I would like to thank my fellow associates at Calloway and at SmartCentres for their
contribution to our success in 2012, the Trustees for their strategic guidance and the Unitholders
for your investment and continued support.
Al Mawani
President, Chief Executive Officer
Calloway Real Estate Investment TrustDiverse. Dynamic. Distributed.
Property Our properties are located
throughout Canada, with an
Portfolio average occupancy rate
of 99%+.
Retail Properties Location Ownership NRA1 (sq. ft.) Occupancy Major Tenants
Courtenay SmartCentre Courtenay 100% 273,289 99.4% Walmart Supercentre, Winners, Staples, Future Shop, Sport Chek, RBC
Cowichan Commons East Duncan 100% 247,823 100.0% Walmart Supercentre*, Rona*, Canadian Tire, Home Depot, Future Shop
Cranbrook SmartCentre Cranbrook 100% 141,772 100.0% Walmart Supercentre, Real Canadian Superstore*, Home Hardware*
Kamloops SmartCentre Kamloops 100% 217,790 97.6% Walmart, Michaels, Lordco Auto Parts, Pier 1 Imports, Reitmans
Langley SmartCentre Langley 100% 354,103 98.9% Walmart Supercentre, Home Depot*, Save-On-Foods*,
Home Outfitters, London Drugs
New Westminster SmartCentre New Westminster 100% 433,818 98.3% Walmart Supercentre, Home Outfitters, Best Buy, Tommy Hilfiger,
Bonnie Togs
Penticton Power Centre Penticton 100% 202,199 100.0% Real Canadian Superstore, Staples, Winners, Petcetera, TD Canada Trust
Prince George SmartCentre Prince George 100% 288,341 98.9% Walmart Supercentre, Home Depot*, Canadian Tire*, Michaels
Surrey West SmartCentre Surrey 100% 184,652 98.0% Walmart Supercentre, Dollar Tree, Sleep Country, Reitmans
Vernon SmartCentre Vernon 100% 259,296 97.8% Walmart Supercentre, Rona*, Future Shop, Value Village
Calgary Southeast SmartCentre Calgary 100% 246,085 100.0% Walmart Supercentre, London Drugs, Mark’s Work Wearhouse
Crowchild Corner Calgary 100% 23,377 100.0% RE/MAX, Respiratory Homecare Solutions Inc.
Edmonton Northeast SmartCentre Edmonton 100% 274,353 97.8% Walmart Supercentre, Michaels, Mark’s Work Wearhouse, Moores
Lethbridge SmartCentre Lethbridge 100% 325,630 100.0% Walmart Supercentre, Home Depot*, Ashley Furniture, Best Buy
St. Albert SmartCentre St. Albert 100% 251,329 100.0% Walmart Supercentre, Save-on-Foods*, Totem*, Sleep Country
Regina East SmartCentre Regina 100% 371,269 100.0% Walmart Supercentre, Real Canadian Superstore*, Rona*, HomeSense
Regina North SmartCentre Regina 100% 276,251 100.0% Walmart Supercentre, Sobeys, Mark’s Work Wearhouse, Dollarama,
TD Canada Trust
Saskatoon South SmartCentre Saskatoon 100% 374,722 100.0% Walmart Supercentre, Home Depot*, HomeSense, The Brick
Kenaston Common SmartCentre Winnipeg 100% 257,222 100.0% Rona, Costco*, Indigo Books, Golf Town, Petland, HSBC, RBC
Winnipeg Southwest SmartCentre Winnipeg 100% 499,146 100.0% Walmart, Home Depot*, Safeway, Home Outfitters, HomeSense
Winnipeg West SmartCentre Winnipeg 100% 329,252 100.0% Walmart Supercentre, Canadian Tire*, Sobeys, Winners,
Value Village, Staples
401 & Weston Power Centre North York 44% 172,476 94.8% Real Canadian Superstore*, Canadian Tire, The Brick, Home Outfitters
Ancaster SmartCentre Ancaster 100% 236,090 100.0% Walmart Supercentre, Canadian Tire*, Dollar Tree
Aurora North SmartCentre Aurora 50% 250,967 99.0% Walmart Supercentre, Rona, Best Buy, Golf Town, Dollarama
Aurora SmartCentre Aurora 100% 51,187 100.0% Canadian Tire*, Winners, Bank of Nova Scotia
Barrie North SmartCentre Barrie 100% 234,700 100.0% Walmart Supercentre, Zehrs*, Old Navy, Bonnie Togs, Addition-Elle
Barrie South SmartCentre Barrie 100% 377,195 100.0% Walmart, Sobeys, Winners, Michaels, PetSmart, La-Z-Boy
Bolton SmartCentre Bolton 100% 235,793 100.0% Walmart Supercentre, LCBO, Mark’s Work Wearhouse, Reitmans
Bramport SmartCentre Brampton 100% 120,298 100.0% LA Fitness, LCBO, Dollarama, Swiss Chalet, CIBC, Bank of Montreal
Brampton East SmartCentre Brampton 100% 360,694 99.0% Walmart Supercentre, The Brick, Winners, Staples
Brampton North SmartCentre Brampton 100% 53,380 89.8% Fortinos*, Shoppers Drug Mart
Brockville SmartCentre Brockville 100% 137,873 100.0% Walmart Supercentre*, Real Canadian Superstore*, Home Depot*,
Winners, Future Shop, Michaels, LCBO
Burlington (Appleby) SmartCentre Burlington 100% 151,115 100.0% Toys R Us, LA Fitness, Shoppers Drug Mart, Golf Town,
Bank of Montreal
Burlington North SmartCentre Burlington 100% 226,451 100.0% Walmart Supercentre, Reitmans, Moores, Bank of Nova Scotia
Cambridge SmartCentre (I) Cambridge 100% 689,689 100.0% Walmart Supercentre, Rona, Best Buy, Staples, Bed Bath & Beyond,
Future Shop, Dollarama
* Non-owned anchor.
1
Represents Calloway’s interest in the net rentable area of the property.Retail Properties Location Ownership
NRA1 (sq. ft.) Occupancy Major Tenants
Cambridge SmartCentre (II) Cambridge 100% 32,068 63.4% Home Depot*, Canadian Tire*, 2001 Audio Video, Henry’s Photography
Carleton Place SmartCentre Carleton Place 100% 148,885 100.0% Walmart Supercentre, Dollarama, Mark’s Work Wearhouse, Bulk Barn
Chatham SmartCentre Chatham 50% 152,053 100.0% Walmart Supercentre, Zehrs*, Winners, Mark’s Work Wearhouse,
PetSmart, LCBO
Cobourg SmartCentre Cobourg 100% 181,173 97.7% Walmart Supercentre, Home Depot*, Winners, Swiss Chalet
Etobicoke (Index) SmartCentre Etobicoke 100% 166,276 100.0% Marshalls, PetSmart, Bouclair
Etobicoke SmartCentre Etobicoke 100% 294,725 100.0% Walmart Supercentre, Home Depot*, Best Buy, Sport Chek, Old Navy
Guelph SmartCentre Guelph 100% 280,357 100.0% Walmart Supercentre, Home Depot*, HomeSense, Michaels,
Dollarama, CIBC
Hamilton South SmartCentre Hamilton 100% 208,631 98.7% Walmart Supercentre, Shoppers Drug Mart, LCBO, Moores, CIBC,
Bulk Barn, The Beer Store
Hopedale Mall Oakville 100% 283,257 97.0% Target, Metro, Shoppers Drug Mart, LCBO, CIBC
Huntsville SmartCentre Huntsville 100% 125,008 98.8% Walmart Supercentre, Your Independent Grocer*, Dollar Tree
Kapuskasing SmartCentre Kapuskasing 100% 65,683 100.0% Walmart, Dollar Tree
Laurentian Power Centre Kitchener 100% 185,993 100.0% Target, Rona*, Zehrs*, Staples, Home Outfitters, CIBC
Leaside SmartCentre East York 100% 228,225 94.9% Home Depot*, Winners, Sport Chek, Best Buy, Sobeys, Golf Town
London East Argyle Mall London 100% 343,543 100.0% Walmart, No Frills, Winners, Staples, Sport Chek, GoodLife Fitness
London North SmartCentre London 50% 237,236 98.8% Walmart Supercentre, Canadian Tire*, Future Shop, Winners, Sport Chek
London Northwest SmartCentre London 100% 36,214 100.0% Boston Pizza, Montana’s, Bank of Montreal, TD Canada Trust, RBC
Markham Woodside SmartCentre Markham 50% 179,915 93.7% Home Depot, Longo’s*, Winners, Staples, Chapters, Michaels,
La-Z-Boy, LCBO
Milton Walmart Centre Milton 50% 89,992 94.1% Walmart Supercentre*, Canadian Tire*, Indigo, Staples, Bouclair, RBC
Mississauga (Erin Mills) SmartCentre Mississauga 100% 283,823 99.4% Walmart Supercentre, No Frills, GoodLife Fitness
Mississauga (Go Lands) SmartCentre Mississauga 50% 36,731 100.0% Real Canadian Superstore*, Toys R Us, TD Canada Trust
Mississauga (Meadowvale) Mississauga 100% 547,903 97.7% Walmart Supercentre, Home Outfitters, Winners, Staples, Michaels
SmartCentre
Napanee SmartCentre Napanee 100% 109,565 100.0% Walmart, Dollarama, Mark’s Work Wearhouse, EasyHome
Orleans SmartCentre Orleans 100% 384,015 99.3% Walmart Supercentre, Canadian Tire*, Home Outfitters, Future Shop,
Shoppers Drug Mart
Oshawa North SmartCentre Oshawa 100% 500,271 100.0% Walmart Supercentre, Loblaws, Home Depot*, Future Shop
Oshawa South SmartCentre Oshawa 50% 268,361 100.0% Walmart Supercentre, Lowe’s, Sail, CIBC, Urban Barn, Moores
Ottawa South SmartCentre Ottawa 50% 261,551 99.5% Walmart Supercentre, Loblaws, Cineplex Odeon, Future Shop
Owen Sound SmartCentre Owen Sound 100% 158,074 100.0% Walmart Supercentre, Home Depot*, Penningtons, Dollarama
Pickering SmartCentre Pickering 100% 546,205 97.9% Walmart Supercentre, Lowe’s, Sobeys, Canadian Tire*, Toys R Us,
Winners
Rexdale SmartCentre Etobicoke 100% 35,174 100.0% Walmart Supercentre*, Dollarama, Bank of Nova Scotia
Richmond Hill SmartCentre Richmond Hill 50% 136,306 97.4% Walmart Supercentre, Metro, Shoppers Drug Mart
Rockland SmartCentre Rockland 100% 140,341 100.0% Walmart Supercentre, Dollarama, LCBO, Boston Pizza
Rutherford Village Shopping Centre Vaughan 100% 104,226 88.8% Sobeys, TD Canada Trust
Sarnia SmartCentre Sarnia 100% 342,617 100.0% Walmart Supercentre, Winners, Michaels, LCBO, PetSmart,
Penningtons
* Non-owned anchor.
1
Represents Calloway’s interest in the net rentable area of the property.Retail Properties Location Ownership
NRA1 (sq. ft.) Occupancy Major Tenants
Scarborough (1900 Eglinton) Scarborough 100% 380,090 100.0% Walmart Supercentre, Winners, Mark’s Work Wearhouse, LCBO
SmartCentre
Scarborough East SmartCentre Scarborough 100% 282,156 100.0% Walmart Supercentre, Cineplex Odeon, LCBO, Reitmans
St. Catharines West SmartCentre (I) St. Catharines 100% 402,213 98.5% Walmart Supercentre, Real Canadian Superstore*, Canadian Tire*,
Home Outfitters, Best Buy
St. Catharines West SmartCentre (II) St. Catharines 100% 120,438 98.9% The Brick, Michaels, Shoppers Drug Mart, Golf Town, Bouclair
St. Thomas SmartCentre St. Thomas 100% 222,928 100.0% Walmart Supercentre, Real Canadian Superstore*, Canadian Tire*,
Staples, Dollar Tree
Stouffville SmartCentre Stouffville 100% 163,076 100.0% Walmart Supercentre*, Canadian Tire, Winners, Staples
Sudbury South SmartCentre Sudbury 100% 233,046 100.0% Walmart Supercentre, LCBO, Mark’s Work Wearhouse, Dollarama,
Bouclair
Toronto Stockyards SmartCentre Toronto 100% 8,615 100.0% Walmart*, Bank of Montreal, Citifinancial
Vaughan SmartCentre Vaughan 50% 134,878 97.8% Walmart Supercentre, Future Shop, Home Outfitters
Vaughan (400 & 7) SmartCentre Vaughan 100% 252,966 100.0% Sail, The Brick, Home Depot*, Staples, Value Village, GoodLife Fitness
Welland SmartCentre Welland 100% 240,663 100.0% Walmart Supercentre, Canadian Tire*, Rona, Mark’s Work Wearhouse
Westside Mall Toronto 100% 144,407 97.2% Canadian Tire, FreshCo., Shoppers Drug Mart, CIBC
Whitby North SmartCentre Whitby 100% 277,269 98.1% Walmart Supercentre, Real Canadian Superstore*, LCBO
Whitby Northeast SmartCentre Whitby 100% 33,400 100.0% Boston Pizza, Swiss Chalet, Bell World, RBC
Windsor South SmartCentre Windsor 100% 230,886 92.5% Walmart Supercentre, Part Source, Dollarama, Super Pet, Moores,
The Beer Store
Woodbridge SmartCentre Woodbridge 50% 216,890 94.8% Canadian Tire*, Fortinos*, Winners, Best Buy, Toys R Us, Chapters,
Michaels
Woodstock SmartCentre Woodstock 100% 256,830 100.0% Walmart Supercentre, Canadian Tire*, Staples, Mark’s Work Wearhouse,
Reitmans
Hull SmartCentre Hull 50% 148,260 100.0% Walmart, Rona*, Famous Players*, Super C*, Winners, Staples
Kirkland SmartCentre Kirkland 100% 207,216 100.0% Walmart, The Brick
Laval East SmartCentre Laval 100% 528,994 100.0% Walmart Supercentre, Canadian Tire, IGA, Winners, Michaels,
Bouclair
Laval West SmartCentre Laval 100% 588,073 100.0% Walmart Supercentre, Rona, Canadian Tire*, IGA*, Home Outfitters,
Bouclair, Archambault
Magog SmartCentre Magog 100% 106,976 100.0% Walmart, Canadian Tire*, TD Canada Trust
Mascouche SmartCentre Mascouche 100% 407,799 100.0% Walmart Supercentre, Rona*, IGA, Home Outfitters, Winners,
Staples, Bouclair
Montreal (Decarie) SmartCentre Montreal 50% 112,545 93.3% Walmart, South 95, Baton Rouge, P.F. Chang’s, Roots, Sleep Country
Montreal North SmartCentre Montreal 100% 257,694 100.0% Walmart Supercentre, IGA, Winners, Dollarama, Le Château
Place Bourassa Mall Montreal 100% 277,867 99.1% Zellers, Super C, Pharmaprix, L’Aubainerie, SAQ
Rimouski SmartCentre Rimouski 100% 243,676 100.0% Walmart, Tanguay*, Super C*, Winners, Future Shop, SAQ
Saint-Constant SmartCentre Saint-Constant 100% 304,922 98.5% Walmart, Home Depot*, Super C, L’Aubainerie Concept Mode
Saint-Jean SmartCentre Saint-Jean 100% 223,529 98.8% Walmart, Maxi*, Michaels, Mark’s Work Wearhouse, TD Canada Trust
Saint-Jerome SmartCentre Saint-Jerome 100% 164,001 100.0% Walmart Supercentre*, Home Depot*, IGA, Future Shop, Michaels,
Bouclair
Sherbrooke SmartCentre Sherbrooke 100% 210,820 100.0% Walmart, Home Depot*, Canadian Tire*, The Brick,
Mark’s Work Wearhouse
* Non-owned anchor.
1
Represents Calloway’s interest in the net rentable area of the property.Retail Properties Location Ownership
NRA1 (sq. ft.) Occupancy Major Tenants
Valleyfield SmartCentre Valleyfield 100% 161,941 98.0% Walmart, Dollarama, SAQ, Reitmans
Victoriaville SmartCentre Victoriaville 100% 27,534 100.0% Walmart*, Home Depot*, Maxi*, Winners
Saint John SmartCentre Saint John 100% 271,884 93.6% Walmart, Kent*, Canadian Tire*, Winners, Future Shop, CIBC
Colby Village Plaza Dartmouth 100% 152,633 100.0% Walmart, Atlantic Superstore, Cleves Source for Sports, Pharmasave
Halifax Bayers Lake Centre Halifax 100% 167,788 100.0% Zellers*, Atlantic Superstore*, Future Shop, Winners, Bouclair,
Reitmans, Addition-Elle
New Minas SmartCentre New Minas 100% 46,129 95.5% Walmart*, Sport Chek, Mark’s Work Wearhouse, Bulk Barn,
Bank of Nova Scotia
Truro SmartCentre Truro 100% 123,673 100.0% Walmart, Kent*, Stitches, Reitmans, Penningtons
Charlottetown SmartCentre Charlottetown 100% 202,290 98.0% Walmart, Canadian Tire*, Home Depot*, Michaels, Future Shop,
Old Navy, Gap Outlet
Corner Brook SmartCentre Corner Brook 100% 179,004 100.0% Walmart, Canadian Tire*, Dominion (Loblaw)*, Staples, Bulk Barn
Gander SmartCentre Gander 100% 25,502 91.8% Walmart*, Penningtons, EasyHome, Bank of Nova Scotia
Mount Pearl SmartCentre Mount Pearl 100% 264,764 100.0% Walmart, Canadian Tire*, Dominion (Loblaw)*, GoodLife Fitness,
Staples, Reitmans, CIBC
Pearlgate Shopping Centre Mount Pearl 100% 42,951 100.0% Shoppers Drug Mart, TD Canada Trust, Bulk Barn
St. John’s Central SmartCentre St. John’s 100% 141,322 94.3% Walmart*, Home Depot*, Canadian Tire*, Sobeys, Moores,
Staples, Dollarama
St. John’s East SmartCentre St. John’s 100% 365,519 100.0% Walmart, Dominion (Loblaw)*, Winners, Staples, Future Shop,
Old Navy, Michaels
Total Net Rentable Area 25,780,081
INDUSTRIAL/OFFICE Properties Location Ownership NRA1 (sq. ft.) Occupancy Major Tenants
Airtech Centre Richmond 100% 111,488 95.6% MTU Maintenance, Amre Supply Co., William L. Rutherford, RE/MAX
British Colonial Building Toronto 100% 17,429 100.0% Navigator Limited, Irish Embassy Pubs Inc.
Total Net Rentable Area 128,917
Retail DEVELOPMENT LANDS Location Ownership Area Upon Completion Major Tenants
Quesnel SmartCentre Quesnel 100% 34,408 Walmart*
Salmon Arm SmartCentre Salmon Arm 50% 107,812 Walmart 2
Dunnville SmartCentre Dunnville 100% 35,000 Canadian Tire*, Sobeys*
Fort Erie SmartCentre Fort Erie 100% 32,468 Walmart Supercentre*, No Frills*
Innisfil SmartCentre Innisfil 50% 116,500 –
Mississauga Mississauga 100% 288,153 –
(Dixie and Dundas) Centre
Toronto (Eastern) Centre Toronto 50% 60,000 –
Toronto Premium Outlets Halton Hills 50% 192,679 –
(Halton Hills)
Mirabel SmartCentre Mirabel 33% 85,000 –
Montreal Premium Outlets (Mirabel) Mirabel 25% 97,794 –
Fredericton North SmartCentre Fredericton 100% 51,075 Walmart*, Canadian Tire*, Kent*
Total Area Upon Completion 1,100,889
* Non-owned anchor.
1
Represents Calloway’s interest in the net rentable area of the property.
2
Currently in the development phase.1 7 Management’s Discussion and
Analysis of Results of Operations
and Financial Condition
46 Management’s Responsibility
for Financial Reporting
47 Independent Auditor’s Report
48 Consolidated Balance Sheets
49 Consolidated Statements of Income
and Comprehensive Income
50 Consolidated Statements of Equity
5 1 Consolidated Statements of Cash Flows
52 Notes to Consolidated Financial Statements17
CALLOWAY REAL ESTATE INVESTMENT TRUST
2012 Annual Report
Management’s Discussion and
Analysis of Results of Operations
and Financial Condition
For the Year Ended December 31, 2012
This Management’s Discussion and Analysis (“MD&A”) sets out Calloway Real Estate Investment Trust’s (“Calloway” or
the “Trust”) strategies and provides an analysis of the financial performance and financial condition for the year ended
December 31, 2012, significant risks facing the business and management’s outlook.
This MD&A should be read in conjunction with the Trust’s audited consolidated financial statements for the years ended
December 31, 2012 and 2011 and the notes contained therein. Such consolidated financial statements have been prepared
in accordance with International Financial Reporting Standards (“IFRS”) as issued by the International Accounting Standards
Board (“IASB”). The Canadian dollar is the functional and reporting currency for purposes of preparing the consolidated
financial statements.
This MD&A is dated February 13, 2013, which is the date of the press release announcing the Trust’s results for the year
ended December 31, 2012. Disclosure contained in this MD&A is current to that date, unless otherwise noted.
Readers are cautioned that certain terms used in this MD&A such as Funds from Operations (“FFO”), Adjusted Funds
from Operations (“AFFO”), Net Operating Income (“NOI”), “Gross Book Value”, “Enterprise Value”, “Payout Ratio”, “Interest
Coverage”, “Total Debt to EBITDA” and any related per Unit amounts used by management to measure, compare and explain
the operating results and financial performance of the Trust do not have any standardized meaning prescribed under IFRS
and, therefore, should not be construed as alternatives to net income or cash flow from operating activities calculated in
accordance with IFRS. These terms are defined in this MD&A and reconciled to the consolidated financial statements of
the Trust for the year ended December 31, 2012. Such terms do not have a standardized meaning prescribed by IFRS and
may not be comparable to similarly titled measures presented by other publicly traded entities. See “Other Measures of
Performance”, “Net Operating Income” and “Debt”.
Certain statements in this MD&A are “forward-looking statements” that reflect management’s expectations regarding the
Trust’s future growth, results of operations, performance and business prospects and opportunities as outlined under the
headings “Business Overview and Strategic Direction” and “Outlook”. More specifically, certain statements contained in
this MD&A, including statements related to the Trust’s maintenance of productive capacity, estimated future development
plans and costs, view of term mortgage renewals including rates and upfinancing amounts, timing of future payments of
obligations, intentions to secure additional financing and potential financing sources, and vacancy and leasing assumptions,
and statements that contain words such as “could”, “should”, “can”, “anticipate”, “expect”, “believe”, “will”, “may” and similar
expressions and statements relating to matters that are not historical facts, constitute “forward-looking statements”.
These forward-looking statements are presented for the purpose of assisting the Trust’s Unitholders and financial analysts
in understanding the Trust’s operating environment and may not be appropriate for other purposes. Such forward-looking
statements reflect management’s current beliefs and are based on information currently available to management. However,
such forward-looking statements involve significant risks and uncertainties, including those discussed under the heading
“Risks and Uncertainties” and elsewhere in this MD&A. A number of factors could cause actual results to differ materially
from the results discussed in the forward-looking statements. Although the forward-looking statements contained in this
MD&A are based on what management believes to be reasonable assumptions, including those discussed under the
heading “Outlook” and elsewhere in this MD&A, the Trust cannot assure investors that actual results will be consistent
with these forward-looking statements. The forward-looking statements contained herein are expressly qualified in their
entirety by this cautionary statement. These forward-looking statements are made as at the date of this MD&A and the
Trust assumes no obligation to update or revise them to reflect new events or circumstances unless otherwise required by
applicable securities legislation.
The prior period’s results have been reclassified to conform to the presentation adopted in the current period.
All amounts in the MD&A are in thousands of Canadian dollars, except where otherwise stated. Per Unit amounts are on
a diluted basis, except where otherwise stated.
Additional information relating to the Trust, including the Trust’s Annual Information Form for the year ended December 31,
2012, can be found at www.sedar.com.18
CALLOWAY REAL ESTATE INVESTMENT TRUST
2012 Annual Report
Business Overview and Strategic Direction
The Trust is an unincorporated open-ended mutual fund trust governed by the laws of the Province of Alberta. The Units and
5.75% convertible debentures of the Trust are listed and publicly traded on the Toronto Stock Exchange (“TSX”) under the
symbols “CWT.UN” and “CWT.DB.B”, respectively.
The Trust’s vision is to create exceptional places to shop.
The Trust’s purpose is to own and manage shopping centres that provide our retailers with a platform to reach their
customers through convenient locations, intelligent designs, and a desirable tenant mix.
The Trust’s shopping centres focus on value oriented retailers and include the strongest national and regional names as
well as strong neighbourhood merchants. It is expected that Walmart will continue to be the dominant anchor tenant in the
portfolio and that its presence will continue to attract other retailers and consumers.
As at December 31, 2012, the Trust owned 113 shopping centres, 11 development properties, one office building and
one industrial building, with total gross leasable area of 25.9 million square feet, located in communities across Canada.
Generally, the Trust’s centres are conveniently located close to major highways, which, along with the anchor stores, provide
significant draws to the Trust portfolio, attracting both value oriented retailers and consumers. The Trust acquired the right,
for a ten-year term commencing in 2007, to use the “SmartCentres” brand, which represents a family and value oriented
shopping experience.
Acquisitions
Subject to the availability of acquisition opportunities, the Trust intends to grow distributions, in part, through the accretive
acquisition of properties. The current environment for acquisitions is very competitive; however, the cost of capital relative
to the return available on acquisitions is such that accretive acquisitions can be negotiated. The Trust explores acquisition
opportunities as they arise.
Developments, Earnouts and Mezzanine Financing
Calloway Developments, Earnouts and Mezzanine Financing continue to be a significant component of the Trust’s strategic
plan. As at December 31, 2012, the Trust had approximately 4.5 million square feet of potential gross leasable area that
could be developed, excluding the VMC (as defined below). Assuming the Trust continues to successfully manage the
development of leasable area and raise the capital required for such development, the Trust plans to develop approximately
2.4 million square feet of this gross leasable area internally (“Calloway Developments”), approximately 1.2 million
square feet of the space to be developed and leased to third parties by SmartCentres and other vendors (“Earnouts”)
and approximately 0.9 million square feet of the space to be developed under mezzanine financing purchase options
(“Mezzanine Financing”).
Earnouts occur where the vendors retain responsibility for managing certain developments on behalf of the Trust for
additional proceeds calculated based on a predetermined, or formula based, capitalization rate, net of land and development
costs incurred by the Trust. The Trust is responsible for managing the completion of the Calloway Developments. Mezzanine
Financing purchase options are exercisable once a shopping centre is substantially complete and allows the lender to
acquire 50% of the completed shopping centre.
Professional Management
Through professional management of the portfolio, the Trust intends to ensure its properties portray an image that will
continue to attract consumers as well as provide preferred locations for its tenants. Well-managed properties enhance the
shopping experience and ensure customers continue to visit the centres. Professional management of the portfolio has
contributed to a continuing high occupancy level of 99.0% at December 31, 2012 (December 31, 2011 – 99.0%).
Financial and Operational Highlights in 2012
The Trust continued its growth through Developments, Earnouts and Acquisitions in 2012. During the year, the Trust also
focused on managing the operation and development of existing properties and raising the capital required for future growth
of the business. Highlights for the year include the following:
• Maintained portfolio occupancy at the 99% level
• Completed Developments and Earnouts of 472,268 square feet of leasable area for $127.9 million, providing an
unleveraged yield of 7.5%
• Issued $150 million in unsecured debentures bearing interest at 4.05% per annum
• Renewed and increased revolving operating facility to $70.0 million at an improved rate
• Acquired 400,358 square feet in two income properties for $102.7 million
• Completed the sale of seven investment properties for gross proceeds of $86.0 million
• Completed the sale of a 50% interest in a development property for gross proceeds of $23.6 million to Simon
Properties and commenced construction of the Toronto Premium Outlets®
• Entered into a joint arrangement with SmartCentres and Simon Properties to build the Montreal Premium Outlets®
(“Mirabel”)
• Entered into a joint venture with SmartCentres to develop their portion of the 6.0 million square foot Vaughan
Metropolitan Centre (“VMC”)19
CALLOWAY REAL ESTATE INVESTMENT TRUST
2012 Annual Report
• Negotiated the extension of nine mortgages and the repayment of two mortgages for a net increase of $111.6 million
in new loan commitments
• Confirmed floor capitalization rates on certain Earnout properties, resulting in the elimination of the $18.8 million
contingent liability on Earnouts previously completed
• Under the proposed amendments to the Tax Act announced on December 16, 2010, which were substantively enacted
for accounting purposes on November 21, 2012, the Trust qualified for the REIT Exemption under the SIFT rules and, as
a result, cumulative current and deferred taxes were reversed in the year.
Selected Consolidated Information
The operational and financial consolidated information shown in the table below includes the Trust’s share of investment in
associates, which are disclosed in Note 6 of the consolidated financial statements.
(in thousands of dollars, except per Unit and other non-financial data) 2012 2011 2010
Operational Information
Number of properties 126 129 130
Gross leasable area (in thousands of sq. ft.) 25,909 25,523 24,218
Future estimated development area
excluding VMC (in thousands of sq. ft.) 3,581 4,245 4,615
Lands under Mezzanine Financing (in thousands of sq. ft.) 914 1,607 1,683
Occupancy 99.0% 99.0% 99.1%
Average lease term to maturity 7.8 years 8.2 years 8.6 years
Net rental rate (per occupied sq. ft.) 14.37 14.18 14.03
Net rental rate excluding anchors (per occupied sq. ft.)1 20.20 19.91 19.62
Financial Information
Investment properties 6,209,837 5,655,773 5,215,851
Total assets 6,480,407 5,955,456 5,475,679
Debt 2,647,615 2,701,812 2,666,583
Debt to gross book value2 48.7% 49.0% 51.3%
Debt to total assets 40.9% 45.4% 48.7%
Interest coverage3 2.3X 2.2X 1.9X
Net interest coverage (excluding capitalized interest)3 2.6X 2.5X 2.2X
Total debt to EBITDA4 7.2X 7.9X 8.2X
Equity (book value) 3,639,497 2,553,497 2,286,184
Rentals from investment properties 546,119 511,917 479,198
NOI5 358,688 338,925 319,650
Net income excluding income tax, gain/loss on disposition
and fair value adjustments 220,381 198,618 146,261
Net income 1,044,941 206,791 534,450
Cash provided by operating activities 213,543 199,506 133,415
FFO excluding current income taxes and
one-time adjustment 6,7 226,351 203,388 174,315
AFFO6 217,582 196,542 164,068
Distributions declared 196,960 185,319 165,453
Units outstanding8 132,279,778 124,738,959 114,939,541
Weighted average – basic 126,389,478 118,930,508 106,135,541
Weighted average – diluted9 126,969,705 119,429,430 106,504,173
Per Unit Information (Basic/Diluted)
FFO excluding current income taxes
and one-time adjustment 6,7 $1.795/$1.787 $1.710/$1.703 $1.642/$1.637
AFFO6 $1.722/$1.714 $1.653/$1.646 $1.546/$1.540
Distributions 1.55 1.55 1.55
Payout ratio10 90.3% 94.0% 100.5%
1 Anchors are defined as tenants within a property with leasable area greater than 30,000 square feet.
2 Defined as debt (excluding convertible debentures) divided by total assets plus accumulated amortization and cumulative unrealized fair value gain or loss with
respect to investment property and financial instruments.
3 Defined as earnings before interest, income taxes, amortization and fair value gain or loss with respect to investment property and financial instruments over
interest expense, where interest expense excludes the distributions on deferred units and LP Units classified as liabilities.
4 Defined as debt over earnings before interest, income taxes, amortization and fair value gain or loss with respect to investment property and financial instruments.
5 Defined as rentals from investment properties less property operating costs (includes share in NOI from investments in associates).
6 See “Other Measures of Performance” for a reconciliation of these measures to the nearest consolidated financial statement measure.
7 One-time adjustment relates to prepayment penalty incurred on early repayment of term mortgages.
8 Total
Units outstanding include Trust Units and LP Units, including LP Units classified as liabilities. LP Units classified as equity in the consolidated financial
statements are presented as non-controlling interests.
9 The diluted weighted average includes the vested portion of the deferred unit plan but does not include unvested Earnout options.
10 Payout ratio is calculated as distributions per Unit divided by Adjusted Funds from Operations per Unit.20
CALLOWAY REAL ESTATE INVESTMENT TRUST
2012 Annual Report
Investment Properties
The portfolio consists of 25.9 million square feet of built gross leasable area, 3.6 million square feet of future potential
gross leasable area in 126 properties and the option to acquire 50.0% interest (0.9 million square feet) in seven investment
properties on their completion pursuant to the terms of mezzanine loans. The portfolio is located across Canada, with assets
in each of the ten provinces. The Trust targets major urban centres and shopping centres that are dominant in their trade
area. By selecting well-located centres, the Trust attracts quality tenants at market rental rates.
As at December 31, 2012, the fair value of the investment properties totalled $6,209.8 million, compared to $5,655.8 million
as at December 31, 2011, a net increase of $554.0 million during the year. The fair value of the investment properties is
dependent on future cash flows over the holding period and capitalization rates applicable to those assets.
The following table summarizes the changes in values of investment properties:
2012 2011
Properties Total Properties Total
Income Under Investment Income Under Investment
(in thousands of dollars) Properties Development Properties Properties Development Properties
Balance – beginning of year 5,261,022 394,751 5,655,773 4,770,109 445,742 5,215,851
Acquisition of investment properties 102,685 20,019 122,704 140,720 – 140,720
Transfer from properties under
development to income properties 93,507 (93,507) – 115,040 (115,040) –
Earnout fees on the properties subject
to development agreements 34,405 – 34,405 47,979 – 47,979
Additions to investment property 22,747 96,388 119,135 4,443 120,672 125,115
Dispositions (116,750) (77,032) (193,782) (39,133) (1,493) (40,626)
Net additions 136,594 (54,132) 82,462 269,049 4,139 273,188
Fair value gain (loss) on revaluation
of investment property 391,200 5,416 396,616 221,864 (55,130) 166,734
Balance before investments
in associates 5,788,816 346,035 6,134,851 5,261,022 394,751 5,655,773
Share of investment properties
classified as investments
in associates 19,743 55,243 74,986 – – –
Balance – end of year 5,808,559 401,278 6,209,837 5,261,022 394,751 5,655,773
Valuation Methodology
From January 1, 2010, to December 31, 2012, the Trust has had approximately 78% (by value) or 67% (by number
of properties) of its operating portfolio appraised externally by independent national real estate appraisal firms with
representation and expertise across Canada. The appraisals were prepared to comply with the requirements of IAS 40,
“Investment Property” and International Valuation Standards.
The determination of which properties are externally appraised and which are internally appraised by management is based
on a combination of factors, including property size, property type, tenant mix, strength and type of retail node, age of
property and geographic location. The Trust, on an annual basis, will have external appraisals performed on approximately
one third of the portfolio, rotating properties to ensure appropriate coverage and approximately 80% (by value) of the
portfolio is valued externally over a three-year period.
The remaining portfolio is valued internally by management utilizing a valuation methodology that is consistent with the
external appraisals. Management performed these valuations by updating cash flow information reflecting current leases,
renewal terms and market rents and applying updated capitalization rates determined, in part, through consultation with
the external appraisers and available market data. The fair value of properties under development reflects the impact of
development agreements (see Note 4(b) in the consolidated financial statements for the period ended December 31, 2012
for further discussion).
Fair values were primarily determined through the income approach. For each property, the appraisers conducted and placed
reliance upon: (a) a direct capitalization method, which is the appraiser’s estimate of the relationship between value and
stabilized income; and (b) a discounted cash flow method, which is the appraiser’s estimate of the present value of future
cash flows over a specified horizon, including the potential proceeds from a deemed disposition.
For the year ended December 31, 2012, investment properties (including properties under development) with an aggregate
value of $2,015.0 million (December 31, 2011 – $1,907.5 million) were valued externally with updated capitalization rates and
occupancy, and investment properties with an aggregate value of $4,194.8 million (December 31, 2011 – $3,748.3 million)
were valued internally by the Trust. Based on these valuations, the aggregate weighted average stabilized capitalization rates
on the Trust’s portfolio as at December 31, 2012, and December 31, 2011, were 6.02% and 6.41%, respectively.21
CALLOWAY REAL ESTATE INVESTMENT TRUST
2012 Annual Report
Acquisitions of Investment Properties
Acquisitions – 2012
On May 31, 2012, the Trust completed the acquisition of a development property in Cambridge, Ontario for a purchase price
of $6.4 million paid in cash, adjusted for costs of acquisitions and other working capital amounts.
On August 14, 2012, the Trust completed the acquisition of an income property totalling 152,633 square feet in Dartmouth,
Nova Scotia for a purchase price of $26.5 million adjusted for costs of acquisition and other working capital amounts.
On September 12, 2012, the Trust completed the acquisition of an income property totalling 247,725 square feet in Duncan,
British Columbia for a purchase price of $76.2 million adjusted for costs of acquisition and other working capital amounts.
On December 10, 2012, the Trust acquired 25% and 33.3% interests in the Montreal Premium Outlets (“Mirabel”) and
the lands adjacent to the Montreal Premium Outlets (“Adjacent Lands”), respectively, which are joint arrangements with
SmartCentres and an unrelated party to develop an outlet shopping centre in Mirabel, Quebec, for a purchase price of
$13.7 million adjusted for costs of acquisition and other working capital amounts.
Acquisitions – 2011
On August 17, 2011 and August 31, 2011, the Trust acquired 580,300 square feet of retail space in three retail properties
from a joint venture between SmartCentres and Walmart Canada Realty Inc. for $140.7 million, which was satisfied by the
issuance of Class B Series 5 LP III Units with a value of $1.7 million, the issuance of Earnout options with a nominal fair
value and the balance paid in cash, adjusted for other working capital amounts. An additional 245,039 square feet of retail
space is to be built and acquired under Earnout agreements.
Dispositions of Investment Properties
Dispositions – 2012
On April 16, 2012, the Trust sold a 50% interest in a development property in Halton Hills, Ontario for proceeds of $23.6
million, excluding closing costs of $0.2 million, which was satisfied by cash. Concurrent with the sale, the Trust entered into
a joint-venture agreement with the purchaser to build the Toronto Premium Outlets® on the site.
On June 20, 2012, the York Region expropriated a land parcel in one of the Trust’s existing properties, which was subject to a
development agreement with SmartCentres, for total proceeds of $10.4 million, which was satisfied by cash. The land will be
used to build an extension of the Toronto subway system that will end at this property, which is to be developed into VMC.
On November 29, 2012, the Trust completed the sale of four properties totalling 113,951 square feet for the selling price of
$26.2 million, excluding closing costs of $0.2 million, which was satisfied by cash, adjusted for other working capital amounts.
On December 7, 2012, the Trust sold its interest in the existing retail component and undeveloped lands in Vaughan,
Ontario to a joint venture with SmartCentres to develop VMC and also contributed cash of $10.7 million arising from the
proceeds received from the expropriation noted above, including other adjustments of $0.3 million. As consideration, the
Trust received a 50% interest in the joint venture and was released from existing development management agreements
(including the cancellation of 281,597 Earnout options with a fair value of $2.2 million) which allows the Trust to benefit from
the mixed-use development plans for the property. In addition, the joint venture assumed existing mortgages of $3.7 million,
the Trust issued 198,045 Class B LP Series 1 Units with a value of $5.7 million and the Trust received a payment of
$16.5 million from SmartCentres.
On December 13 and 20, 2012, the Trust completed the sale of three properties to Retrocom Mid-Market Real Estate
Investment Trust (“Retrocom”) totalling 253,493 square feet for the selling price of $59.8 million, excluding closing costs
of $0.5 million, which was satisfied by cash, adjusted for other working capital amounts. Mitchell Goldhar, owner of
SmartCentres, has a significant interest in Retrocom.
The November 29 and December 13 and 20, 2012, property sales were conducted through a broker-managed bid process
with the purchasers, including Retrocom, selected on objective criteria of price and execution risk.
Dispositions – 2011
During 2011, the Trust completed the sale of four investment properties to Retrocom totalling 226,016 square feet for
the selling price of $41.6 million. The purchaser assumed mortgages totalling $12.9 million, resulting in net proceeds of
$28.7 million, adjusted for other working capital amounts.
Maintenance of Productive Capacity
The main focus in a discussion of capital expenditures is to differentiate between those costs incurred to achieve the Trust’s
longer term goals to produce increased cash flows and Unit distributions, and those costs incurred to maintain the quality of
the Trust’s existing cash flow.
Acquisitions of investment properties and the development of existing investment properties (Earnouts and Calloway
Developments) are the two main areas of capital expenditures that are associated with increasing the productive capacity
of the Trust. In addition, there are capital expenditures incurred on existing investment properties to maintain the productive
capacity of the Trust (“sustaining capital expenditures”).You can also read