Building a portfolio of well-managed, high cash-flowing nightclubs and restaurants - NASDAQ: RICK ICR Conference January 10-12, 2022 ...
←
→
Page content transcription
If your browser does not render page correctly, please read the page content below

Building a portfolio of well-managed, high cash-flowing
              nightclubs and restaurants

                                                                NASDAQ: RICK
                                                                ICR Conference
                                                            January 10-12, 2022
                                                          www.rcihospitality.com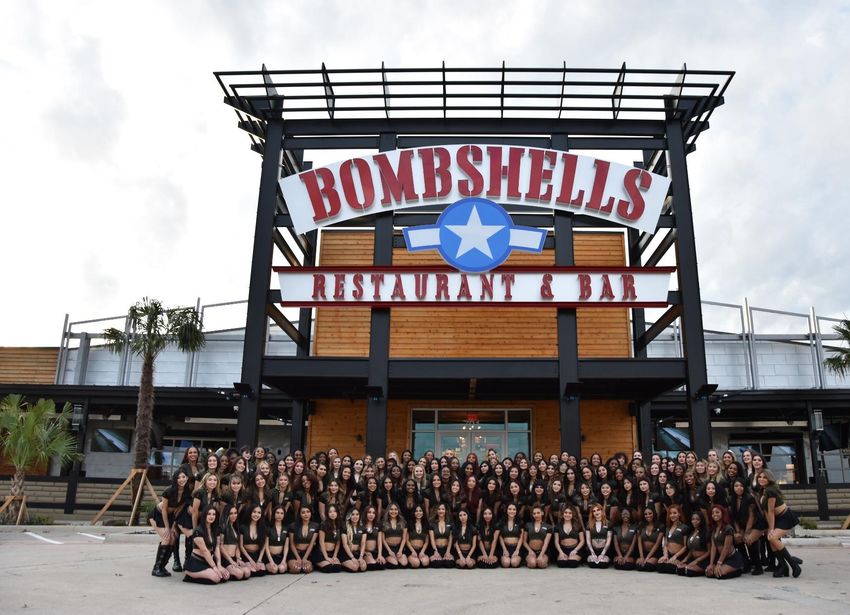
Forward-Looking Statements
 This presentation contains forward-looking statements within the meaning of the Private Securities Litigation Reform Act of 1995. These statements include, among other things, statements
 regarding plans, objectives, goals, strategies, future events or performance and underlying assumptions and other statements, which are other than statements of historical facts. Forward-
 looking statements generally can be identified by words such as “anticipates,” “believes,” “estimates,” “expects,” “intends,” “plans,” “predicts,” “projects,” “will be,” “will continue,” “will likely
 result,” and similar expressions.
 These forward-looking statements are based on current expectations and assumptions that are subject to risks and uncertainties, which could cause our actual results to differ materially from
 those reflected in the forward-looking statements. Factors that could cause or contribute to such differences include, but are not limited to, those discussed in this presentation and those
 discussed in other documents we file with the Securities and Exchange Commission (“SEC”).
 This press release may contain forward-looking statements that involve a number of risks and uncertainties that could cause the company’s actual results to differ materially from those indicated
 in this press release, including, but not limited to, the risks and uncertainties associated with (i) operating and managing an adult business, (ii) the business climates in cities where it operates,
 (iii) the success or lack thereof in launching and building the company’s businesses, (iv) cyber security, (v) conditions relevant to real estate transactions, (vi) the impact of the COVID-19
 pandemic, and (vii) numerous other factors such as laws governing the operation of adult entertainment businesses, competition and dependence on key personnel.
 For more detailed discussion of such factors and certain risks and uncertainties, see RCI’s annual report on Form 10-K for the year ended September 30, 2021, as well as its other filings with
 the U.S. Securities and Exchange Commission. The company has no obligation to update or revise the forward-looking statements to reflect the occurrence of future events or circumstances.
 As of the release of this report, we do not know the future extent and duration of the COVID-19 pandemic on our businesses. Lower sales caused by social distancing guidelines could lead to
 adverse financial results. We are continually monitoring and evaluating the situation and will determine any further measures to be instituted, which could include refinancing several of our debt
 obligations.
 As used herein, the “Company,” “we,” “our,” and similar terms include RCI Hospitality Holdings, Inc. (RCIHH) and its subsidiaries, unless the context indicates otherwise.

                                                                                                                                                                                                           2
Non-GAAP Financial Measures
 In addition to our financial information presented in accordance with GAAP, management uses certain non-GAAP financial measures, within the meaning of the SEC Regulation G, to clarify and
 enhance understanding of past performance and prospects for the future. Generally, a non-GAAP financial measure is a numerical measure of a company’s operating performance, financial
 position or cash flows that excludes or includes amounts that are included in or excluded from the most directly comparable measure calculated and presented in accordance with GAAP. We
 monitor non-GAAP financial measures because it describes the operating performance of the Company and helps management and investors gauge our ability to generate cash flow, excluding
 (or including) some items that management believes are not representative of the ongoing business operations of the Company, but are included in (or excluded from) the most directly
 comparable measures calculated and presented in accordance with GAAP. Relative to each of the non-GAAP financial measures, we further set forth our rationale as follows:

 •   Non-GAAP Operating Income and Non-GAAP Operating Margin. We calculate non-GAAP operating income and non-GAAP operating margin by excluding the following items from income
     from operations and operating margin: (a) amortization of intangibles, (b) impairment of assets, (c) gains or losses on sale of businesses and assets, (d) gains or losses on insurance, and (e)
     settlement of lawsuits. We believe that excluding these items assists investors in evaluating period-over-period changes in our operating income and operating margin without the impact of
     items that are not a result of our day-to-day business and operations.

 •   Non-GAAP Net Income and Non-GAAP Net Income per Diluted Share. We calculate non-GAAP net income and non-GAAP net income per diluted share by excluding or including certain items
     to net income attributable to RCIHH common stockholders and diluted earnings per share. Adjustment items are: (a) amortization of intangibles, (b) impairment of assets, (c) costs and charges
     related to debt refinancing, (d) gains or losses on sale of businesses and assets, (e) gains or losses on insurance, (f) unrealized loss on equity securities, (g) settlement of lawsuits, (h) gain on
     debt extinguishment, (i) the income tax effect of the above-described adjustments, and (j) change in deferred tax asset valuation allowance. Included in the income tax effect of the above
     adjustments is the net effect of the non-GAAP provision for income taxes, calculated at 13.5%, 26.0%, and 15.5% effective tax rate of the pre-tax non-GAAP income before taxes for the 2021,
     2020, and 2019, respectively, and the GAAP income tax expense (benefit). We believe that excluding and including such items help management and investors better understand our operating
     activities.

 •   Adjusted EBITDA. We calculate adjusted EBITDA by excluding the following items from net income attributable to RCIHH common stockholders: (a) depreciation and amortization, (b) income
     tax expense (benefit), (c) net interest expense, (d) gains or losses on sale of businesses and assets, (e) gains or losses on insurance (f) unrealized gains or losses on equity securities, (g)
     impairment of assets, (h) settlement of lawsuits, and (i) gain on debt extinguishment. We believe that adjusting for such items helps management and investors better understand our operating
     activities. Adjusted EBITDA provides a core operational performance measurement that compares results without the need to adjust for federal, state and local taxes which have considerable
     variation between domestic jurisdictions. The results are, therefore, without consideration of financing alternatives of capital employed. We use adjusted EBITDA as one guideline to assess the
     unleveraged performance return on our investments. Adjusted EBITDA multiple is also used as a target benchmark for our acquisitions of nightclubs.

 •   Management also uses non-GAAP cash flow measures such as free cash flow. Free cash flow is derived from net cash provided by operating activities less maintenance capital expenditures.
     We use free cash flow as the baseline for the implementation of our capital allocation strategy.

 Our December 14, 2021, news release and financial tables contain additional details and reconciliation of non-GAAP financial measures for the quarter and year ended September 30, 2021, and
 are posted on our website at www.rcihospitality.com. Our FY 10-K contains additional details and reconciliation of non-GAAP financial measures for the year ended September 30, 2021, and is
 similarly posted on our website.

                                                                                                                                                                                                              3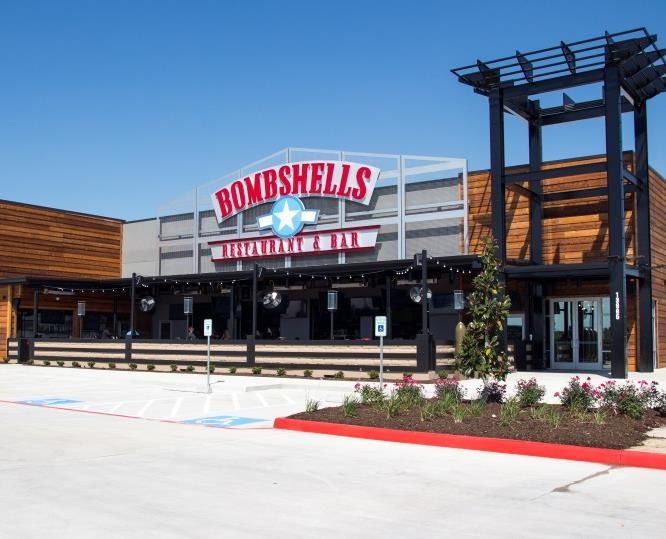
Strong Portfolio of Hospitality Venues
                                              • 60 well-managed, high cash-flowing bars and restaurants
                    Overview                  • Founded in 1983
                                              • IPO and Nasdaq listing in 1995

                                              • Original business – 70% of FY21 sales
                    Nightclubs                • 49 locations in 13 states, many in top 20 US markets
                                              • Many are well-known gentlemen’s club brands with restaurants

                                              • Up and coming new business – 29% of FY21 sales
                   Bombshells                 • Fast-growing, sports bar restaurant chain launched in 2013
                                              • 11 locations in Texas (Houston-8, Dallas-2, Austin-1), licensed to sell franchises in all states

                                              • Deep expertise from four decades in the hospitality industry
                 Growth Drivers               • Strong focus on generating free cash flow
                                              • Significant experience in real estate, property development and finance

                                              FY21 Ended 9/30/21                                                  As of Last Week
    Stock
   Symbol                                     Net Cash Provided by    Free Cash        Cash                      Common Stock        Insider
                Revenues         EPS                                                                Market Cap
                                               Operating Activities     Flow      Dividends/Share                 Outstanding       Ownership
                             $3.37 (GAAP)
 Nasdaq: RICK    $195M                               $42.0M            $36.1M          $0.16         ~$860M         9.49M             7.67%
                           $4.08 (Non-GAAP)

                                                                                                                                                   4
Capital Allocation Strategy*

              • Repurchase shares when FCF
                yield is more than 10%
                                                             Buy Back
                                                              Shares

                      M&A                                                                       Organic
                   Buy More                                                                    Methodically
                  of the Right                                                                  Expand
                  Nightclubs                                                                   Bombshells

               • Buy good, solid, cash                     Drive Value                        • Develop critical mass,
                 flowing clubs at 3-5x                                                          market awareness,
                 adjusted EBITDA                           with 10-15%                          and sell franchises
               • Use seller-financing                      Compound                           • Structure investments
               • Buy the real estate for                                                        in new units to
                 market value                                Annual                             generate annual cash
               • Structure deals to                        FCF/Share                            on cash return of at
                 generate annual cash                                                           least 25-33%
                 on cash return of at                        Growth
                 least 25-33%

                  * We may deviate from this strategy if other strategic rationale warrants                              5
Major Transformation

  Pre-2016                                              Changed                     Today
              Defined &      Invested
 Focused on                                Disposed     Approach                    Highly
              Adopted      in the Right                             Focused on
  Growth of                                of Under-     to Club                   Scalable
               Capital        People,                               Using Debt
  Revenue,                                Performing   Purchases                  Cash Flow
              Allocation    Systems &                                vs. Equity
  not Free                                Locations      & New                     Growth
              Strategy      Processes
 Cash Flow                                             Bombshells                  Machine

                                                                                              6
Impressive Track Record & Covid Rebound
       Free Cash Flow ($M)1                                              $36.1
                                                                                           FCF as % of Revenues1
                                                    $33.3                                                                      18.4%           18.5%

+16%                                                                                                                                                   +750
                                         $23.2

CAGR                       $19.3                                                                       13.7%
                                                                                                                       14.0%                           BPS
                 $18.5                                                                                         13.3%

       $14.9
                                                               $13.5
                                                                                             11.0%

                                                                                                                                       10.2%

       FY15      FY16      FY17          FY18       FY19       FY20      FY21                FY15      FY16    FY17    FY18    FY19    FY20    FY21

        4Q Sales / Location ($K)2                                                          Diluted Weighted Average Shares Outstanding (M)

                                                                          $1,194
                                                                                            10.41
                                                                                                       10.23

 +9%                                                 $1,004
                                                                                                                                                       -2.4%
                                                                                                               9.74    9.72
CAGR                                        $946
                                                                                                                                9.66
                                                                                                                                                       CAGR
                              $871                                                                                                      9.20
                                                                                                                                                9.01
                    $768
          $729

                                                                 $654

          4Q15     4Q16      4Q17          4Q18       4Q19       4Q20      4Q21             FY15       FY16    FY17    FY18    FY19     FY20    FY21

                                   1) FY16 FCF of $18.5M reflects FCF of $20.5M less $2.0M in tax credits
                                   2) Based on unit count at quarter end                                                                                       7
Bombshells: Next Generation Sports Bar Concept
More Upscale High Impact Branding Top Tier Unit Economics1
• Better quality food, service and experience • Immediately recognizable • Target Size (interior & patio) = 10K-12.5K sq. ft.
• Big HDTVs, scratch kitchen, free Wi-Fi, USB • Signals fun, friendliness and comfort to all walks • Average Unit Volume = $5.7M (FY21)
of life
charging stations, DJs • Average Sales/Square Foot = $461 (FY21)
• 4 Dayparts: Lunch, happy hour, dinner, late night • Appeals to men, women, families, friends, singles,
• Cash Investment (owned real estate) = $3.0M
couples, millennials
• Late night drives high AUVs and industry-leading • Cash-on-Cash Return (owned real estate) = 43%
margins • Attracts customers without the need for major
advertising-marketing dollars • Sales/Cash Investment (owned real estate) = 2.2x
1) See slides 10 and 11 for additional detail
8Bombshells: FY21 Record Year
$56.6
Revenues ($M) Units at Year End 10 10
$43.2 8
+32% $30.8 6
+19%
CAGR $24.1
5 CAGR
$18.8
FY17 FY18 FY19 FY20 FY21 FY17 FY18 FY19 FY20 FY21
$13.3
Operating Margin 23.4% Income from Operations ($M)
21.4%
$9.2
+700 16.4% +44%
BPS CAGR
$3.1
8.5% $2.3
7.5% $2.0
FY17 FY18 FY19 FY20 FY21 FY17 FY18 FY19 FY20 FY21
9Bombshells: Favorable Metrics
$5.7
Metric Bombshells Average Unit Volume1 ($M)
Revenue growth (last 5 years) 201% $4.4 $4.3
$4.2
AUV1 growth (last 5 years) 28% $4.0
Unit growth (last 5 years) 100%
Liquor / food sales (most recent year) 57% / 42%
Sales / square foot (most recent year) $461 +40% FY21 vs. FY19
Gross margin (most recent year) 76.2%
Operating margin (most recent year) 23.4%
FY17 FY18 FY19 FY20 FY21
Same-Store Sales Growth2
18.3%
7.7%
3.5%
-3.3%
-6.1%
FY17 FY18 FY19 FY20 FY21
1) Bombshells data excludes units opened in the year of opening and permanently closed units in the year of closure
2) Impact of pandemic excluded. With the impact, SSS was 24.8% in FY21 and 6.5% in FY20 10Bombshells: Highly Profitable Target Return Models
Targeted results based on our experience developing Bombshells. Actual performance of individual locations will vary based on differences between each
location’s size, cost of real estate, lease terms, level of construction and/or retrofitting of the building.
Cash Investment $3.0 million
• Down payment on land and building
Development • 1st year interest payment on bank loan
Owned Costs • 100% cash purchase of FF&E
Building & Real Estate Bank Real Estate / Construction Loan $3.5 million
Using Leverage First Year Revenues $6.5 million
Performance Operating Profit at 20% minimum margin target $1.3 million
Cash on Cash Return 43%
First Year Revenues $6.5 million
Franchised Performance Royalty at 5% $325,000
Cash on Cash Return Uncapped
Minimum cash on cash return of 25-33% (unless strategic rationale to do
Leased otherwise) depending on lease and construction costs
11Bombshells: Targeting 15 More Locations Next 3 Years
• History Total Franchised Units
– Built 5 the first 5 years 6
Total Company-Owned Units
– Then 5 more in 4 years
• FY21 launched plan to develop the next 10 in 3 years
– Growth is self-funding
– Opened 2nd Dallas location in December 2021
– Contracted to buy: 2 more Dallas sites, 1 more Houston site
– Looking at sites in Austin, Phoenix and Florida (areas where
we have local expertise)
• Franchisee program (near-term) 20
– Early FY21 signed first franchisee for 3 locations in San
Antonio area – first unit to open soon
– Expect to sign franchisees for at least 3-6 more locations by
end of FY24 10
• Potential 5
– 80-100 locations (owned and franchised)
1
First Location First 5 Years Next 4 Years Next 3 Years
(Opened 2Q13) (FY13-FY17) (FY18-21) (FY22-24)
121Q22 Sales: Growth Continues
Total Sales Same-Store Sales
1Q22
$ in Millions
Sales
vs. 1Q21 vs. 1Q20 vs. 1Q21 vs. 1Q20
Combined $61.1 +62% +28% +22% +11%
Nightclubs $46.3 +87% +24% +31% +8%
Bombshells $14.8 +14% +43% +8% +21%
• Bombshells benefited from new
Arlington, TX location opened early
December
• Nightclubs benefited from 12 clubs
acquired mid-October and early
November
• No Omicron effect until late 1Q22
• Comparisons to pre-COVID 1Q20
(ended Dec. 31, 2019) provided for
illustrative purposes
Bombshells Arlington (near Dallas) and its Bombshells Girls
13Q&A
• Company Info: www.RCIHospitality.com
• Store Locations: www.4Bombshells.com
• Franchise Support: www.BombshellsFranchise.com
14Contact Information
Corporate Office
10737 Cutten Road
Houston, TX 77066
Phone: (281) 397-6730
Investor Relations
Gary Fishman
Steven Anreder
Phone: (212) 532-3232
IR Website
www.rcihospitality.com
Nasdaq: RICK
15You can also read


