Brachial Plexus Nerve Trunk Segmentation Using Deep Learning: A Comparative Study with Doctors' Manual Segmentation - arXiv
←
→
Page content transcription
If your browser does not render page correctly, please read the page content below
Brachial Plexus Nerve Trunk Segmentation
                                                           Using Deep Learning: A Comparative Study
                                                               with Doctors’ Manual Segmentation

                                                        Yu Wang1 , Binbin Zhu2 , Lingsi Kong3 , Jianlin Wang3 , Bin Gao2 , Jianhua Wang2 ,
                                                                             Dingcheng Tian1 , and Yudong Yao1,*
                                                                  1 Research   Institute for Medical and Biological Engineering, Ningbo University, China
                                                       2 Department   of Anesthesiology, Affiliated Hospital of Medical School of Ningbo University, Ningbo University,
                                                                                                              China
                                                                            3 Department of Anesthesiology, Ningbo No. 6 Hospital, Ningbo, China

                                                                                                   * yaoyudong@nbu.edu.cn

                                              Abstract: Ultrasound-guided nerve block anesthesia (UGNB) is a high-tech visual nerve block anesthesia
arXiv:2205.08143v1 [eess.IV] 17 May 2022

                                           method that can observe the target nerve and its surrounding structures, the puncture needle’s advancement, and
                                           local anesthetics spread in real-time. The key in UGNB is nerve identification. With the help of deep learning
                                           methods, the automatic identification or segmentation of nerves can be realized, assisting doctors in completing
                                           nerve block anesthesia accurately and efficiently. Here, we establish a public dataset containing 320 ultrasound
                                           images of brachial plexus (BP). Three experienced doctors jointly produce the BP segmentation ground truth
                                           and label brachial plexus trunks. We design a brachial plexus segmentation system (BPSegSys) based on deep
                                           learning. BPSegSys achieves experienced-doctor-level nerve identification performance in various experiments.
                                           We evaluate BPSegSys’ performance in terms of intersection-over-union (IoU), a commonly used performance
                                           measure for segmentation experiments. Considering three dataset groups in our established public dataset, the
                                           IoU of BPSegSys are 0.5238, 0.4715, and 0.5029, respectively, which exceed the IoU 0.5205, 0.4704, and 0.4979
                                           of experienced doctors. In addition, we show that BPSegSys can help doctors identify brachial plexus trunks more
                                           accurately, with IoU improvement up to 27%, which has significant clinical application value.

                                           Keywords: Brachial plexus, brachial plexus trunk, nerve block, regional block, nerve identification, nerve
                                           segmentation, deep learning

                                           1.   Main
                                           Peripheral nerve block anesthesia is a type of local anesthesia by injecting local anesthetics to block the nerve con-
                                           duction function in a specific body part of a patient. The critical step of peripheral nerve block anesthesia is nerve
                                           identification. In the past, blind guidance of needle and nerve stimulation are often used [1]. Such methods have
                                           strict requirements for doctors’ experience and require real-time patient feedback, which are difficult to achieve
                                           and prone to complications [2]. With the development of ultrasound technologies, ultrasound-guided nerve block
                                           anesthesia (UGNB) techniques have begun to emerge in recent years [3]. With ultrasound equipments, doctors
                                           can improve the ability to identify nerve structures, observe the needle route and the spread of anesthetic drugs in
                                           real-time, reduce the difficulty of nerve block anesthesia, and improve the quality of anesthesia. However, UGNB
                                           require significant skills, and a lot experiences must be accumulated through practice to master the technique
                                           gradually [4]. In practice, incorrect nerve identification may cause nerve injury.
                                              In order to assist doctors in identifying nerves and completing nerve block operations accurately and quickly,
                                           many researchers have investigated automatic nerve identification methods. Researchers have used traditional
                                           machine learning (ML) methods to identify nerves [5] [6] [7]. The traditional ML methods mainly include four
                                           technical steps: (1) ultrasonic image preprocessing, (2) feature extraction, (3) feature selection, and (4) feature
                                           classification. The primary purpose of ultrasound image preprocessing is to reduce the noise of ultrasound images
                                           and enhance the contrast between different tissue structures. Feature extraction mainly uses manual methods to
                                           extract the texture features, morphological features, and gray value features of the images. Subsequently, the ex-
                                           tracted features are sent to a machine learning model for feature selection and feature classification to accomplish
                                           nerve identification. However, in feature processing in traditional ML methods, manual approaches are often used,
                                           which only extract and select image features in the lower or middle dimensions and it can not achieve satisfactory
                                           results.
                                              In recent years, deep learning has thrived in the medical ultrasound imaging field and has achieved more and
                                           more impressive results, such as tumor benign and malignant classification [8], carotid artery segmentation [9],
                                           and breast lesion detection [10]. Compared with traditional ML methods, deep learning automatically extracts
and selects high-dimensional features of images, and analyzes the features to complete specific tasks. At present,
there are many nerve identification research activation based on deep learning, mainly using nerve segmentation
to identify nerves [11] [12] [13] [14] [15] [16] [17] [18]. Zhao et al. [11] used modified U-Net as a deep learning
network and used 5635 ultrasound images to study the segmentation of the brachial plexus region. The modified U-
Net has a dice coefficient that is only 0.005 lower than the original U-Net [19] when the quantity of parameters are
much fewer than the original U-Net. Ding et al. [12] used Brachial Plexus Multi-instance Segmentation Network
(BPMSegNet) to segment the nerves, arteries, veins, and muscles in the brachial plexus ultrasound images. They
used average precision (AP) as the performance metrics and achieved an AP of 37.62. Other studies include [13]
[14] [15] [16] [17] [18]. In Table 1, we summarize the studies on nerve segmentation using deep learning methods
in recent years. Notice that, we find two limitations in those studies. First, all studies segmented a nerve block
region rather than individual nerve trunks. The segmentation of a nerve block region can help doctors to roughly
locate the appropriate nerve position, but the doctors still need to search for the nerve based on the result of the
segmentation region. In contrast, individual nerve trunks segmentation can directly help doctors locate nerve trunks
and improve nerve block anesthesia’s accuracy and efficiency. Second, previous nerve identification research has
focused on the comparison between different artificial intelligence (AI) algorithms, without investigating whether
the algorithms could actually assist doctors in improving nerve identification performance.
Table 1. Summary of nerve segmentation using deep learning methods.
Nervous Category Dataset Data Annotation Method Network Structure Paper
Brachial plexus Kaggle public dataset Brachial plexus region Modified U-Net [11]
[13]
[14]
[15]
Private dataset Brachial plexus region Modified U-Net [16]
BPMSEGNET [12]
FCN [17]
Femoral nerve Private dataset Femoral nerve region U-Net [18]
Brachial plexus Private dataset Brachial plexus trunks Attention U-Net Our research
In this study, we aim to address the above two problems and advance the clinical application of AI algorithms
in UGNB. To this end, our research includes the following tasks and contributions. (1) While the datasets used
in previous work are all segmentation of nerve block regions, we create a new brachial plexus trunk segmenta-
tion dataset (BPSegData). We collect 320 brachial plexus ultrasound images (BPUS) from the Affiliated Hospital
of Ningbo University and Ningbo No. 6 Hospital and annotate the brachial plexus trunk on BPUS. First, three
experienced anesthesiologists independently label each brachial plexus trunk on BPUS, which can be used to
measure each doctor’s identification accuracy of the brachial plexus trunk. Then, three anesthesiologists work to-
gether as a team to label the brachial plexus trunk, which is used as the ground truth for the brachial plexus trunk
(i.e., BPSegData). (2) Using our BPSegData, we develop a deep learning system for automatic segmentation of
brachial plexus nerve trunks (i.e., BPSegSys) and compare the deep learning segmentation results with each anes-
thesiologist’s work to examine the clinical applicability of BPSegSys. (3) To investigate whether BPSegSys can be
used to improve clinical work, one anesthesiologist labels the brachial plexus trunk on the BPUS again based on
the BPSegSys results. Afterwards, the anesthesiologist’s two labeling results are compared (the anesthesiologist’s
initial labeling and the second labeling based on BPSegSys). Overall, our research results show that BPSegSys
reaches the level of brachial plexus trunk identification performance comparable to that of experienced doctors.
In addition, BPSegSys is shown to be able to assist doctors in segmentating brachial plexus trunk with improved
accuracy, which demonstrates the significant potential in clinical applications.
2. Results
2.1. Image and system overview
With this study, we built BPSegData to develop an AI BPSegSys. BPSegData is collected using two ultrasound
devices, 185 BPUS (YGY dataset) collected using YGY equipment and 135 BPUS (BK3000 dataset) collected
using BK3000 equipment, a total of 320 images. Three experienced doctors labeled the 320 images for BPSeg-
Data to ensure the accuracy of the brachial plexus trunks segmentation label. Using this dataset, we developed
an AI system for the precise segmentation of the brachial plexus trunks, assisting the anesthesiologists to accu-rately identify the brachial plexus trunks for anesthesia. The developed BPSegSys can form an automated brachial
plexus trunk segmentation pipeline, which consists of two modules: (1) BPUS preprocessing module, (2) brachial
plexus trunks segmentation module. We cropped, enhanced, and augumented the original ultrasound images in the
preprocessing module and used deep learning methods to segment the brachial plexus trunks in the segmentation
module. In order to accurately evaluate the performance of BPSegSys and the reliability of the verification model,
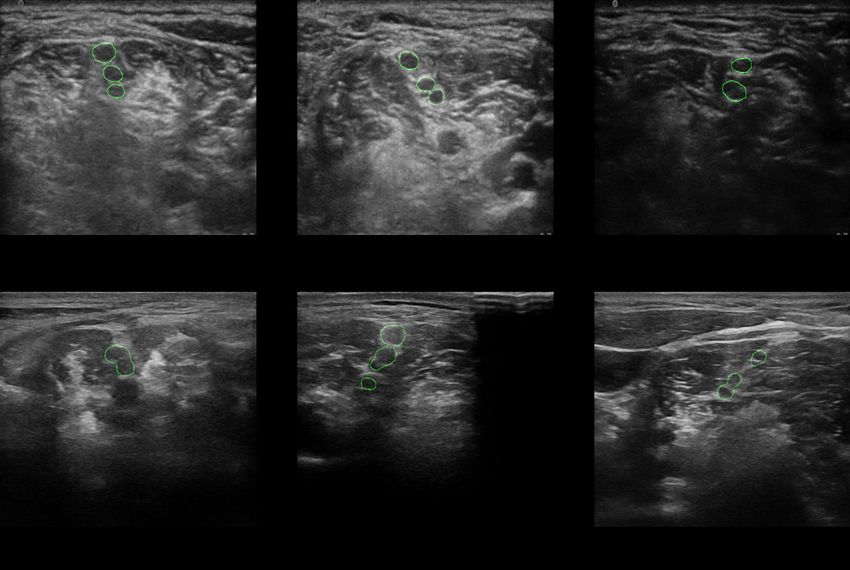
we used the 10-fold cross-validation method. Some final segmentation results of BPSegSys are shown in Figure
1.
Fig. 1. The final segmentation results of BPSegSys. (a), (b), and (c) are from YGY dataset images.
(d), (e), and (f) are from BK3000 dataset images.
2.2. Nerve segmentation results using BPSegSys
We separately analyze the YGY dataset, BK3000 dataset, and the mixed-dataset frome the two devices. YGY
dataset has a total of 185 BPUS. In order to achieve 10-fold cross-validation, we randomly delete 5 images and
used 180 images for cross-validation. We use random grouping to divide the YGY dataset into 10 folds. Four ex-
periments are performed on each fold, using (1) original images, (2) modified loss function, (3) enchanted images,
and (4) combination of enchanted images and modified loss function (mixed-optimization). After completing the
four experiments on each fold, we obtain the results shown in the Table 2. The mixed-optimization method achieve
the best results in the four experiments, and the intersection over union (IoU) reached 52.38%. The second best
result uses of enchanted-images, and IoU is 47.43%. There is no significant difference between using the modified
loss function and using the original images, IoU with 46.59% and 46.47% respectively. Considering the experi-
mental results of each fold, we find that the mixed-optimization method achieve the best results on the average
IoU and, at the same time, achieved the best results in each fold. Using the enchanted image method achieve the
second best results in 5 groups. Therefore, we observe that the enhanced images contribute significantly to the
BPSegSys performance.
Similarly, we use the BK3000 dataset to conduct experiments and the results are shown in Table 3. Similar to us-
ing the YGY dataset, BPSegSys using the BK3000 dataset also achieved the best results in the mixed-optimization
method, reaching an IoU of 47.15%, and achieved 6 best results in 10 folds. The modified loss function method
achieved the second-best result, only 0.4% lower than the mixed-optimization method, reaching 46.75%, and,
out of 10 folds, 4 first places and 5 second places were obtained. Using the original image and enchanted-image
methods, the IoU is 42.24% and 42.1%, respectively. There is not much difference between the two methods, but
compared with the previous two methods, the gap has reached more than 4%. It can be seen that, on the BK3000
dataset, the modified loss function contributes noticeably to the BPSegSys performance.
Subsequently, in order to test the generalization performance of BPSegSys, we examine BPSegSys on the
mixed-dataset. In mixed-dataset, the ratio of the number of images between the YGY dataset and the BK3000
dataset is 37:27. We conducted four groups of 10-fold cross-validation experiments, and the mixed-optimization
method still achieved the best results, with an IoU of 50.29%. The result is between those using the BK3000
dataset and the YGY dataset alone, which is in line with expectations. The results of the other three experimentsTable 2. Performance of BPSegSys on YGY dataset in different experiments.
Optimization method Original images Modified loss function Enhanced images Mixed-optimization
Fold 0 0.4281 0.3996 0.4020 0.4376
Fold 1 0.5905 0.5613 0.5480 0.6159
Fold 2 0.4204 0.4655 0.4340 0.5030
Fold 3 0.4759 0.4941 0.4973 0.5488
Fold 4 0.4377 0.3989 0.4672 0.5216
Fold 5 0.4643 0.4741 0.4849 0.5130
Fold 6 0.4695 0.4797 0.4742 0.5253
Fold 7 0.4732 0.4756 0.4582 0.5091
Fold 8 0.4754 0.4852 0.4943 0.5441
Fold 9 0.4124 0.4254 0.4830 0.5196
Average value 0.4647 0.4659 0.4743 0.5238
Table 3. Performance of BPSegSys on BK3000 dataset in different experiments.
Optimization method Original images Modified loss function Enhanced images Mixed-optimization
Fold0 0.4912 0.5541 0.5289 0.5533
Fold1 0.3376 0.5136 0.3464 0.4743
Fold2 0.4468 0.4621 0.4687 0.4688
Fold3 0.3068 0.3822 0.2978 0.3829
Fold4 0.4767 0.4868 0.4886 0.5206
Fold5 0.4453 0.4620 0.4026 0.4604
Fold6 0.5188 0.5391 0.5097 0.5169
Fold7 0.3465 0.3541 0.3504 0.3735
Fold8 0.4326 0.4706 0.3969 0.5017
Fold9 0.4213 0.4504 0.4203 0.4621
Average value 0.4224 0.4675 0.4210 0.4715
(original images, modified loss function, and enhanced images) are similar to the BK3000 dataset results and are
shown in Table 4. It can be seen that the modified loss function method has achieved significantly better results
than the other methods.
2.3. Doctors’ manual segmentation results
As described above, we train BPSegSys and obtain the brachial plexus segmentation results of BPSegSys based on
three dataset scenarios. Next, based on the manual segmentation results independently done by the three doctors
(Doctor A, Doctor B, and Doctor C) on the brachial plexus, we analyze the doctors’ performance in segmenting
the brachial plexus and compare them with BPSegSys. We perform 10-fold cross-validation on the segmentation
results of each doctor in the same way as before (YGY dataset, BK3000 dataset, and mixed-dataset). The results
show that Doctor C achieves the best results in all three datasets, and the IoU is 52.05%, 47.04%, and 49.79%,
respectively. The results of the other two doctors (Doctor A, Doctor B) are relatively close. However, the best re-
sults among doctors are slightly worse than the experimental results of BPSegSys (52.38%, 47.15%, and 50.29%).
This shows that BPSegSys reaches a level comparable to that of senior doctors (Doctor A, Doctor B, and Doc-
tor C) for brachial plexus identification. We also analyze the variance of three doctors’ segmentation results on
a given dataset (YGY dataset, BK3000 dataset, and mixed-dataset), which are 0.04623, 0.03939, and 0.04042,
respectively. The variances of the experimental results of BPSegSys on the three datasets are 0.02806, 0.02764,
and 0.02361, which are much smaller than the variances among the three doctors’ results (Table 5). It can be seen
from the variance results that the variance between the brachial plexus segmentation results of the three senior
doctors are relatively large, indicating that the ultrasound diagnosis is highly subjective. In contrast, the variance
between the BPSegSys segmentation results are relatively small, and the segmentation IoU performance results
are slightly better than the best results among the doctors, demonstrating the stability and reliability of BPSegSys.Table 4. Performance of BPSegSys on mixed-dataset in different experiments.
Optimization method Original images Modified loss function Enhanced images Mixed-optimization
Fold0 0.4772 0.5212 0.5016 0.5216
Fold1 0.4395 0.4762 0.4387 0.5136
Fold2 0.4056 0.4351 0.4079 0.4541
Fold3 0.4460 0.4674 0.4549 0.4891
Fold4 0.4209 0.4442 0.4021 0.4856
Fold5 0.4776 0.4603 0.4348 0.4743
Fold6 0.4306 0.4667 0.3945 0.4868
Fold7 0.5545 0.5544 0.5354 0.5588
Fold8 0.4830 0.5106 0.5102 0.5488
Fold9 0.4452 0.4961 0.4374 0.4966
Average value 0.4580 0.4832 0.4518 0.5029
Table 5. Doctor’s segmentation results compared with BPSegSys.
IoU Variance
Doctor A Doctor B Doctor C BPSegSys Doctor BPSegSys
YGY dataset 0.4288 0.4641 0.5205 0.5238 0.04623 0.02806
BK300 dataset 0.4195 0.3929 0.4704 0.4715 0.03939 0.02764
Mixed-dataset 0.4242 0.4323 0.4979 0.5029 0.04042 0.02361
2.4. Doctors’ segmentation results with the assistance of BPSegSys
After all the experimentation discussed above, we further study the role of BPSegSys in assisting doctors in
brachial plexus identification. We selecte Doctor A’s folds with lower scores in the YGY dataset and BK3000
dataset and then aske Doctor A to relabel the data considering the BPSegSys segmentation results. The time
interval between the two labeling is more than three months, and the results are shown in Table 6. From Table 6 we
can see that, after referring to the BPSegSys segmentation results, the results of Doctor A on the two datasets have
improved. Among them, the YGY dataset experiment achieves significant performance improvement, reaching
27%; and the BK3000 dataset experiment has improved 3.9%. Oversee, we observe that BPSegSys is helpful to
anesthesiologists. Notice that BK3000 is an ultrasound device often used by Doctor A, and BPSegSys is able
to assist the doctor in improving the segmentation performance, even though it’s a small improvement (3.9%).
However, YGY is not a device often used by Doctor A and the doctor’s segmentation results are significantly
improved (27%) with the aid of BPSegSys. In conclusion, BPSegSys is able to assist doctors in performing brachial
plexus identification.
Table 6. Comparison of doctor’s segmentation results before and after using BPSegSys.
Dataset Fold Original result Second result Percentage of improvement
YGY dataset Fold 4 0.3728 0.4735 27%
BK3000 dataset Fold 4 0.3973 0.4128 3.90%
3. Discussion
Through this study, we have the following important observations. First, BPSegSys achieves or exceeds doctors’
brachial plexus identification accuracy level in both the data collected by a single device and the mixed data
(Table 5). It shows that BPSegSys has a good potential for clinical applications of ultrasound-guided nerve block
anesthesia. Second, lack of consensus and subjectivity is a broad view of ultrasound diagnosis, that is, a lack of
inter- and intra-reader repeatability [20], which can be seen in the deviation in the identification of nerve locationin nerve block (Table 5). BPSegSys can provide doctors with a relatively stable and accurate nerve identification
result, and assist doctors in implementing accurate nerve identification for precise anesthesia. Third, we have
shown that BPSegSys can improve doctors’ identification performance of brachial plexus (Table 6), and BPSegSys
can be used for training purposes for doctors.
We also investigate the influence of image features and network structure on BPSegSys. First, we observe the
images of YGY dataset and BK3000 dataset and find that they have different grayscale features, as shown in
Figure 2 and Figure 3. It can be seen that the histogram of the YGY dataset image is unimodal and distributed
in areas with lower gray levels, and, in comparison, the histogram distribution of the BK3000 dataset image is
relatively even. We perform image enhancement on YGY dataset and BK3000 dataset, respectively. The enhanced
image of YGY dataset has a larger dynamic range of gray levels. Similarly, the gray value distribution of the
enhanced image of BK3000 dataset is also improved, though not as significant in terms of the dynamic range and
contrast. From the experimental results, we can see that on the YGY dataset, image enhancement can improve the
performance of BPSegSys, but on the BK3000 dataset, it does not provide effective help. We also investigate the
effect of the loss function on BPSegSys. BPSegSys with a modified loss function has better performance on all
datasets. Notice that, after combining image enhancement and modified loss function (i.e., mixed-optimization),
BPSegSys achieves the best results (Table 5). Therefore, our study demonstrates that improving the neural network
structure and functions can improve the performance of BPSegSys in brachial plexus identification.
Fig. 2. Histogram of YGY dataset image. (a) The original images’ histogram, (b) The enhanced
images’ histogram.
Fig. 3. Histogram of BK3000 dataset image. (a) The original images’ histogram, (b) The enhanced
images’ histogram.
There are still a few limitations in our work, which we hope to resolve in the future. First of all, although
we observe that BPSegSys achieves a performance level comparable to that of doctors, other ultrasound devices
are still needed to investigate the effectiveness of BPSegSys. Secondly, for elderly and obese patients, it is more
difficult to observe the brachial plexus. In BPSegData, no separate statistics and experiments have been performed
on elderly and obese patients, and we are unable to obtain the related performance results.
In conclusion, we develope a brachial plexus ultrasound image segmentation system to assist doctors in identi-
fying the brachial plexus trunks. The experimental data shows the system’s feasibility and application potential in
identifying the brachial plexus trunk. With the continuous advancement of deep learning technology, and continu-
ous data collection, BPSegSys will be able to contribute more significantly for ultrasound-guided brachial plexusblock.
4. Methods
4.1. Datasets and label
Our research data comes from the Affiliated Hospital of Ningbo University and Ningbo No. 6 Hospital, collected
by three experienced nerve block doctors from the location of the intermuscular sulcus, a total of 320 ultrasound
images of the brachial plexus. The three doctors have been engaged in nerve block work for more than 10 years
and have used ultrasound-guided nerve block for more than 7 years. The average annual number of patients for
Doctor A is 700, and the average annual number of patients for Doctor B and for Doctor C is respectively 8,000.
Among the 320 images, 135 images (BK3000 dataset) are collected by Doctor A using the high frequency linear
8870 probe on the BK3000 device, and the other 185 images are collected by Doctor B and Doctor C on the
Sonosen S-Nerve device using Ultrassom HFL38xp probe acquisition (YGY dataset). After the data collection is
completed, we label the data twice. (1) Each doctor individually uses Labelme to label the brachial plexus trunks
and obtain the labeling results of each doctor based on their own knowledge and experience. (2) Three doctors
label the brachial plexus trunks together, and the labeling results are used as the ground truth for BPSegData.
Details of the doctors’ experience, ultrasound devices, and operation are given in Table 7.
Table 7. Details of the doctors’ experience, ultrasound devices, and operation.
Doctor A Doctor B Doctor C
Ultrasound Device BK BK3000 Sonosite S-Nerve Sonosite S-Nerve
Ultrasound Probe High Frequency Linear 8870 HFL38xp HFL38xp
Image Acquisition Region Intermuscular Groove Intermuscular Groove Intermuscular Groove
Years of Working in Nerve Block 14 years 10 years 11 years
Years of Using UGNB 7 years 8 years 8 years
Annual Average Number of Patients 700 8000 8000
Patients Age Range 18-80 10-85 10-85
Image Acquisition Process With the patient’s head turned Turn the patient’s head Turn the patient’s head
to one side, the high-frequency toward the unaffected side, toward the unaffected side,
probe is used to translate upward use thehigh-frequency probe use thehigh-frequency probe
from the supraclavicular fossa. to translate outward from to translate outward from
the plane of the cricoid the plane of the cricoid
cartilage, and then move cartilage, and then move
up and down to confirm the up and down to confirm the
target. target.
4.2. Image preprocessing
Before inputting an ultrasound image to BPSegSys, we performe some preprocessing on the image. Since the
original image contains certain irrelevant information, such as the information frame of the ultrasound equipment
software and the invalid area (i.e., the non-image area) of the ultrasound image. We first crop the image and
extracte the area containing relevant information from the original image. For the image collected by the YGY
device, we use (87, 47) as the upper left point and crop the image with a size of 510 × 356. The image collected by
the BK3000 device contains two types of image interfaces. We use (278, 174) as the upper left point on the first
interface to crop an image with a size of 553 × 492. The second interface’s upper left point is (165, 172), and the
size of the captured image is 595 × 529. Finally, all cropped images are adjusted to 224 × 224 as the input of the
deep learning network.
We augmente our training data by applying horizontal flipping and random cropping. More specifically, we flip
the image horizontally to double the amount of data. Then the above image is randomly cropped twice to obtain
an image with a size of 224 × 224. In summary, we augmente the original data to 6 times, including the original
images, 2 times cropped-images, fliped-images, and 2 times fliped-cropped-images.
Due to the poor contrast of the ultrasound image, we performe a gray histogram analysis on the brachial plexus
ultrasound image. As discussed in Section 3, we use contrast limited adaptive histgram equalization (CLAHE)
method to improve image quality. We use the built-in toolkit of the image processing tool OpenCV-Python to
perform CLAHE enhancement on ultrasound images, with clipLimit set to 1, and tileGridSize set to (8, 8).
We use intersection-over-union (IoU) as the performance metrics in our experiments. The calculation of IoU is
as follows,
Area of Overlap
IoU = (1)
Area of Union4.3. Deep learning neural network development
At present, there are many high-performance image segmentation deep learning networks. Therefore, before
we start this experiment, we first screen some deep learning segmentation networks, including U-Net [19], U-
Net++ [21], MedT [22], Attention U-Net (Att U-Net) [23]. We chose the brachial plexus ultrasound image
dataset [24] with similar features as our dataset (BPSegData) as the test data. The dataset contains 5535 labeled
ultrasound images, of which 2334 images contain brachial plexus nerves. We divide 2334 ultrasound images into
the training set and test set according to 9:1 and conduct deep learning segmentation network training and testing.
After testing, Att U-Net achieves the best results in all networks, and we finally selecte it as the network model
used in this study. Att U-Net is an improved convolutional neural network based on U-Net. The attention gate is
added to the upsampling of U-Net, which enhances the neural network’s sensitivity to the region of interest.
We use the image segmentation suite Paddleseg [25] tool developed based on the PaddlePaddle deep learning
framework to implement ATT U-Net. We use NVIDIA RTX 2070 graphics processing unit for training and testing.
The training set and test set are randomly divided in 9:1, and 10-fold cross-validation is used to evaluate the
performance of the deep learning network. We use stochastic gradient descent (SGD) as an optimizer in a batch
size of 4 with an initial learning rate of 0.01, which then decays every 1 iteration with 0.00001.
We first use original images and enhanced-images to train Att U-Net, respectively. Considering that the brachial
plexus trunk occupies a relatively small proportion of the whole image, which belongs to the small target segmen-
tation, we add the loss function Lovász hinge loss [26] suitable for small target segmentation in Att U-Net. We
combine Lovász hinge loss and cross-entropy loss to obtain a new loss function. New loss function = 0.02×Lovász
hinge loss + 1×cross-entropy loss. Finally, we use the original images and enhanced-images to train the optimized
Att U-Net, respectively. In training, we use the test set as the validation set of the model simultaneously and verify
it every one epoch, retaining the model parameters with the highest IoU, that is, the optimal parameters during the
entire training process.
Availability of data and materials
Available upon request.
Authors’ contributions
Y.Y. initiated the project and oversaw all aspects of the project. Y.Y. and B.Z. conceived the project. Y.W. and
D.T. designed the experiments. Y.W. conducted all experiments and analysed the experimental results. B.Z., L.K.
and Jianlin Wang contributed to data collection, labelling and confirmation. D.T. assisted data labelling. B.G. and
Jianhua Wang put forward helpful suggestions for the analysis of project. Y.W. and Y.Y. wrote the manuscript with
input from all authors. All of the authors reviewed the manuscript.
References
1. Y. Asher, “Hadzic’s Peripheral Nerve Blocks and Anatomy for Ultrasound-guided Regional Anesthesia, Second Edi-
tion,” Anesthesiology, vol. 119, pp. 493–493, 08 2013.
2. B. C. Tsui, S. Suresh, and D. S. Warner, “Ultrasound imaging for regional anesthesia in infants, children, and adoles-
cents: A review of current literature and its application in the practice of extremity and trunk blocks,” The Journal of
the American Society of Anesthesiologists, vol. 112, no. 2, pp. 473–492, 2010.
3. P. Marhofer and V. W. Chan, “Ultrasound-guided regional anesthesia: Current concepts and future trends,” Anesthesia
& Analgesia, vol. 104, no. 5, pp. 1265–1269, 2007.
4. P. Marhofer, H. Willschke, and S. Kettner, “Current concepts and future trends in ultrasound-guided regional anesthesia,”
Current Opinion in Anesthesiology, vol. 23, no. 5, pp. 632–636, 2010.
5. O. Hadjerci, A. Hafiane, P. Makris, D. Conte, P. Vieyres, and A. Delbos, “Nerve detection in ultrasound images using
median gabor binary pattern,” in International Conference Image Analysis and Recognition, pp. 132–140, Springer,
2014.
6. O. Hadjerci, A. Hafiane, P. Makris, D. Conte, P. Vieyres, and A. Delbos, “Nerve localization by machine learning frame-
work with new feature selection algorithm,” in International Conference on Image Analysis and Processing, pp. 246–
256, Springer, 2015.
7. O. Hadjerci, A. Hafiane, D. Conte, P. Makris, P. Vieyres, and A. Delbos, “Computer-aided detection system for nerve
identification using ultrasound images: A comparative study,” Informatics in Medicine Unlocked, vol. 3, pp. 29–43,
2016.
8. J. Shi, S. Zhou, X. Liu, Q. Zhang, M. Lu, and T. Wang, “Stacked deep polynomial network based representation learning
for tumor classification with small ultrasound image dataset,” Neurocomputing, vol. 194, pp. 87–94, 2016.
9. R. Zhou, F. Guo, M. R. Azarpazhooh, J. D. Spence, E. Ukwatta, M. Ding, and A. Fenster, “A voxel-based fully con-
volution network and continuous max-flow for carotid vessel-wall-volume segmentation from 3D ultrasound images,”
IEEE Transactions on Medical Imaging, vol. 39, no. 9, pp. 2844–2855, 2020.10. M. H. Yap, G. Pons, J. Martı́, S. Ganau, M. Sentı́s, R. Zwiggelaar, A. K. Davison, and R. Marti, “Automated breast
ultrasound lesions detection using convolutional neural networks,” IEEE Journal of Biomedical and Health Informatics,
vol. 22, no. 4, pp. 1218–1226, 2017.
11. H. Zhao and N. Sun, “Improved U-Net model for nerve segmentation,” in International Conference on Image and
Graphics, pp. 496–504, Springer, 2017.
12. Y. Ding, Q. Yang, G. Wu, J. Zhang, and Z. Qin, “Multiple instance segmentation in brachial plexus ultrasound image
using BPMSegNet,” arXiv preprint arXiv:2012.12012, 2020.
13. J. van Boxtel, V. R. Vousten, J. Pluim, and N. M. Rad, “Hybrid deep neural network for brachial plexus nerve segmen-
tation in ultrasound images,” arXiv preprint arXiv:2106.00373, 2021.
14. R. Wang, H. Shen, and M. Zhou, “Ultrasound nerve segmentation of brachial plexus based on optimized ResU-Net,” in
2019 IEEE International Conference on Imaging Systems and Techniques (IST), pp. 1–6, IEEE, 2019.
15. Y. Wang, J. Geng, C. Zhou, and Y. Zhang, “Segmentation of ultrasound brachial plexus based on U-Net,” in 2021
International Conference on Communications, Information System and Computer Engineering (CISCE), pp. 482–485,
IEEE, 2021.
16. Q. Zhang, Z. Cui, X. Niu, S. Geng, and Y. Qiao, “Image segmentation with pyramid dilated convolution based on
ResNet and U-Net,” in International Conference on Neural Information Processing, pp. 364–372, Springer, 2017.
17. C. Liu, F. Liu, L. Wang, L. Ma, and Z.-M. Lu, “Segmentation of nerve on ultrasound images using deep adversarial
network,” Int J Innov Comput Inform Control, vol. 14, pp. 53–64, 2018.
18. C. Huang, Y. Zhou, W. Tan, Z. Qiu, H. Zhou, Y. Song, Y. Zhao, and S. Gao, “Applying deep learning in recognizing the
femoral nerve block region on ultrasound images,” Annals of Translational Medicine, vol. 7, no. 18, 2019.
19. O. Ronneberger, P. Fischer, and T. Brox, “U-Net: Convolutional networks for biomedical image segmentation,” in
International Conference on Medical Image Computing and Computer-Assisted Intervention, pp. 234–241, Springer,
2015.
20. X. Qian, J. Pei, H. Zheng, X. Xie, L. Yan, H. Zhang, C. Han, X. Gao, H. Zhang, W. Zheng, et al., “Prospective assessment
of breast cancer risk from multimodal multiview ultrasound images via clinically applicable deep learning,” Nature
Biomedical Engineering, vol. 5, no. 6, pp. 522–532, 2021.
21. Z. Zhou, M. M. R. Siddiquee, N. Tajbakhsh, and J. Liang, “Unet++: Redesigning skip connections to exploit multiscale
features in image segmentation,” IEEE Transactions on Medical Imaging, vol. 39, no. 6, pp. 1856–1867, 2019.
22. J. M. J. Valanarasu, P. Oza, I. Hacihaliloglu, and V. M. Patel, “Medical transformer: Gated axial-attention for medical
image segmentation,” arXiv preprint arXiv:2102.10662, 2021.
23. O. Oktay, J. Schlemper, L. L. Folgoc, M. Lee, M. Heinrich, K. Misawa, K. Mori, S. McDonagh, N. Y. Hammerla,
B. Kainz, et al., “Attention U-Net: Learning where to look for the pancreas,” arXiv preprint arXiv:1804.03999, 2018.
24. Kaggle, “Ultrasound nerve segmentation dataset.” https://www.kaggle.com/c/
ultrasound-nerve-segmentation/, 2016.
25. PaddlePaddle, “Paddleseg, end-to-end image segmentation kit based on paddlepaddle.” https://github.com/
PaddlePaddle/PaddleSeg, 2019.
26. M. Berman, A. R. Triki, and M. B. Blaschko, “The lovász-softmax loss: A tractable surrogate for the optimization of
the intersection-over-union measure in neural networks,” in Proceedings of the IEEE Conference on Computer Vision
and Pattern Recognition, pp. 4413–4421, 2018.You can also read