BLUEGRASS MOBILE HOME PARK - Offering Memorandum
←
→
Page content transcription
If your browser does not render page correctly, please read the page content below
George Samutin
                                                                      Tel: (502) 329-5923
                                                                      Cel: (312) 953-7455
                                                                      george.samutin@marcusmillichap.com
                                                                      License: KY 74769
Offering Memorandum

                      BLUEGRASS MOBILE HOME PARK
                      3510 Bluegrass Park Dr • Louisville, KY 40218
                                                                                                    1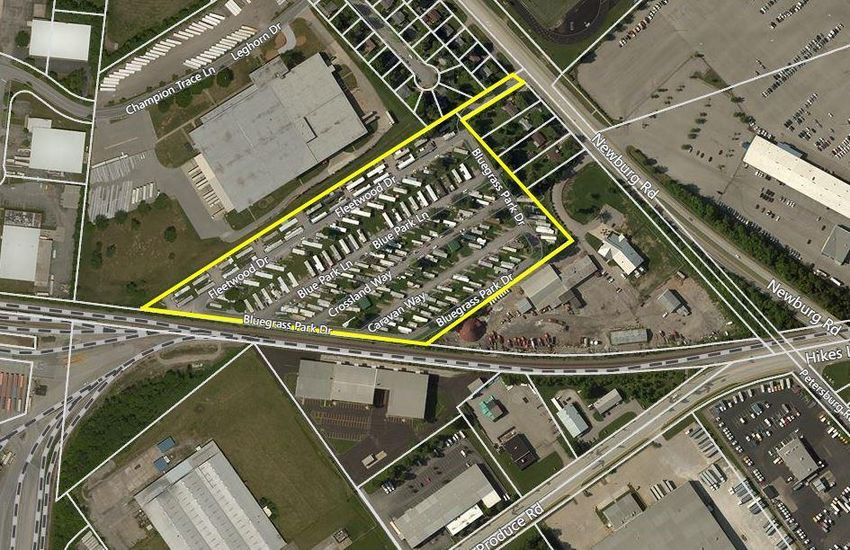
NON-ENDORSEMENT AND DISCLAIMER NOTICE

                 Confidentiality and Disclaimer
                 The information contained in the following Marketing Brochure is proprietary and strictly confidential. It is intended to
                 be reviewed only by the party receiving it from Marcus & Millichap and should not be made available to any other
                 person or entity without the written consent of Marcus & Millichap. This Marketing Brochure has been prepared to
                 provide summary, unverified information to prospective purchasers, and to establish only a preliminary level of interest
                 in the subject property. The information contained herein is not a substitute for a thorough due diligence investigation.
                 Marcus & Millichap has not made any investigation, and makes no warranty or representation, with respect to the
                 income or expenses for the subject property, the future projected financial performance of the property, the size and
                 square footage of the property and improvements, the presence or absence of contaminating substances, PCB's or
                 asbestos, the compliance with State and Federal regulations, the physical condition of the improvements thereon, or
                 the financial condition or business prospects of any tenant, or any tenant's plans or intentions to continue its
                 occupancy of the subject property. The information contained in this Marketing Brochure has been obtained from
                 sources we believe to be reliable; however, Marcus & Millichap has not verified, and will not verify, any of the
                 information contained herein, nor has Marcus & Millichap conducted any investigation regarding these matters and
                 makes no warranty or representation whatsoever regarding the accuracy or completeness of the information provided.
                 All potential buyers must take appropriate measures to verify all of the information set forth herein. Marcus & Millichap
                 is a service mark of Marcus & Millichap Real Estate Investment Services, Inc. © 2017 Marcus & Millichap. All rights
                 reserved.

                 Non-Endorsement Notice
                 Marcus & Millichap is not affiliated with, sponsored by, or endorsed by any commercial tenant or lessee identified in
                 this marketing package. The presence of any corporation's logo or name is not intended to indicate or imply affiliation
                 with, or sponsorship or endorsement by, said corporation of Marcus & Millichap, its affiliates or subsidiaries, or any
                 agent, product, service, or commercial listing of Marcus & Millichap, and is solely included for the purpose of providing
                 tenant lessee information about this listing to prospective customers.

                 ALL PROPERTY SHOWINGS ARE BY APPOINTMENT ONLY.
                 PLEASE CONSULT YOUR MARCUS & MILLICHAP AGENT FOR MORE DETAILS.

                 BLUEGRASS MOBILE HOME PARK
                 Louisville, KY
                 ACT ID Y0530085

                                                                                                                                         2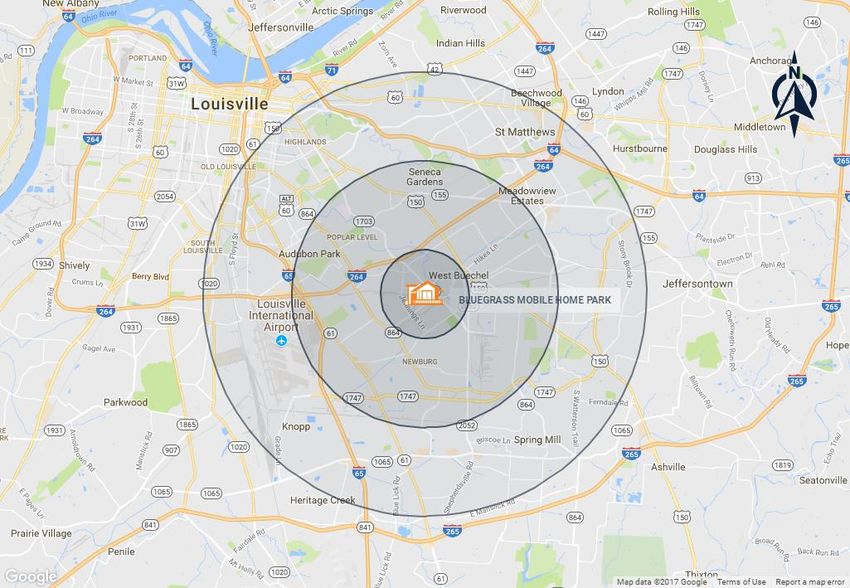
BLUEGRASS MOBILE HOME PARK

                                       TABLE OF CONTENTS

                             SECTION

INVESTMENT OVERVIEW              01
 Offering Summary
 Regional Map
 Local Map
 Aerial Photo

FINANCIAL ANALYSIS               02
 Rent Roll Summary
 Rent Roll Detail
 Operating Statement
 Notes
 Pricing Detail
 Acquisition Financing
 Growth Rate Projections
 Cash Flow

MARKET OVERVIEW                  03
 Market Analysis

 Demographic Analysis

                                                      3
BLUEGRASS MOBILE HOME PARK

   INVESTMENT
   OVERVIEW

                             4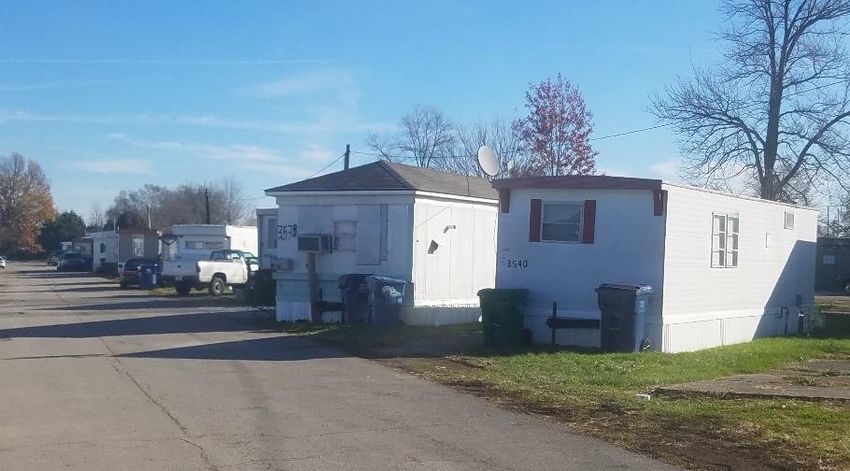
BLUEGRASS MOBILE HOME PARK

                                                                                                           OFFERING SUMMARY
INVESTMENT OVERVIEW
Marcus & Millichap is pleased to present a rare opportunity to acquire a mobile home community centrally located in the Louisville
metro area. The Bluegrass Mobile Home Court is situated near the main expressway, the Waterson (I-264) as well as a public
transportation stop near the entrance to the park which allows residents quick access to major employers, schools, and shopping
centers.

There is an opportunity to increase revenue by repositioning this property with a change of management strategy. The forty six
park owned homes, which are rented fully furnished, could be sold; thereby reducing payroll and maintenance expenses. The
current owner pays water and utilities; not customary as most parks in the area charge back for these utilities. This factor would
allow new owners to decrease operating expenses. All of these changes are reflected in the pro forma operating statement.

      INVESTMENT HIGHLIGHTS

      ▪ Approved Lots - 199

      ▪ Occupied Lots - 153

      ▪ POH - 46

      ▪ Lot Rent - $360-$400

      ▪ City Water and City Sewers

                                                                                                                               5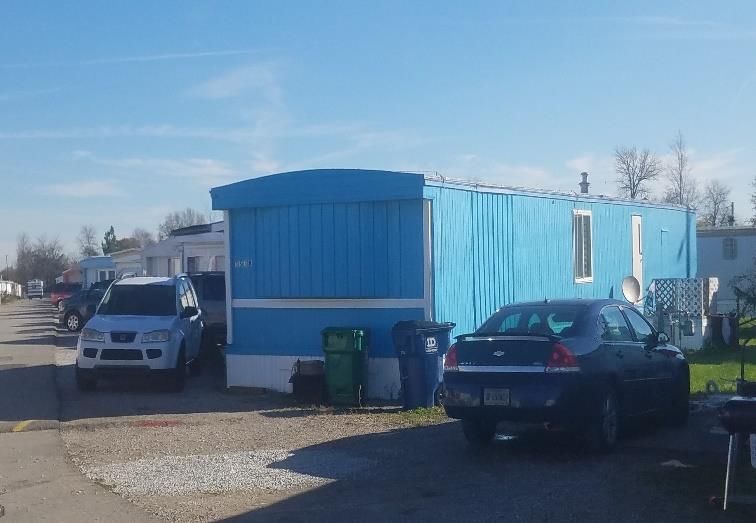
BLUEGRASS MOBILE HOME PARK
OFFERING SUMMARY
PROPERTY OVERVIEW
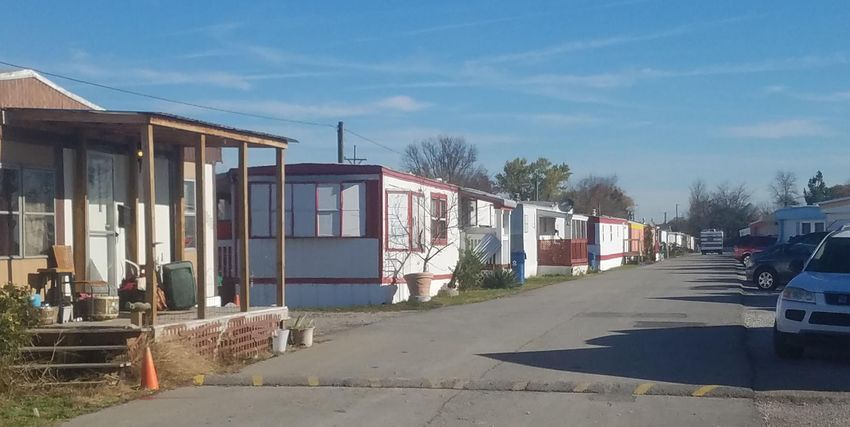
Bluegrass Mobile Home Court was built in 1959 and approved for 199 residents. Currently, 153 lots are occupied. There are 93
owner occupied lots with rents ranging from $360 to $400. The park owns 46 mobile homes that are rented furnished, utilities
included for a minimum of twelve weeks; rent payable on a weekly basis. City water and sanitary sewers are supplied by the
Park; local government is responsible for garbage collection services.
Travel camper lots are kept in rent ready condition. Camper pays $40 per night, $195 per week, or $500 per month. Amazon has
approached current owners on several occasions regarding their Camperforce Program. The new owners could significantly
increase park’s revenue by leasing empty pads to the Camerforce Program and by bringing in new homes.
.
#6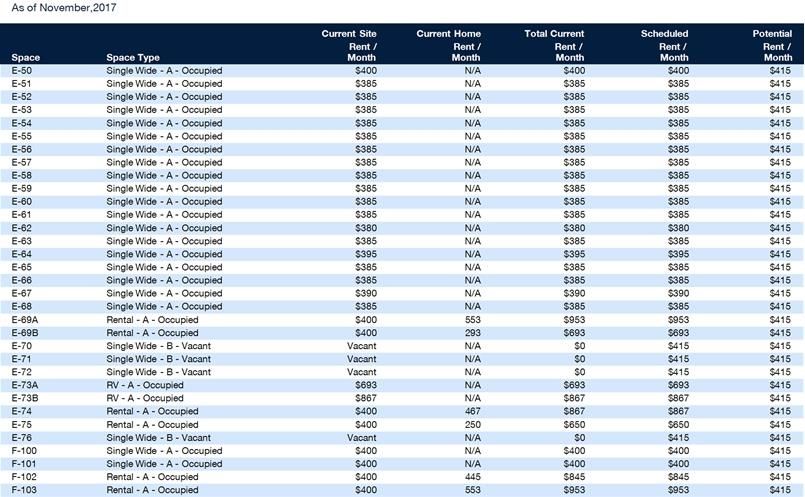
BLUEGRASS MOBILE HOME PARK

                                                                                                                                   OFFERING SUMMARY
PROPERTY SUMMARY

                                    THE OFFERING
 Property                                                   Bluegrass Mobile Home Park
 Price                                                                        $6,000,000
 Property Address                                  3510 Bluegrass Park Dr, Louisville, KY
 Type of Park                                                                     All age
                                   SITE DESCRIPTION
 Number of Spaces                                                                    199
 Vacant Spaces                                                                        46
 Number of Occupied POH                                                               46
 Year Built/Renovated                                                               1959
 Lot Size                                                                    13.21 Acres
                                                                                                                  PROPOSED FINANCING
                                                                                            First Trust Deed
                                       UTILITIES
                                                                                            Loan Amount                                      $4,500,000
                        Paid By           Meter                    Other
                                                                                            Loan Type                                      Proposed New
 Water                  Landlord
                                                                                            Interest Rate                                        5.50%
 Electric               Tenant
                                                                                            Amortization                                       30 Years
 Gas                    Landlord
                                                                                            Loan Term                                           7 Years
 Sewer                  Landlord
                                                                                            Loan to Value                                          75%
 Trash                  City
                                                                                            Debt Coverage Ratio                                    1.87
 Cable TV               Tenant

                                                                                                                                                     #7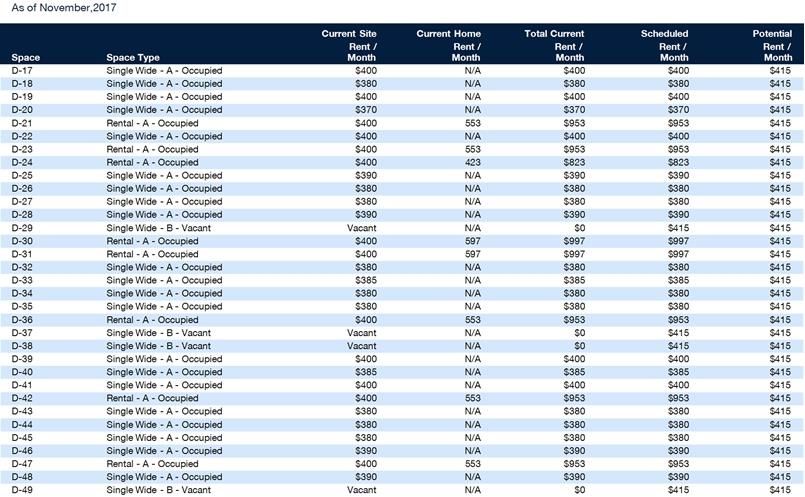
BLUEGRASS MOBILE HOME PARK

                             REGIONAL MAP

                                       8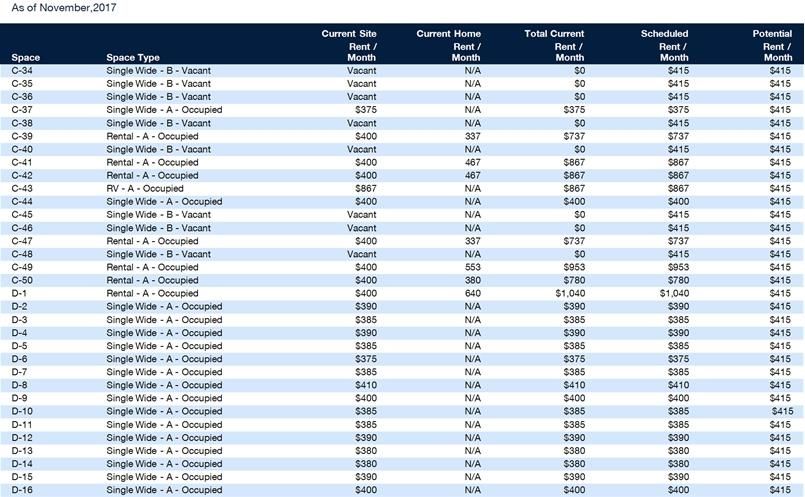
BLUEGRASS MOBILE HOME PARK

                             LOCAL MAP

                                    9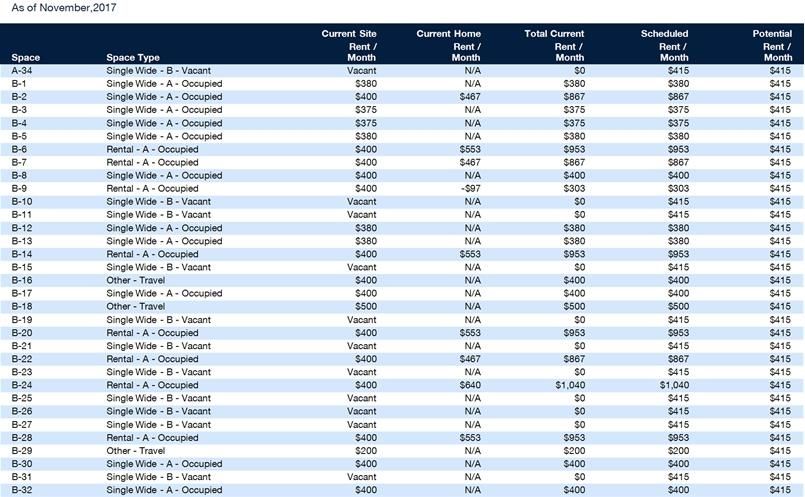
BLUEGRASS MOBILE HOME PARK

                             AERIAL PHOTO

                                      10
BLUEGRASS MOBILE HOME PARK
PROPERTY PHOTO
Marcus & Millichap closes
more transactions than any other
brokerage firm.
12
11BLUEGRASS MOBILE HOME PARK
FINANCIAL
ANALYSIS
12BLUEGRASS MOBILE HOME PARK
FINANCIAL ANALYSIS
RENT ROLL DETAIL
13BLUEGRASS MOBILE HOME PARK
FINANCIAL ANALYSIS
RENT ROLL DETAIL
14BLUEGRASS MOBILE HOME PARK
FINANCIAL ANALYSIS
RENT ROLL DETAIL
15BLUEGRASS MOBILE HOME PARK
FINANCIAL ANALYSIS
RENT ROLL DETAIL
16BLUEGRASS MOBILE HOME PARK
FINANCIAL ANALYSIS
RENT ROLL DETAIL
17BLUEGRASS MOBILE HOME PARK
FINANCIAL ANALYSIS
RENT ROLL DETAIL
18BLUEGRASS MOBILE HOME PARK
ACQUISITION FINANCING
MARCUS & MILLICHAP CAPITAL CORPORATION WHY MMCC?
CAPABILITIES Optimum financing solutions to
enhance value
MMCC—our fully integrated, dedicated financing arm—is committed to
providing superior capital market expertise, precisely managed execution, and
unparalleled access to capital sources providing the most competitive rates and Our ability to enhance buyer
terms. pool by expanding finance
options
We leverage our prominent capital market relationships with commercial banks,
life insurance companies, CMBS, private and public debt/equity funds, Fannie
Mae, Freddie Mac and HUD to provide our clients with the greatest range of Our ability to enhance
financing options. seller control
• Through buyer
Our dedicated, knowledgeable experts understand the challenges of financing
qualification support
and work tirelessly to resolve all potential issues to the benefit of our clients.
• Our ability to manage buyers
finance expectations
• Ability to monitor and
manage buyer/lender progress,
insuring timely,
predictable closings
• By relying on a world class
Closed 1,651 National platform $5.1 billion total Access to more
set of debt/equity sources
debt and equity operating national capital sources
financings within the firm’s volume in 2016 than any other and presenting a tightly
in 2016 brokerage offices firm in the underwritten credit file
industry
19BLUEGRASS MOBILE HOME PARK
FINANCIAL ANALYSIS
CASH FLOW
20BLUEGRASS MOBILE HOME PARK
MARKET
OVERVIEW
21BLUEGRASS MOBILE HOME PARK
MARKET OVERVIEW
LOUISVILLE
OVERVIEW
The Louisville metro is composed of Indiana’s Harrison, Washington,
Clark, Floyd and Scott counties, as well as Kentucky’s Jefferson,
Spencer, Oldham, Trimble, Shelby, Bullitt and Henry counties. Louisville
METRO HIGHLIGHTS
in Kentucky is the region’s most populous city with more than 618,100
CENTRALIZED LOCATION
citizens, followed by Jeffersonville, Indiana, which has 46,600 residents. Approximately 60 percent of U.S. cities are within a one-day drive of the metro,
The Ohio River cuts through the region and was an important player in providing access to large economic centers.
the region’s development. MAJOR DISTRIBUTION CENTER
Louisville’s strategic location in the country has made it a hub for the logistics
and distribution industries.
THE DERBY
Every year, attention is focused on Louisville when it hosts the Kentucky Derby,
the most acclaimed horse-racing event in the world.
ECONOMY
▪ Although the region’s economy has been historically dominated by the shipping and rail industries,
contemporary Louisville boasts a well-diversified economy focused on advanced manufacturing,
logistics, life sciences and healthcare, among other industry sectors.
▪ The UPS Worldport global air-freight hub at Louisville International Airport makes the region an
important player in global shipping and logistics.
▪ The metropolitan area is headquarters to three Fortune 500 companies: Humana, Yum Brands and
Kindred Healthcare.
DEMOGRAPHICS
2016 2016 2016 2016 MEDIAN
POPULATION: HOUSEHOLDS: MEDIAN AGE: HOUSEHOLD INCOME:
1.3M 515K 38.8 $50,500
Growth Growth U.S. Median: U.S. Median:
2016-2021*: 2016-2021*:
4% 4.6% 37.7 $57,200
* Forecast
Sources: Marcus & Millichap Research Services; BLS; Bureau of Economic Analysis; Experian; Fortune; Moody’s Analytics; U.S. Census Bureau
22BLUEGRASS MOBILE HOME PARK
MARKET OVERVIEW
MANUFACTURED HOUSING RESEARCH NATIONAL REPORT
Investors Moving Inland From Coasts Amid Occupancy Gains In the
Midwest 2017 Manufactured Housing Outlook by Region
Growing demand for manufactured housing is lifting occupancies and rents for a 10th
consecutive year. The run-up in pricing of homes, condos and apartment rents is generating East: Growing demand and a 150-basis-
renter interest in relatively affordable options in manufactured housing communities. In Tight supply and rising point drop in vacancy last year
demand in the market foreshadows further improvement this
particular, aging baby boomers seek communities located in warm climates with amenities and will tighten vacancy in year. Strengthening will be led by sub-8
recreational options. While newer, highly amenitized age-restricted communities in the Sunbelt many areas. percent vacancy in the Mid-Atlantic
remain a top choice for older renters, many of these spaces are occupied to capacity. Full subregion, where rents will be
maintained or grow slowly due to small,
occupancy at the newest properties pushes demand to smaller, older parks where lower rents older properties being filled.
attract tenants. Some of these parks are now also starting to fill vacant spaces, some of which
Midwest: A market need for quality
include lot and new home rentals. A 15 percent increase in manufactured house shipments last Higher initial returns communities supported a large
year shows the demand generated by all age groups. The majority of new homes are delivered and a greater number compression in vacancy, while rents
of listings draw buyers increased at a fast pace. Initial yields are
to the Southern region in markets from Texas to Florida. A recent rise in renter demand in the from other regions. also above coastal metros, providing
Midwest region elevated shipments by more than 20 percent last year. Vacancies in the opportunities for investors seeking
higher returns and value-add options,
Midwest have tumbled more than 300 basis points since peaking in 2012, while rents have
further elevating buyers’ interest.
grown nearly 10 percent during the same time period. The need for spaces in this region
South: Tied with the East for the second-
continues to grow at a fast pace. As home prices and apartment rents escalate, another year of Buyers will bid lowest vacancy rate among regions,
vacancy improvement in manufactured home communities will boost rents in 2017 while aggressively for quality Southern markets also had the strongest
maintaining lower rates than other housing options. properties, while value-add rent growth. Average rents are above
$550 per month in coastal Florida
options will be sought. markets, while some Texas markets
such as Austin inch closer to the $500
per month mark.
West: Rising demand for manufactured
Tight cap rates will housing communities pushed vacancy to
the lowest rate among the four regions at
make some buyers 6.5 percent. Strong fundamentals attract
shift to smaller assets investors. Cap rates will remain tight
where amenities can along the coast, which already offers
be added. some of the lowest initial yields
nationwide.
23BLUEGRASS MOBILE HOME PARK
MARKET OVERVIEW
MANUFACTURED HOUSING RESEARCH NATIONAL REPORT
Opportunities abound for buyers willing to look at smaller markets and older parks. Past years’ acquisitions by institutional players and REITs have limited the number of
active listings for five-star, age-restricted Manufactured Housing Communities, boosting interest in other sites. Fierce competition for communities with 100 spaces or more
heats up due to limited supply on the market. Meanwhile, a number of investors are developing solutions to continue purchasing properties with fewer than 100 spaces.
Upgrading existing park infrastructure in older properties and adding popular amenities can produce dramatic upside. Additional measures, such as more efficient property
management, allow cap rates for traded communities to compress further, particularly in key coastal markets. Yet, a new trend is emerging in inland markets, where
dramatic improvement in vacancies and rents provide a stronger potential for NOI growth. Investors seeking higher initial yields increasingly target the Midwest, where
returns are generally 100 to 500 basis points above coastal communities depending on quality and location. After years of overlooking these markets, some investors target
the larger pool of listings in this part of the country amid improving fundamentals. Overall, yields will remain tight with value-add locations in a variety of markets showing
potential for cap rate compression nationwide but at a more moderate pace than in prior years.
24BLUEGRASS MOBILE HOME PARK
MARKET OVERVIEW
MANUFACTURED HOUSING RESEARCH NATIONAL REPORT
East Region
Mid-Atlantic Trends
▪ Vacancy: Home price growth is maintained as employers expanded staffing levels in this subregion of the East
Coast. This dynamic supported a 270-basis-point drop in vacancy in 2016 to an average of 7.3 percent. This is
the third-lowest rate among subregions.
▪ Rents: Tenant demand boosted rent in Baltimore to $607 per month, elevating the Mid-Atlantic average to $367
per month. Raleigh rents averaged $393.
Northeast Trends
▪ Vacancy: A 100-basis-point compression left vacancy at 8.3 percent in 2016. This is 250 basis points below the
2010 level. The rate is particularly low in Long Island at 2.6 percent. New Hampshire posted the second-lowest
vacancy for the Northeast subregion at 4.4 percent.
▪ Rents: The average monthly rent remains at $457 per month. Long Island posted monthly rents above $500 on
average.
East Sales Trends
▪ Cap Rates: Demand for assets in the Mid-Atlantic rose rapidly and cap rates compressed in step. Urban assets
trade in the 5 to 6 percent range, while rural properties exchange in the 10 to 15 percent area. Northeast cap
rate spreads compressed as more smaller properties changed hands.
▪ Prices: Sales shifted from the Northeast to the Mid-Atlantic in 2016 to parks with fewer lots. As some of these
smaller properties sold, the average price per unit ticked slightly lower in the short-term to $27,300.
Sources: Marcus & Millichap Research Services;
CoStar Group, Inc.; Datacomp-JLT
25BLUEGRASS MOBILE HOME PARK
MARKET OVERVIEW
MANUFACTURED HOUSING RESEARCH NATIONAL REPORT
Midwest Region
East North Central Trends
▪ Vacancy: The need for manufactured housing communities spaces expanded in 2016, pushing vacancy 150
basis points lower to 21 percent, below the five-year trend.
▪ Rents: Rent advanced 2.2 percent, the largest increase in the past seven years, to an average of $378 per
month. Monthly rents rest above $400 in the Michigan markets of Ann Arbor, Detroit and Grand Rapids.
West North Central Trends
▪ Vacancy: The subregion’s vacancy rate plummeted 200 basis points to 14.6 percent, the lowest rate since
2009 for the area. Vacancy was tightest in Minneapolis at 8.8 percent.
▪ Rents: Average rent grew 2.6 percent annually to $395 per month. This follows a 2.9 percent gain in the prior
year.
Midwest Sales Trends
▪ Cap Rates: Cap rates rose, ranging from 6 to 15 percent, as investors targeted a wider array of properties,
boosting transactions 50 percent.
▪ Prices: Strong yields drew buyers into a variety of locations across the quality spectrum, pushing pricing up
11.4 percent annually to $25,500 per unit.
Sources: Marcus & Millichap Research Services;
CoStar Group, Inc.; Datacomp-JLT
26BLUEGRASS MOBILE HOME PARK
MARKET OVERVIEW
MANUFACTURED HOUSING RESEARCH NATIONAL REPORT
South Region
Southeast Trends
▪ Vacancy: A need for rental space in manufactured home communities placed vacancy 50 basis points lower to
8.3 percent. Florida markets along the Southeastern coast maintain tight rates in the 4 to 6 percent range.
▪ Rents: Annual rent gains of 3.7 percent pushed average rent to $479 per month, the largest increase since
2009. Rents in Sarasota’s Manatee County rose 9 percent.
Southwest Trends
▪ Vacancy: Robust job increases in the Southwest subregion supported a 220-basis-point fall in vacancy.
Vacancy rested at 6.2 percent at the end of 2016, the second-lowest level among all subregions. Shifts in the
energy sector have positively impacted this rate.
▪ Rents: Average rent added 5.1 percent, the biggest improvement among subregions, to $413 per month.
Denton, Texas, grew the most at 6.6 percent.
South Sales Trends
▪ Cap Rates: Accounting for a large share of trades, investors in the Southern region sought smaller assets with
a strong opportunity to renovate. Cap rates for all-age parks range from 8 to 10 percent, with smaller senior
communities garnering 7 percent. Prime coastal properties in Florida can exchange at initial yields near 5
percent. Assets in Texas can range up to 15 percent yields.
▪ Prices: The number of trades grew by 38 percent and accounted for a large portion of deals nationwide.
Investor demand for a variety of properties pushed the price per unit up 5.1 percent to $28,700 last year.
Sources: Marcus & Millichap Research Services;
CoStar Group, Inc.; Datacomp-JLT
27BLUEGRASS MOBILE HOME PARK
MARKET OVERVIEW
MANUFACTURED HOUSING RESEARCH NATIONAL REPORT
West Region
Mountain Trends
▪ Vacancy: The Mountain subregion’s vacancy rate fell 240 basis points to 7.5 percent last year. The Denver
market posted a dramatic 370-basis-point decline to end vacancy at 4.0 percent last year.
▪ Rents: Monthly rent grew 2.8 percent to $509, marking a ninth consecutive year of gains. The largest subregion
gain was in Salt Lake City at 9.5 percent.
Pacific Trends^
▪ Vacancy: The lowest vacancy among subregions was recorded in the Pacific, where the rate tightened 60
basis points to 2.9 percent. Vacancy was particularly tight in markets in Oregon and Washington, near 2
percent.
▪ Rents: Rent advanced 3.3 percent to $527 per month, with gains above 10 percent in Salem and in the Seattle
market, which had the highest rent of $619.
West Sales Trends
▪ Cap Rates: Most trades occurred in the West. Properties in key areas can trade at 4 percent cap rates, while
smaller assets can yield between 7 and 15 percent, including park-owned homes/notes as part of returns.
▪ Prices: Pricing inched 2.9 percent lower to $42,500 per unit as buyers moved down the quality spectrum,
trending higher in coastal markets.
^ Excludes California
Sources: Marcus & Millichap Research Services;
CoStar Group, Inc.; Datacomp-JLT
28BLUEGRASS MOBILE HOME PARK
MARKET OVERVIEW
MANUFACTURED HOUSING RESEARCH NATIONAL REPORT
Manufactured Housing Regions and Subregions
29BLUEGRASS MOBILE HOME PARK
MARKET OVERVIEW
MANUFACTURED HOUSING RESEARCH NATIONAL REPORT
Metro Performance
30PROPERTY NAME
BLUEGRASS MOBILE HOME PARK
DEMOGRAPHICS
MARKETING TEAM
Created on December 2017
POPULATION 1 Miles 3 Miles 5 Miles HOUSEHOLDS BY INCOME 1 Miles 3 Miles 5 Miles
▪ 2022 Projection ▪ 2017 Estimate
Total Population 6,903 93,641 252,741 $250,000 or More 0.65% 1.57% 1.73%
▪ 2017 Estimate $200,000 - $249,999 0.29% 1.07% 1.14%
Total Population 6,982 92,817 250,061 $150,000 - $199,999 0.82% 3.40% 3.60%
▪ 2010 Census $125,000 - $149,999 3.16% 3.10% 3.56%
Total Population 6,867 90,603 242,870 $100,000 - $124,999 6.65% 6.13% 7.17%
▪ 2000 Census $75,000 - $99,999 9.87% 11.47% 12.11%
Total Population 6,953 88,410 241,329 $50,000 - $74,999 14.11% 18.84% 19.54%
▪ Daytime Population $35,000 - $49,999 15.88% 15.27% 15.27%
2017 Estimate 19,517 117,499 326,130 $25,000 - $34,999 15.28% 12.37% 11.37%
HOUSEHOLDS 1 Miles 3 Miles 5 Miles $15,000 - $24,999 18.54% 13.55% 11.86%
▪ 2022 Projection Under $15,000 14.74% 13.23% 12.65%
Total Households 3,306 40,849 112,016 Average Household Income $50,648 $63,307 $66,863
▪ 2017 Estimate Median Household Income $36,094 $44,747 $48,574
Total Households 3,315 40,190 109,932 Per Capita Income $24,087 $27,680 $29,653
Average (Mean) Household Size 2.13 2.25 2.22
▪ 2010 Census
Total Households 3,252 39,283 106,946
▪ 2000 Census
Total Households 3,333 38,694 105,132
Source: © 2016 Experian
31PROPERTY NAME
BLUEGRASS MOBILE HOME PARK
DEMOGRAPHICS
MARKETING TEAM
Created on December 2017
POPULATION PROFILE 1 Miles 3 Miles 5 Miles POPULATION PROFILE 1 Miles 3 Miles 5 Miles
▪ Population by Age ▪ Population 25+ by Education Level
0 to 4 Years 6.76% 6.81% 6.29% 2017 Estimate Population Age 25+ 4,813 63,442 175,551
5 to 14 Years 12.06% 11.90% 11.03% Elementary (0-8) 2.39% 3.09% 2.67%
15 to 17 Years 3.40% 3.45% 3.18% Some High School (9-11) 10.22% 7.17% 6.62%
18 to 19 Years 1.79% 2.49% 2.33% High School Graduate (12) 27.91% 27.92% 26.03%
20 to 24 Years 7.05% 6.99% 6.96% Some College (13-15) 26.34% 21.95% 21.73%
25 to 29 Years 8.53% 8.13% 8.82% Associate Degree Only 7.20% 7.61% 7.40%
30 to 34 Years 7.21% 7.51% 7.90% Bachelors Degree Only 15.42% 17.99% 20.18%
35 to 39 Years 5.79% 6.32% 6.64% Graduate Degree 9.51% 13.13% 14.40%
40 to 49 Years 11.77% 11.93% 11.93%
50 to 59 Years 15.36% 13.82% 13.69%
60 to 64 Years 6.53% 6.00% 6.14%
65 to 69 Years 4.47% 4.49% 4.83%
70 to 74 Years 2.91% 3.08% 3.25%
75 to 79 Years 2.21% 2.36% 2.49%
80 to 84 Years 2.03% 2.01% 2.01%
Age 85+ 2.14% 2.70% 2.50%
Median Age 37.69 37.06 37.53
Source: © 2016 Experian
32PROPERTY NAME
BLUEGRASS MOBILE HOME PARK
DEMOGRAPHICS
MARKETING TEAM
Population Race and Ethnicity
In 2016, the population in your selected geography is 6,982. The The current year racial makeup of your selected area is as follows:
population has changed by 0.42% since 2000. It is estimated that the 41.99% White, 47.82% Black, 0.03% Native American and 2.07%
population in your area will be 6,903.00 five years from now, which Asian/Pacific Islander. Compare these to US averages which are:
represents a change of -1.13% from the current year. The current 70.42% White, 12.85% Black, 0.19% Native American and 5.53%
population is 47.27% male and 52.73% female. The median age of the Asian/Pacific Islander. People of Hispanic origin are counted
population in your area is 37.69, compare this to the US average independently of race.
which is 37.83. The population density in your area is 2,220.07 people
per square mile. People of Hispanic origin make up 9.23% of the current year
population in your selected area. Compare this to the US average of
17.88%.
Households Housing
There are currently 3,315 households in your selected geography. The The median housing value in your area was $128,538 in 2016,
number of households has changed by -0.54% since 2000. It is compare this to the US average of $193,953. In 2000, there were
estimated that the number of households in your area will be 3,306 1,894 owner occupied housing units in your area and there were 1,439
five years from now, which represents a change of -0.27% from the renter occupied housing units in your area. The median rent at the
current year. The average household size in your area is 2.13 time was $441.
persons.
Income Employment
In 2016, the median household income for your selected geography is In 2016, there are 12,792 employees in your selected area, this is also
$36,094, compare this to the US average which is currently $56,286. known as the daytime population. The 2000 Census revealed that
The median household income for your area has changed by 12.63% 55.90% of employees are employed in white-collar occupations in this
since 2000. It is estimated that the median household income in your geography, and 44.10% are employed in blue-collar occupations. In
area will be $41,029 five years from now, which represents a change 2016, unemployment in this area is 4.52%. In 2000, the average time
of 13.67% from the current year. traveled to work was 21.00 minutes.
The current year per capita income in your area is $24,087, compare
this to the US average, which is $30,982. The current year average
household income in your area is $50,648, compare this to the US
average which is $81,217.
Source: © 2016 Experian
33BLUEGRASS MOBILE HOME PARK
8 DEMOGRAPHICS
34You can also read