BIENNIAL REPORT 2022 2021 RN and 2021 LPN Renewal Survey Data - Nebraska Center for Nursing
←
→
Page content transcription
If your browser does not render page correctly, please read the page content below
2022
BIENNIAL REPORT
2021 RN and 2021 LPN Renewal Survey Data

https://center4nursing.nebraska.gov   Phone: 402-471-4376
                                      301 Centennial Mall
                                      South. Lincoln, NE
                                      68509-4986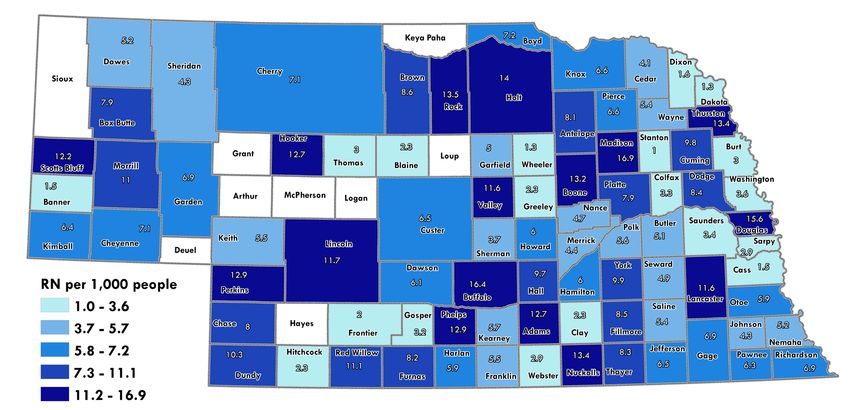
The Nebraska Center for Nursing
https://center4nursing.nebraska.gov

Executive Director: Ann Oertwich, PhD, RN
DHHS, Division of Public Health, Licensure Unit
301 Centennial Mall South Nebraska
Lincoln, NE 68509
Phone: (402) 471-0317, Fax: (402) 471-1066
ann.oertwich@nebraska.gov

Nursing Education Consultant: Jacci Reznicek, EdD, RN, ANP-BC

Nursing Practice Consultant: Kathy Hoebelheinrich MSN, APRN-NP, ANP-BC

Independent Consultant: Juan-Paulo Ramírez, PhD

January 2022 – Lincoln, Nebraska
Report based on 2021 RN renewal data and 2021 LPN renewal data. 1

Photo Source: This Photo by Unknown Author is licensed under CC BY

1The data collection process for both, the 2021 RN and 2021 LPN renewal surveys, ended on October 31st, 2021.
Data provided by DHHS, System Automation (December, 2021).
3

Table of Contents
EXECUTIVE SUMMARY .......................................................................................................... 4
THE NEBRASKA NURSING WORKFORCE .......................................................................... 4
METHODOLOGY .................................................................................................................... 6
THE NEBRASKA REGISTERED NURSE & LICENSED PRACTICAL NURSE WORKFORCE8
   Nebraska Workforce Distribution across Rural and Urban Counties.......................13
   Nebraska Nursing Workforce by Demographic Cohort ............................................19
   Satisfaction Levels with the Nursing Profession ............................................................22
NURSING WORKFORCE PROJECTIONS .........................................................................23
   Nursing Workforce Model ..............................................................................................23
   Nursing Workforce Gap by Economic Region .............................................................27
ACKNOWLEDGMENTS .......................................................................................................29
APPENDIX ..............................................................................................................................30
NEBRASKA CENTER FOR NURSING – LIST OF BOARD MEMBERS ..............................32
THE NEBRASKA CENTER OF NURSING: WHO WE ARE ................................................34
STRATEGIC PLAN .................................................................................................................35
   Vision...................................................................................................................................35
   Mission ................................................................................................................................35
   Strategic Focus #1: Data ................................................................................................35
   Strategic Focus #2: Collaboration .................................................................................35
   Strategic Focus #3: Promotion ........................................................................................35
4 EXECUTIVE SUMMARY THE NEBRASKA NURSING WORKFORCE As of January 2022, the number of individuals who hold Nebraska nursing licenses is 31,425 RNs; 3,951 APRNs; and 5,296 LPNs (DHHS). The 2022 biennial report illustrates nearly 2,600 fewer nurses (RNs, APRNs, and LPNs) working in Nebraska when compared to 2018/19 (24,531 vs. 27,106, respectively), which represents a decrease of 9.5% in the nursing workforce. Between 2018/19 and 2021, Nebraska lost on average 1.5 nurses per 1,000 people (14 nurses per 1,000 people in 2018/19 vs. 12.5 nurses per 1,000 people in 2021). The number of nurses included in the data analysis and report that follows represent the sample of nurses based on surveys returned a renewal. The sample size consisted of 20,526 RNs (1,921 are APRNs), and 4,018 LPNs, whose principal employment is in Nebraska. Based on the Center for Nursing Supply and Demand model data in 2020, there was an existing shortage of 4,191 nurses (RNs, APRNs, and LPNs). 6.9% of nurses (RNs and APRNs) are very likely to leave their primary employment over the next 12 months compared to 5.9% in 2018. The largest generation group of nurses who are planning to leave their employment are Generation Y/Millennials (43%), followed by Baby Boomers (25%), and then by Generation X (24%). Nearly 1,000 nurses between the ages of 24 and 55 are “very likely” to leave their employment over the next 12 months. They represent two-thirds of all nurses who are planning to leave their employment over the next 12 months. Travel nurses (RNs and APRNs) increased 34% between 2018 and 2021, showing the additional workforce needed to meet demand. Traveling nurses earn an average of $18,000 annually more compared to ‘staff nurses’ in Nebraska ($76,486 vs. $58,435 respectively). According to the 2021 RN/APRN Renewal Survey, nine counties reported zero RNs or APRNs working in them: Arthur, Deuel, Grant, Hayes, Keya Paha, Logan, Loup, McPherson, and Sioux. The 2021 LPN Renewal Survey reported zero
5
LPNs working in twelve counties: Arthur, Banner, Blaine, Frontier, Grant, Hayes,
Keya Paha, Logan, Loup, McPherson, Sioux, and Thomas. There are eight
counties with zero RNs/APRNs or LPNs working in them: Arthur, Grant, Hayes,
Keya Paha, Logan, Loup, McPherson, and Sioux.
Counties with zero RNs/APRNs: Counties with zero LPNs:
The median age of RNs has remained stable over the years. The current (2020)
median age is 43.0, and nationwide the median age is 52 years. The median
age for LPNs is 47. 5, and nationwide the median age for LPNs is 53 years.
(NCSBN, 2020) 2.
The percentage of males that are Registered Nurses has steadily increased over
the years, reaching a high of 6.5% in the year 2020. Male participation within
the LPN workforce has historically been lower than the RN workforce, although
male participation has grown in previous years, reaching 3.2% in 2019. The
male participation among LPNs slightly decreased in 2021(3.1%). The
percentage of males within Nebraska RNs and LPNs is still lower than the
national average (9.4% and 8.1% respectively). (NCSBN, 2020).
RNs who are considered ethnic minorities have also increased over the years,
from 3.1% in the year 2000 to 8% in the year 2020. Among LPNs, minority
representation has also increased over time, from 4.6% in 2003 to 13.1% in
2
The 2020 National Nursing Workforce Survey. National Council of State Boards of Nursing (NCSBN).
https://www.journalofnursingregulation.com/action/showPdf?pii=S2155-8256%2821%2900027-2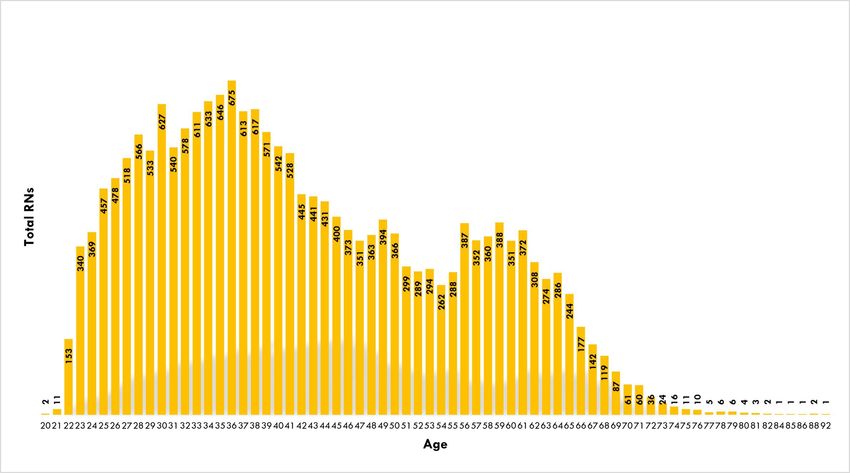
6
2021. At the state level, 21.6% of the population is considered a minority 3.
Nationwide, 19.4% of RNs and 30.5% of LPNs are considered minorities
(NCSBN, 2020).
In terms of education attainment, RNs with bachelor’s degrees and higher have
increased 22.1% from the year 2008 to the year 2021 (51.3% vs. 73.4 %,
respectively 4). At the national level, 65.2% of RNs hold bachelor’s degrees or
higher (NCSBN, 2020). Also, RNs with doctoral degrees have substantially
increased, from 74 RNs with doctoral degrees (DNP, EdD, and PhD.) in 2003 to
a total of 569 RNs in 2021 (669% growth).
Forty seven percent of RNs work in Nebraska hospitals which is lower than the
national data (54.8%; NCSBN, 2020 5). Only 8.7% of Nebraska LPNs work in
hospitals. In comparison, at the national level, 29.3% of LPNs work in hospitals.
About four out of ten LPNs work in Nursing Homes/Extended Care/ Assisted
Living Facility (41%).
METHODOLOGY
The 2022 Center for Nursing Biennial Report contains nursing workforce data
analysis for RNs 6 and LPNs collected through the renewal surveys from
2020/21 and 2021, respectively. The biennial report contains information
about nursing workforce projections from the year 2020 through the year
2025 for RNs, APRNs, and LPNs based on a multiregional nursing supply and
demand model for each of the nine Nebraska economic regions. This model is
one of a few multiregional nursing workforce models available in the United
States that projects the nursing workforce at the regional level by considering
degrees of urbanization (i.e., urban vs. rural/frontier) and nursing intensity
factors by setting (i.e., hospital, long-term care, education).
The Nebraska Center for Nursing has been analyzing nursing workforce data
since the year 2000, collected from surveys completed by Registered Nurses
(RNs), Advanced Practice Registered Nurses (APRNs), and Licensed Practical
Nurses (LPNs) upon renewing their respective nursing licenses. These surveys
are analyzed to identify nurses who only work in the State of Nebraska to
provide clear demographic estimates of the nursing workforce providing
3 U.S. Census Bureau (ACS 1- year 2020 Estimate).
4 Includes bachelor and higher degrees in nursing and non-nursing fields.
5 The 2020 National Nursing Workforce Survey. National Council of State Boards of Nursing (NCSBN).
https://www.journalofnursingregulation.com/action/showPdf?pii=S2155-8256%2821%2900027-2
6 The RN Renewal Survey also includes APRN data.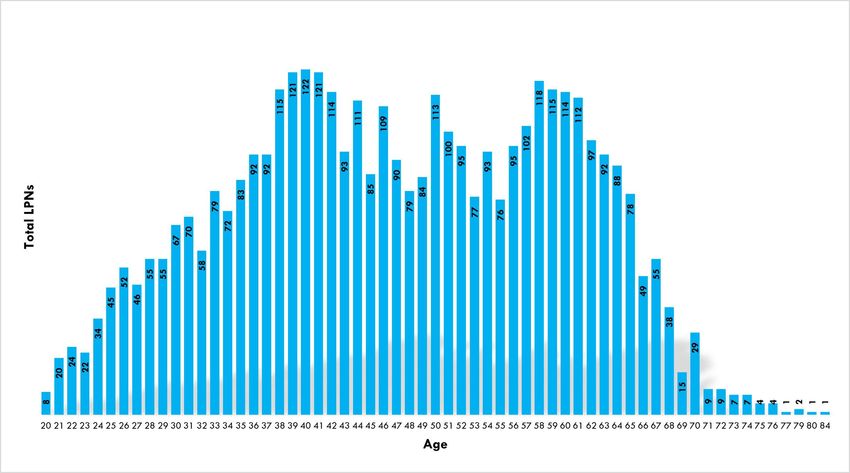
7
health care to the citizens of the State. Nursing workforce is provided by
urban and rural counties based on the DHHS Office of Rural Health
classification (see map in Appendix, page 32). Nursing projections, including
demand and supply of nurses, are calculated using the full-time equivalent
(FTE).

The renewal surveys are collected by the Nebraska DHHS Licensure Unit in
both digital and paper formats, to gather information that includes
demographic data, job location, work settings, incivility/bullying, and
satisfaction levels of the nursing profession and workplaces. The renewal
surveys comply with the minimum dataset developed by the National Forum of
State Nursing Workforce Centers. The RN renewal survey contains 35
questions, and the LPN renewal survey contains 28 questions, which can be
cross-tabulated, to enrich the statistical analysis of the workforce data. The
Nebraska Center for Nursing invites nurses and the general public interested in
these databases to request additional information by directly contacting the
Executive Director of the Center, Ann Oertwich, at
ann.oertwich@nebraska.gov.
8
THE NEBRASKA REGISTERED NURSE &
LICENSED PRACTICAL NURSE WORKFORCE
Workforce Size and Distribution
January 2022 DHHS Licensure Unit data revealed the number of nurses who hold a
Nebraska license to include 31,425 RNs; 3,951 APRNs; and 5,296 LPNs.
Workforce data is collected from licensees during biennial license renewal cycles.
A total of 20,526 surveys were received from RNs (2020/21) and 4,018 surveys
from LPNs (2021) and analyzed representing the sample nurses who indicated work
in the State of Nebraska. Nine counties reported zero RNs working in them: Arthur,
Deuel, Grant, Hayes, Keya Paha, Logan, Loup, McPherson, and Sioux. The highest
number of RNs was reported in Douglas County (n = 9,132), followed by Lancaster
County (n = 3,758). Three counties reported having just one RN working in them:
Banner, Blaine, and Wheeler.
Twelve counties reported zero LPNs working in them: Arthur, Banner, Blaine,
Frontier, Grant, Hayes, Keya Paha, Logan, Loup, McPherson, Sioux, and Thomas.
The highest number of LPNs was reported in Douglas County (n = 871), followed by
Lancaster County (n = 655). One county reported having just one LPN working:
Wheeler.
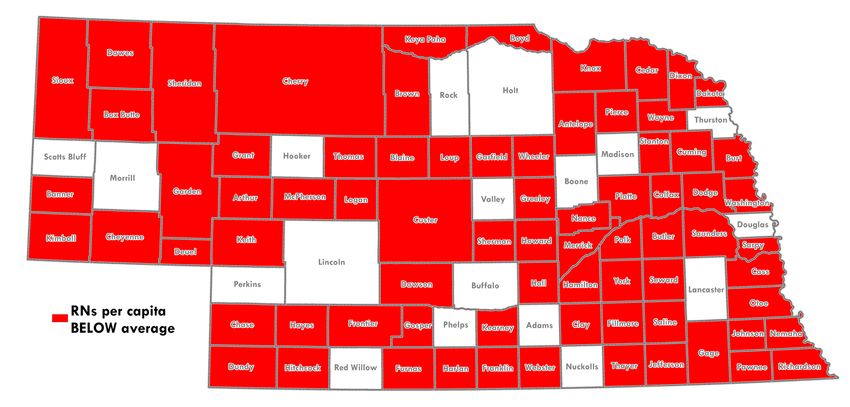
The total per capita number of RNs (2020/21) and LPNs (2021) is 10.5 and 2.0
per 1,000 people, respectively. (See Appendix for details, pages 30-31). The
table below shows the RN and LPN workforce and the total number of inhabitants
by county in 2020 (U.S. Census Bureau population estimates). Counties highlighted
in red show a lower number of RNs per capita compared to the state average.
These counties total 75 out of the 93 counties in the State of Nebraska. See Table
1 and Figure 1 below.
Table 1: Nebraska Nursing Workforce
2020 Total RNs per LPNs per
RNs 2021 LPNs 2021
County: Population 1,000 1,000
Adams 31,205 397 61 12.7 2.0
Antelope 6,295 51 15 8.1 2.4
Arthur 434 0 0 0.0 0.0
Banner 674 1 0 1.5 0.0
Blaine 431 1 0 2.3 0.0
Boone 5,379 71 33 13.2 6.1
Box Butte 10,842 86 49 7.9 4.5
Boyd 1,810 13 7 7.2 3.9
9

             2020 Total                          RNs per   LPNs per
                          RNs 2021   LPNs 2021
County:      Population                           1,000     1,000
 Brown         2,903         25         6         8.6        2.1
 Buffalo       50,084       819        175        16.4       3.5
 Burt          6,722         20         11        3.0        1.6
 Butler        8,369         43         22        5.1        2.6
 Cass          26,598        41         18        1.5        0.7
 Cedar         8,380         34         19        4.1        2.3
 Chase         3,893         31         13        8.0        3.3
 Cherry        5,455         39         13        7.1        2.4
 Cheyenne      9,468         67         35        7.1        3.7
 Clay          6,104         14         12        2.3        2.0
 Colfax        10,582        35         18        3.3        1.7
 Cuming        9,013         88         20        9.8        2.2
 Custer        10,545        69         32        6.5        3.0
 Dakota        21,582        27         9         1.3        0.4
 Dawes         8,199         43         13        5.2        1.6
 Dawson        24,111       146         62        6.1        2.6
 Deuel         1,838         0          3         0.0        1.6
 Dixon         5,606         9          6         1.6        1.1
 Dodge         37,167       314         70        8.4        1.9
 Douglas      584,526      9,132       871        15.6       1.5
 Dundy         1,654         17         14        10.3       8.5
 Fillmore      5,551         47         30        8.5        5.4
 Franklin      2,889         16         8         5.5        2.8
 Frontier      2,519         5          0         2.0        0.0
 Furnas        4,636         38         19        8.2        4.1
 Gage          21,704       149        123        6.9        5.7
 Garden        1,874         13         11        6.9        5.9
 Garfield      1,813         9          7         5.0        3.9
 Gosper        1,893         6          2         3.2        1.1
 Grant          611          0          0         0.0        0.0
 Greeley       2,188         5          7         2.3        3.2
 Hall          62,895       610        188        9.7        3.0
 Hamilton      9,429         57         21        6.0        2.2
 Harlan        3,073         18         4         5.9        1.3
 Hayes          856          0          0         0.0        0.0
 Hitchcock     2,616         6          5         2.3        1.9
 Holt          10,127       142         32        14.0       3.2
 Hooker         711          9          3         12.7       4.2
 Howard        6,475         39         11        6.0        1.7
 Jefferson     7,240         47         42        6.5        5.8
 Johnson       5,290         23         13        4.3        2.5
 Kearney       6,688         38         15        5.7        2.2
 Keith         8,335         46         8         5.5        1.0
 Keya Paha      769          0          0         0.0        0.0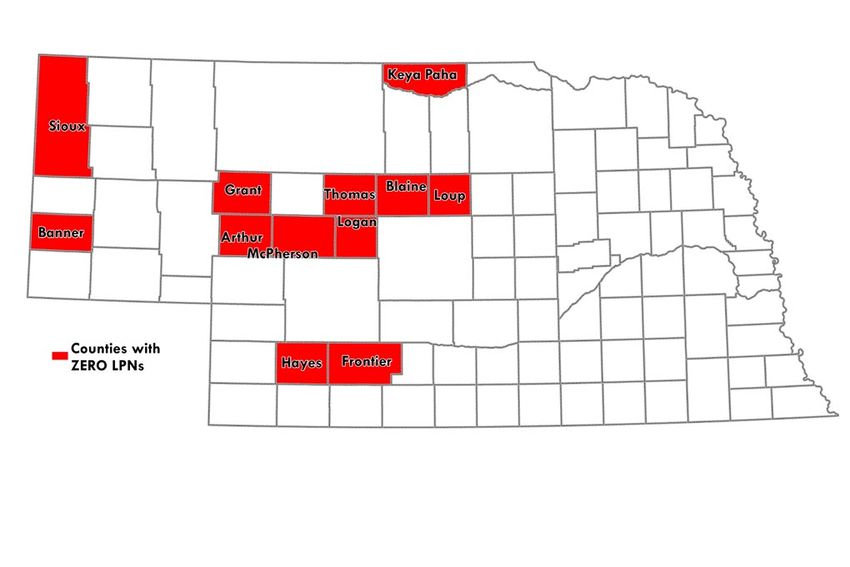
10

                   2020 Total                          RNs per   LPNs per
                                RNs 2021   LPNs 2021
County:            Population                           1,000     1,000
 Kimball             3,434         22         5         6.4        1.5
 Knox                8,391         55        16         6.6        1.9
 Lancaster          322,608       3758       655        11.6       2.0
 Lincoln             34,676       405        102        11.7       2.9
 Logan                716          0          0         0.0        0.0
 Loup                 607          0          0         0.0        0.0
 McPherson            399          0          0         0.0        0.0
 Madison             35,585       600        151        16.9       4.2
 Merrick             7,668         34        15         4.4        2.0
 Morrill             4,555         50        14         11.0       3.1
 Nance               3,380         16        16         4.7        4.7
 Nemaha              7,074         37        19         5.2        2.7
 Nuckolls            4,095         55        10         13.4       2.4
 Otoe                15,912        94        34         5.9        2.1
 Pawnee              2,544         16         9         6.3        3.5
 Perkins             2,858         37         6         12.9       2.1
 Phelps              8,968        116        44         12.9       4.9
 Pierce              7,317         48        29         6.6        4.0
 Platte              34,296       271        100        7.9        2.9
 Polk                5,214         29        16         5.6        3.1
 Red Willow          10,702       119        44         11.1       4.1
 Richardson          7,871         54        37         6.9        4.7
 Rock                1,262         17        11         13.5       8.7
 Saline              14,292        77        37         5.4        2.6
 Sarpy              190,604       554        124        2.9        0.7
 Saunders            22,278        75        28         3.4        1.3
 Scotts Bluff        36,084       439        130        12.2       3.6
 Seward              17,609        87        31         4.9        1.8
 Sheridan            5,127         22        13         4.3        2.5
 Sherman             2,959         11         5         3.7        1.7
 Sioux               1,135         0          0         0.0        0.0
 Stanton             5,842         6          9         1.0        1.5
 Thayer              5,034         42        28         8.3        5.6
 Thomas               669          2          0         3.0        0.0
 Thurston            6,773         91         9         13.4       1.3
 Valley              4,059         47        15         11.6       3.7
 Washington          20,865        75        22         3.6        1.1
 Wayne               9,697         52        15         5.4        1.5
 Webster             3,395         10        10         2.9        2.9
 Wheeler              774          1          1         1.3        1.3
 York                14,125       140        45         9.9        3.2
Total population   1,961,504     20,520      4,011      10.5       2.0
11
“Per capita [nursing] supply does not take into account differences in
population age, disease prevalence, [intensity factors] or the number of
hospital beds that must be staffed. Still, it is informative because it
illustrates that [state]-level information masks substantial local-level
differences.” Adapted from HRSA report (2013).
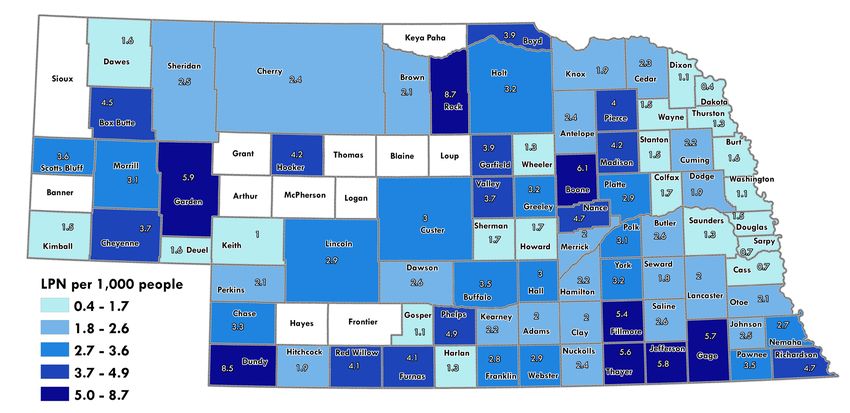
Figures 2 and 3 show Nebraska per capita RN/APRN and LPN per 1,000 people
by county. These graphic representations help to identify the diversity of the
nursing workforce needed at the county and regional levels.12 Figure 2: Nebraska RN/APRN Workforce per 1,000 People, by County
13
Nebraska Workforce Distribution across Rural and Urban Counties

A total of 18,038 RNs/APRNs and 2,973 LPNs work in urban counties. And a total
of 2,482 RNs and 1,038 LPNs work in rural counties. One-fourth (25.9%) of LPNs
work in rural counties, while only 12.1% of RNs/APRNs work in those areas. As the
state nursing workforce data is reported where nurses work and the national data
is reported where nurses live, it’s not possible to compare both geographies. As a
proxy, 24% of LPNs nationwide live in rural areas, which is lower than the
percentage of LPNs who work in rural areas in Nebraska. However, nationwide
data of RNs living in rural areas is 16%, which is higher than the percentage of
reported of RNs working in rural areas of Nebraska (12.1%). As a reference, 18%
of the total population in Nebraska live in rural counties (DHHS, 2016) 7. Figure 4
shows the nursing workforce distribution in rural and urban areas of Nebraska.

Figure 4: Nebraska Nursing Workforce Distribution in Rural and Urban Areas

                                                Urban      Rural

                2,482                                                                357,849
                                                   1,038

               18,038                                                              1,603,655
                                                   2,973

             RN/AP RN                               LP N                           NE BRAS K A

7 Nebraska DHHS (2016). Disparities Demographic Data Recommendations. Division of Public Health. Department of
Health & Human Services. November 2016. Available at:
https://dhhs.ne.gov/Reports/Disparities%20Demographic%20Data%20Recommendations%20-%202016.pdf (see
page 32 in the Appendix for more details).
14
Counties classified as urban by Nebraska DHHS present the highest number of RNs
per capita in Nebraska. On average, there are 11.2 RNs per 1,000 people in
urban counties compared to 6.9 RNs in rural counties.
Counties classified as rural by Nebraska DHHS present the highest number of LPNs
per capita in Nebraska. On average, there are 2.9 LPNs per capita in urban
counties compared to 1.9 LPNs in urban counties. Table 2 compares the per capita
number of RNs and LPNs that work in urban vs. rural counties in Nebraska.
Table 2: RN and LPN per capita by Urban and Rural Counties in Nebraska
Urban County Rural County
Nurse Type:
per capita per capita
RNs 11.2 6.9
LPNs 1.9 2.9
RNs in urban areas are more likely to hold a bachelor’s degree or higher than RNs
working in rural areas (75.6% vs. 53.9%, respectively). RNs working in rural
counties are more likely to be 50 years of age and older in comparison to RNs
working in urban counties (36.0% vs. 29.4%, respectively). On average, RNs
working in rural counties are 2.6 years older than RNs working in urban counties.
RNs in rural counties are less likely to work in hospitals and more likely to work in
Nursing Homes/Extended Care Facilities when compared to RNs working in urban
counties.
LPNs working in rural areas are more likely to be white non-Hispanic when
compared to LPNs working in urban counties (94.9% vs. 84.1%, respectively). LPNs
in rural counties are more likely to work in Nursing Homes than LPNs working in
urban counties (40.0% vs. 30.1%, respectively). The following Tables 3 and 4 show
demographics and employment characteristics for RNs and LPNs by urban and rural
areas in Nebraska.15
Table 3: Residential Distribution of the RN/APRN Workforce - Urban and Rural Areas in Nebraska
Urban Areas Rural Areas All Areas
Age (RN/APRN)
(%) (%) (%)
25 or younger 7.2% 4.8% 6.8%
26-30 14.1% 11.4% 13.8%
31-35 15.4% 13.6% 15.3%
36-40 15.4% 14.2% 15.3%
41-45 11.2% 11.5% 11.4%
46-50 9.2% 10.3% 9.4%
51-55 7.3% 7.6% 7.3%
56-60 9.1% 11.0% 9.3%
61-65 7.4% 9.4% 7.5%
66-70 2.8% 4.6% 3.0%
71 or older 0.9% 1.7% 1.0%
Total 100.0% 100.0% 100.0%
Average age 42.7 45.2 43.0
Race/Ethnicity
White 91.5% 95.7% 92.0%
Black/African American 2.3% 0.5% 2.1%
Hispanic/Latino 3.3% 2.0% 3.2%
Asian 1.6% 0.7% 1.5%
American Indian/Alaska Native 0.2% 0.5% 0.2%
Native Hawaiian or Other Pacific
0.2% 0.0% 0.2%
Islander
Other 0.9% 0.7% 0.9%
Total 100% 100% 100%
Gender
Female 93.2% 95.9% 93.5%
Male 6.8% 4.1% 6.5%
Total 100% 100% 100%
Education (highest degree attained) – Includes nursing and non-nursing degrees
RN Diploma 6.2% 11.3% 6.9%
Associate's 17.8% 34.4% 19.8%
Bachelor's 57.1% 42.7% 55.4%
Master's 14.5% 9.4% 13.9%
Post Graduate Certificate 1.3% 1.2% 1.3%
Doctoral 3.0% 0.9% 2.8%
Total 100.0% 100.0% 100.0%16
Urban Areas Rural Areas All Areas
Setting (RN/APRN)
(%) (%) (%)
Ambulatory Surgical 4.9% 1.8% 4.5%
Assisted Living 0.6% 1.0% 0.6%
Birthing Center 0.4% 0.0% 0.3%
Clinic 15.9% 14.5% 15.8%
College Health 0.4% 0.1% 0.4%
Correctional/Prison 0.3% 0.7% 0.3%
Developmental Disability 0.3% 0.5% 0.3%
Dialysis Center 0.7% 0.7% 0.7%
Emergency Department 2.7% 2.6% 2.7%
Federally Qualified Health Center (FQHC) 0.4% 0.0% 0.4%
Health Department 0.3% 0.9% 0.4%
Home Health 3.1% 3.8% 3.2%
Hospice/Palliative Care 1.3% 1.2% 1.3%
Hospital 48.1% 45.3% 47.7%
Industry/Sales/IT 0.4% 0.1% 0.3%
Insurance 1.5% 0.2% 1.3%
Military /DoD 0.1% 0.0% 0.1%
Nursing Home (SNF/NF) 5.2% 14.7% 6.3%
Occupational/Employee/Workplace Health 0.7% 0.7% 0.7%
Other 3.7% 1.8% 3.4%
Policy/Planning/Regulatory/ Licensing 0.1% 0.0% 0.1%
Psych-Mental Health 1.7% 0.3% 1.6%
Public Health 0.7% 1.4% 0.8%
Research 0.5% 0.0% 0.5%
Retail Clinic 0.2% 0.0% 0.2%
Rural Health Clinic 0.2% 3.3% 0.5%
School Health Service 1.7% 3.5% 1.9%
Substance Use/Addiction 0.1% 0.3% 0.1%
University/Academic 2.2% 0.4% 2.0%
Urgent Care 0.4% 0.1% 0.4%
VA Facility 1.0% 0.0% 0.9%
Volunteer Clinic 0.0% 0.0% 0.0%
Total 100.0% 100.0% 100.0%17
Table 4: Residential Distribution of the LPN Workforce across Urban and Rural Areas in Nebraska
Urban Areas Rural Areas All Areas
Age (LPN)
(%) (%) (%)
25 or younger 3.8% 4.0% 3.8%
26-30 7.2% 5.8% 6.9%
31-35 9.5% 7.6% 9.0%
36-40 14.2% 11.4% 13.5%
41-45 13.5% 11.9% 13.1%
46-50 11.6% 12.6% 11.8%
51-55 10.3% 12.8% 11.0%
56-60 12.9% 15.4% 13.6%
61-65 11.2% 12.6% 11.6%
66-70 4.6% 4.7% 4.6%
71 or older 1.1% 1.2% 1.1%
Total 100.0% 100.0% 100.0%
Average age 47.3 48.8 47.7
Race/Ethnicity
White 84.1% 94.9% 86.9%
Black/African American 7.0% 0.5% 5.3%
Hispanic/Latino 6.2% 2.9% 5.4%
Asian 1.0% 0.4% 0.9%
American Indian/Alaska Native 0.2% 0.9% 0.4%
Native Hawaiian or Other Pacific 0.3% 0.1% 0.3%
Islander
Other 1.1% 0.3% 0.9%
Total 100% 100% 100%
Gender
Female 96.5% 97.8% 96.9%
Male 3.5% 2.2% 3.1%
Total 100% 100% 100%18
Urban Areas Rural Areas All Areas
Setting (LPN)
(%) (%) (%)
Ambulatory Care Setting (Clinic) 7.0% 3.3% 6.1%
Ambulatory Surgical Center 0.0% 0.1% 0.1%
Assisted Living 0.2% 0.2% 0.2%
Birthing Center 0.0% 0.0% 0.0%
Clinic 29.9% 22.5% 28.0%
College Health 0.3% 0.0% 0.2%
Correctional/Prison 1.3% 0.7% 1.1%
Developmental Disability 1.3% 1.1% 1.2%
Dialysis Center 0.3% 0.2% 0.3%
Emergency Department 0.2% 0.3% 0.2%
Federally Qualified Health Center (FQHC) 0.3% 0.1% 0.3%
Health Department 0.2% 0.5% 0.3%
Home Health 6.7% 3.1% 5.8%
Hospice/Palliative Care 1.4% 0.2% 1.1%
Hospital 6.5% 19.0% 9.7%
Industry/Sales/IT 0.2% 0.0% 0.2%
Insurance 0.5% 0.2% 0.4%
Military /DoD 0.1% 0.0% 0.1%
Nursing Home (SNF/NF) 30.1% 40.0% 32.6%
Occupational/Employee/Workplace Health 1.1% 0.6% 1.0%
Other 4.9% 3.1% 4.4%
Policy/Planning/Regulatory/Licensing 0.0% 0.0% 0.0%
Psych-Mental Health 1.5% 0.1% 1.2%
Public Health 0.6% 0.5% 0.6%
Research 0.2% 0.0% 0.1%
Retail Clinic 0.1% 0.1% 0.1%
Rural Health Clinic 0.3% 1.8% 0.7%
School Health Service 2.5% 1.5% 2.2%
Substance Use/Addiction 0.3% 0.5% 0.3%
University/Academic 0.2% 0.0% 0.2%
Urgent Care 0.6% 0.4% 0.6%
VA Facility 1.1% 0.1% 0.8%
Total 100% 100% 100%19
Nebraska Nursing Workforce by Demographic Cohort
Figures 5 and 6 show the age frequency of RNs/APRNs and LPNs by demographic
cohort. Table 5 shows the percentage of RNs/APRNs and LPNs that belong to each
generation. As a whole, “Millennials” (GenY) (born 1982- 2000) represents the
highest concentration of nurses in the State of Nebraska (43%), followed by 30%
“Generation X” (born 1965-1981). “Baby Boomers” represent 22% of the total
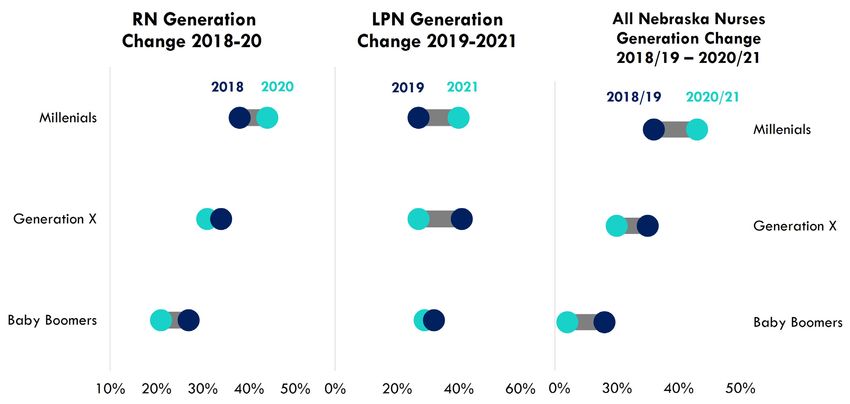
nursing workforce. Figure 7 shows the change in percentage from 2018 to either
2020 or 2021; the Silent Generation was not included in figure 7 because it
represents less than 1.0% of the total nursing workforce.
Figure 5: Nebraska RN/APRN Age Frequency (2021) by Demographic Cohort
Millennials (Gen Y) Generation X Baby Boomers Silent Generation
(1982-2000) (1965-1981) (1946-1964) (1927-1945)20
Figure 6: Nebraska LPN Age Frequency (2021) by Demographic Cohort
Silent
Millennials (GenY) Generation X Baby Boomers Generation
(1982-2000) (1965-1981) (1946-1964) (1927-1945)
Table 5: Nebraska Representation of the Nursing Workforce in Percentage by Generation
All Nebraska All Nebraska
RN - RN - LPN - LPN -
Nurses – Nurses –
2018 2021 2019 2021
Generation: 2018/19 2021
Generation Z - 4% - 4% - 4%
Millennials
38% 44% 27% 40% 36% 43%
(GenY)
Generation X 34% 31% 41% 27% 35% 30%
Baby Boomers 27% 21% 32% 29% 28% 22%
Silent Generation 1% 0.3% 1% 0.2% 1% 0.3%
Total 100% 100% 100% 100% 100% 100%21 Figure 7: Generation Change for Nebraska RNs (2020/21), LPNs (2021), and All Nebraska Nurses* *The Silent Generation and Generation Y were not included in the chart because of their low representation. Figure 7 (above) shows the percentage of generation change for Nebraska RNs and LPNs and all Nebraska Nurses between the past renewal cycle (2018 RN/2019 LPN) and the current renewal cycle (2020/21 RN and LPN). The percentage of nurses represented by each generation is depicted by color coded bullet points in blue for the past renewal survey (2018/19) and cyan for the current renewal survey (2020/21). Figure 7 portrays that Millennials (GenY) nurses substantially increased their representation during the last renewal cycle (cyan circle representing the current nursing workforce moved to the right of the blue bullet point), whereas nurses from Generation X and Baby Boomers substantially decreased their representation (cyan circle moved to the left of the blue circle that represents the past renewal cycle).
22
Satisfaction Levels with the Nursing Profession
Historically nurses in Nebraska have shown high levels of satisfaction with their
nursing profession. Figure 8 illustrates satisfaction levels with “nursing as a career”
for RNs in 2021 and for LPNs in 2021. Table 6 compares satisfaction levels for RNs
and LPNs between 2018/19 and 2021.
Figure 8: 2021 RN and LPN satisfaction levels with their nursing career
Table 6: RN and LPN satisfaction and dissatisfaction levels with their nursing career (2018/19
compared to 2021)
2018/19 Total 2021 Total 2018/19 Total 2021 Total
Satisfied Satisfied Dissatisfied Dissatisfied
RN 97.4% 97.1% 2.6% 2.9%
LPN 97.7% 96.1% 2.3% 3.9% (*)
(*) The percentage increase of total dissatisfaction with their nursing career among
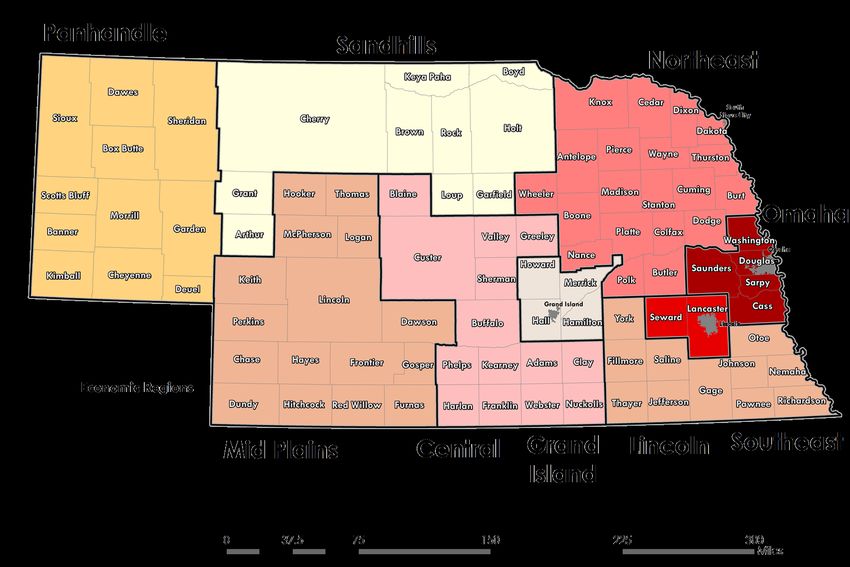
LPNs is statistically significant (p < .0001).23 NURSING WORKFORCE PROJECTIONS Nursing Workforce Model Purpose: The Nursing Workforce Model is used to predict nursing workforce supply and demand for Registered Nurses (RNs), Advanced Practice Registered Nurses (APRNs), and Licensed Practical Nurses (LPNs) until the year 2025. The nursing workforce projections remain unchanged since 2018 when these projections were made. The nursing projections will be adjusted once the U.S. Census Bureau releases the 2020 Decennial data. What it is: The Nursing Workforce Model is a forecasting policy tool that provides a picture of the alternative future supply and demand under different scenarios and simulations for the nine economic regions defined by the Nebraska Department of Labor (DOL). The forecasting models use these regions as geographic areas to identify nursing workforce needs over time. Economic Regions: The Nebraska nursing workforce model uses the nine economic regions as geographic units to project the supply and demand of nurses (RNs, APRNs, and LPNs). The Nebraska DOL uses employer and employee information to create job flows known as “Local Employment Dynamics (LED).” The Economic Development Regions defined by DOL are based on work commuting patterns (LED) across cities and counties, along with demographics and employment data. See Figure 9.
24
 Figure 9: The “9 Economic Regions”

Table 7 shows counties that belong to each of the nine economic regions:
Table 7: Nebraska Economic Regions and Respective Counties
  Economic
                       Counties
  Region
                       Banner, Box Butte, Cheyenne, Dawes, Deuel, Garden, Kimball,
  1. Panhandle
                       Morrill, Scotts Bluff, Sheridan, Sioux
                       Arthur, Boyd, Brown, Cherry, Garfield, Grant, Holt, Keya
  2. Sandhills
                       Paha, Loup, Rock
                       Chase, Dawson, Dundy, Frontier, Furnas, Gosper, Hayes,
  3. Mid Plains        Hitchcock, Hooker, Keith, Lincoln, Logan, McPherson, Perkins,
                       Red Willow, Thomas
                       Adams, Blaine, Buffalo, Clay, Custer, Franklin, Greeley,
  4. Central
                       Harlan, Kearney, Nuckolls, Phelps, Sherman, Valley, Webster
  5. Grand Island      Hall, Hamilton, Howard, Merrick
25
Antelope, Boone, Burt, Butler, Cedar, Colfax, Cuming,
6. Northeast Dakota, Dixon, Dodge, Knox, Madison, Nance, Pierce, Platte,
Polk, Stanton, Thurston, Wayne, Wheeler
7. Omaha
Cass, Douglas, Sarpy, Saunders, Washington
Consortium
8. Lincoln MSA Lancaster, Seward
Fillmore, Gage, Jefferson, Johnson, Nemaha, Otoe, Pawnee,
9. Southeast
Richardson, Saline, Thayer, York
Major Findings
Overall, the nursing supply and demand model projects a nursing shortage of
5,436 nurses through the year 2025. It is expected that the nursing workforce in
the State of Nebraska will grow by 3.8% between 2020 and 2025. The highest
growth will be experienced by RNs (4.7%), followed by LPNs (1.8%). APRNs will
experience a negative growth between 2020 and 2025 (-1.1%). Table 8 illustrates
the expected growth and nursing workforce gap for each type of nurse in the State
of Nebraska through the year 2025. 8
Table 8: Nursing Workforce Projections and supply gaps (unfilled FTE positions) for RNs, APRNs,
and LPNs
2025 Expected Nursing
Nurse Type: Growth, 2020-2025
Workforce Gap
RN 4.7% -3,238
APRN -1.1% -592
LPN 1.8% -1,606
Total Nursing Workforce
3.8% -5,436
Expected Growth
Figure 10 shows that all nurse types will experience a workforce shortage that will
increase each year from 2020 through 2025.
8 Projection estimates from the 2016 RN Renewal Survey and 2017 LPN Renewal Survey. Estimates will be updated
using the most recent nursing workforce data (2020 RN Renewal Survey and 2021 LPN Renewal Survey) in 2022.
Population demographics (age, gender, and urban vs. rural population) will also be updated using the 2020
Population Census data when available at the county level.26
27
Nursing Workforce Gap by Economic Region

As expected, economic regions that contain the highest number of nurses will
experience the highest demand for additional nurses to meet the nursing workforce
needs from the population. The Omaha Consortium (Douglas, Sarpy, Washington,
and Cass counties) and Lincoln Metropolitan Statistical Area - MSA (Seward and
Lancaster counties) Economic Regions encompass two-thirds of the total RN shortage
in the year 2020. Figure 11 shows the gap proportion for unfilled RN positions in
each economic region.

Figure 11: 2020 Proportion of unfilled RN positions in relation to the total by economic region

Omaha
Consortium
and Lincoln
MSA
                                                                                                                              -184
Economic                                                                                         -473
Regions
represent
two-thirds
of the 2020
RN                                               -1,239                                                 -125               -95
shortage.
                                                                                     -151

                                                                                                        -103            -83          -30

The following tables show the total number of unfilled FTE nursing positions (RNs,
APRNs, and LPNs) in the years 2020 and 2025 (Tables 9 and 10).
Table 9: 2020 projected unfilled FTEs positions for RNs, APRNs, and LPNs by economic region
                                                           Grand
            Panhandle   Sandhills   Mid Plains   Central             Northeast      Omaha     Lincoln     Southeast   State Total
                                                           Island
RNs            -125         -30         -95        -151      -103       -184         -1,239     -473            -83      -2,482
APRNs           3          -1            1         -79        0          2           -246      -104             -1       -423
LPNs           -61         -19         -75        -110       -54       -123          -593      -168            -84      -1287
Total
Unfilled      -182         -50        -168        -339      -157       -305         -2,077     -745            -167     -4,191
Positions
  Note: positive numbers show a surplus and negative numbers a shortage of nurses
28
Table 10: 2025 projected unfilled FTEs positions for RNs, APRNs, and LPNs by economic region
Mid Grand State
Panhandle Sandhills Central Northeast Omaha Lincoln Southeast
Plains Island Total
RNs -146 -23 -115 -185 -127 -191 -1,572 -745 -132 -3,238
APRNs -4 -1 -4 -93 -3 -16 -316 -150 -5 -592
LPNs -64 -18 -86 -127 -76 -133 -783 -244 -74 -1,606
Total
Unfilled -215 -42 -205 -406 -206 -340 -2,671 -1,139 -211 -5,436
Positions
Note: negative numbers show a shortage of nurses
As expected, the Omaha Consortium and Lincoln MSA economic regions will
encompass 70% of the total nursing shortage in Nebraska by the year 2025.
RN workforce shortage will increase by 30% between 2020 and 2025
APRN workforce shortage will increase by 40% between 2020 and 2025
LPN workforce shortage will increase by 25% between 2020 and 2025
Overall, total FTE nursing shortage will increase by
30% between 2020 and 202529
ACKNOWLEDGMENTS
Organizations:
Nebraska Center for Nursing and its Board of Directors
Nebraska Board of Nursing
Nebraska Hospital Association
Nebraska Organization of Nurse Leaders
Nebraska Assembly of Nursing Deans and Directors
Individuals:
Ann Oertwich, PhD, Executive Director, Nebraska Board of Nursing and
Nebraska Center for Nursing.
Lisa Walters, Chair of the Nebraska Center for Nursing
Lina Bostwick, Chair of the Nebraska Center for Nursing Foundation
Theresa Delahoyde, Chair of the Nebraska Assembly of Nursing Deans and
Directors
Becky Wisell, Nebraska DHHS Licensure Unit
Jacci Reznicek, EdD, RN, ANP-BC, DHHS Nurse Consultant
Kathy Hoebelheinrich MSN, APRN-NP, ANP-BC, DHHS Nurse Consultant
The staff of the Nebraska Center for Nursing for their support30 APPENDIX Chart 1 shows Nebraska per capita supply of RNs/APRNs which varies from a high of 16.9 per 1,000 people in Madison County, to a low of 1.0 nurse per 1,000 people in Stanton County. Chart 2 shows Nebraska per capita supply of LPNs which varies from a high of 8.7 per 1,000 people in Rock County, to a low of 0.4 per 1,000 people in Dakota County.
31
Chart 1: Nebraska per Capita RN Workforce, Ranked by County
32
Chart 2: Nebraska per Capita LPN Workforce, Ranked by County

 NEBRASKA CENTER FOR NURSING – LIST OF
           BOARD MEMBERS
                                    (as of 9/2021):

                       Name                           Board position

                Tamara Allen            Member Selected by Governor

                Sheila Bjerrum          Recommended by the State Board of Health

                Lina Bostwick
                                        Selected by Governor
                (Secretary)
                                        Hospital Industry Representative
                Kathy Bowman
                                        Selected by Governor
                                        Nurse Educator Recommended by Board of
                Beth Burbach
                                        Regents of the University of Nebraska
                Suszanne Deyke          RN, Selected by Governor

                Charity Ebert           Long-Term Care Industry Representative

                Ronda Ehly              RN, Selected by Governor
                Christi Glesmann        Independent Colleges Representative
                                        Nurse Educator Recommended by the
                Kathy Harrison
                                        Nebraska Community College Association
                Joan Nelson             Recommended by Board of Health
                D. J. Scrivner          Recommended by Board of Health
                Lisa Walters
                                        RN, Selected by Governor
                (Chair)

                Laura Weber             Selected by Governor

                LPN Position
                (Vacant)
33
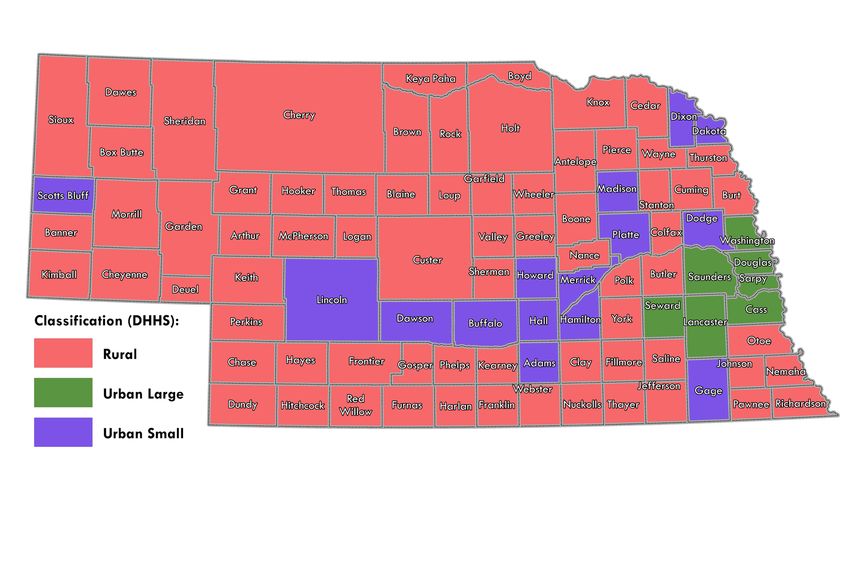
Figure 12: Urban and Rural Counties in Nebraska (DHHS, Office of Rural Health)
Source: Nebraska DHHS (2016). Disparities Demographic Data Recommendations. Division of Public Health.
Department of Health & Human Services. November 2016.
The counties included within each category consist of:
Urban‐Large (7 counties): Cass, Douglas, Lancaster, Sarpy, Saunders, Seward, Washington
Urban‐Small (15 counties): Adams, Buffalo, Dakota, Dawson, Dixon, Dodge, Gage, Hall,
Hamilton, Howard, Lincoln, Madison, Merrick, Platte, Scotts Bluff
Rural (71 counties): Antelope, Arthur, Banner, Blaine, Boone, Box Butte, Boyd, Brown, Burt,
Butler, Cedar, Chase, Cheyenne, Cherry, Clay, Colfax, Cuming, Custer, Dawes, Deuel,
Dundy, Fillmore, Franklin, Frontier, Furnas, Garden, Garfield, Gosper, Grant, Greeley,
Harlan, Hayes, Hitchcock, Holt, Hooker, Jefferson, Johnson, Kearney, Keith, Keya Paha,
Kimball, Knox, Logan, Loup, McPherson, Morrill, Nance, Nemaha, Nuckolls, Otoe, Pawnee,
Perkins, Phelps, Pierce, Polk, Red Willow, Richardson, Rock, Saline, Sheridan, Sherman,
Sioux, Stanton, Thayer, Thomas, Thurston, Valley, Wayne, Webster, Wheeler, York34 THE NEBRASKA CENTER OF NURSING: WHO WE ARE The Nebraska Center for Nursing (CFN) was created via LB 1025 by the Nebraska Legislature on July 13, 2000, to monitor the nursing workforce in Nebraska including supply and demand, recruitment, retention, and utilization of nurses. The Center consists of a 16-member board, composed primarily of nurses from across Nebraska appointed by the Governor (see list of board members in the Appendix). The Center is funded through nursing licensure fees and meets approximately six times a year. The primary goals for the center are: (1) To develop a strategic statewide plan to alleviate the nursing shortage in Nebraska by: (a) Establishing and maintaining a database on nursing supply and demand in Nebraska, including current supply and demand and future projections; and (b) Selecting priorities from the plan to be addressed. (2) To convene various groups representative of nurses, other health care providers, business and industry, consumers, legislators, and educators to: (a) Review and comment on data analysis prepared for the center. (b) Recommend systemic changes, including strategies for implementation of recommended changes; and (c) Evaluate and report the results of these efforts to the Legislature and the public. (3) To enhance and promote recognition, reward, and renewal activities for nurses by: (a) Proposing and creating recognition, reward, and renewal activities; and (b) Promoting media and positive image-building efforts for nursing. Source: Laws 2000, LB 1025, § 3. Effective date July 13, 2000. The Center produces biennial and annual reports on Nursing Workforce Data. The Center has recently purchased and implemented a state-of-the-art workforce supply and demand model. This one-of-a-kind model utilizes Nebraska nursing supply data and projects demand for nurses based on information from the nine economic regions of the state. This biennial report highlights the work of this dynamic group.
35
THE NEBRASKA CENTER OF NURSING:
STRATEGIC PLAN
Vision
Nebraska Nurses: when and where we need them
Mission
The Nebraska Center for Nursing drives change in the nursing workforce
through data, education, and policy development
Strategic Focus #1: Data
Provide essential, reliable forecasting and workforce information resulting in
equitable access and distribution of nurses.
Strategic Focus #2: Collaboration
Collaborate with key stakeholders to address the nursing shortage in
Nebraska
Collaborate to build and maintain the current workforce
Maintain competency/skill level of the current workforce
Strategic Focus #3: Promotion
Promote the value of the nursing profession
Develop the image and the voice of the CFN
We are Building Healthier Communities through Nursing:
Nebraska nurses are key to promoting health and creating
communities in which everyone has access to high-quality careYou can also read