Before the Bell An Ameriprise Investment Research Group Publication Nov. 24, 2021
←
→
Page content transcription
If your browser does not render page correctly, please read the page content below
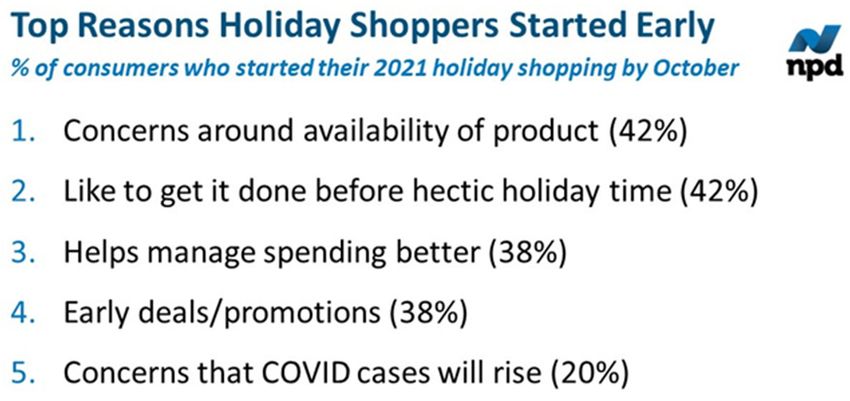
Before the Bell An Ameriprise Investment Research Group Publication Nov. 24, 2021 Starting the Day U.S. futures pointing to a lower open Asian equities finished mixed overnight European equities mostly lower on COVID fears 10-year Treasury yield flat at +1.66% Germany considering a COVID lockdown West Texas Intermediate (WTI) oil trading flat at $78.40 Market Perspectives Patrick Diedrickson, CFA, Senior Consumer Analyst In addition to comments related to overnight activity and pre-market conditions, each Wednesday, we feature commentary from members of the Ameriprise Global Asset Allocation Committee discussing investment considerations targeting their specific area of expertise. The comments are intended to provide additional insight into Committee allocation recommendations. Black Friday Versus Cyber Monday?: The holiday season is defined as the period between Thanksgiving and Christmas that comprises peak season shopping for most of the retail industry. Traditionally, the holiday season starts the day after Thanksgiving on Black Friday, and it is typically a day of large promotions by retailers with heavy discounts. Typically, Black Friday is one of the busiest shopping days of the year, and the sales performance generated on Black Friday is often considered a leading indicator for the strength of retail sales for the overall holiday season, as well as the fourth quarter. According to NPD, Black Friday has been the busiest shopping day of the year for each of the last three years. Cyber Monday is the first Monday after Thanksgiving, and it is often seen as the kickoff of the online holiday shopping season. Many online retailers use Cyber Monday to launch big promotions to drive online traffic and sales activity. Cyber Monday has been the second busiest shopping day of the year for each the last three years, according to NPD. We believe holiday season shoppers are prepared to start early in 2021 to make sure gifts are under the tree in time for Christmas. The well-publicized port disruptions are having a material impact on shipping times. According to a survey by Shopkick, 22% of consumers said they plan to start their 2021 holiday season shopping earlier than last year, with 10% expected to complete most of their shopping before Halloween and 25% before Thanksgiving. We believe mall traffic could increase materially during the 2021 holiday season because holiday season shoppers want to avoid shipping delays and ensure that gifts are under the tree in time for Christmas. According to data from Adobe, out of stock messages from online retailers have increased 172% heading into the holiday season compared to the pre-pandemic period. The apparel category has the highest out-of-stock levels currently, followed by sporting goods, baby products and electronics. The graphic at right is sourced from NPD Group. In our view, holiday season promotional activity could be less than previous years because longer shipping times have led to low inventory levels for NOTE: FOR IMPORTANT DISCLOSURES, INCLUDING POSSIBLE CONFLICTS, PLEASE SEE THE DISCLOSURE PAGES AT THE END OF THIS DOCUMENT. © 2021 Ameriprise Financial, Inc. All rights reserved.
Before the Bell - Nov. 24, 2021 | Page 2

several retailers.    Typically, reduced
promotional activity could lead to higher
gross profit margin for retailers, but we
believe higher labor costs and increased
shipping costs could lead to relatively flat
gross margins this holiday season.
According to the Adobe Digital Economy
Index, U.S. consumers are estimated to
pay an average of 9% more year/year
during Cyber Week this year. Adobe
estimates 2021 overall holiday season
discounts to be approximately 5%-to-25%
compared to the historical average of
10%-to-30%. The graphic at right is
sourced from the National Retail
Federation.

According to data from Adobe, some of
the top sales performing toys for the 2021
holiday season are estimated to be The
Tamagotchi Pix, Pop Fidget, Got2Glow Fairy Finder, Baby Yoda, and Gabby’s Dollhouse. Adobe estimates other top
performing holiday season gifts could be the Nintendo Switch OLED, PlayStation 5, Xbox Series S/X, Airpods Max, smart
mugs, Instant Pot, smart water bottles, Metroid Dread, Battlefield 2042, Pokemon Brilliant Diamond & Shining Pearl, drones,
and record players.

We maintain our view that the overall fundamental outlook remains favorable for the retail industry. In our view, this could
potentially be one of the best holiday seasons in at least 10 years, and we project retail industry sales could exceed 10%
year/year growth. The Ameriprise Global Asset Allocation Committee has an Equalweight rating on the Consumer
Discretionary sector.

U.S. Pre-Market Indicators / Overnight International Market Activity

United States: Equity markets are set to open lower on Wednesday following some lower than Street projected earnings
results from retailers. The retailers primarily cited supply or supply chain issues rather than demand.

Europe: European markets are mostly lower amid fears that Germany, the largest economy in the region may join
Austria and put its economy on lockdown to stem the tide of a significant COVID outbreak . France’s CAC 40 index
was down 0.3%, and Germany’s DAX 30 was 0.6% lower, while in London the FTSE 100 gained 0.1%.
Asia-Pacific: Equities were mostly lower in Asia on Wednesday. In Japan, the Nikkei 225 closed 1.6% lower. The
Shanghai composite closed 0.1% higher. The Hang Seng Index in Hong Kong was up 0.1%. South Korea’s KOSPI
index was down 0.1%.

                                               This space intentionally left blank.

© 2021 Ameriprise Financial, Inc. All rights reserved.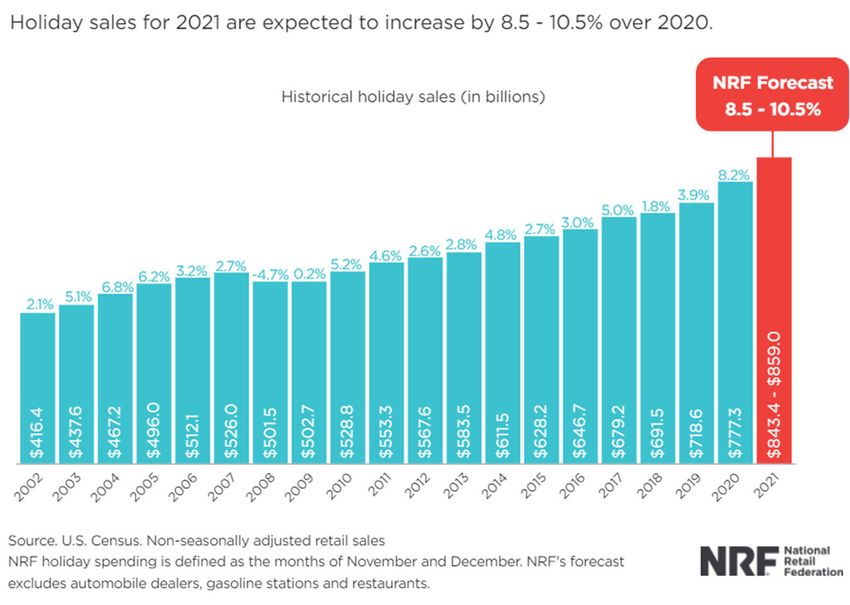
Before the Bell - Nov. 24, 2021 | Page 3
WORLD CAPITAL MARKETS
11/24/2021 As of: 8:30 AM ET
Americas % chg. % YTD Value Europe (Intra-day) % chg. %YTD Value Asia/Pacific (Last Night) % chg. %YTD Value
S&P 500 0.2% 26.5% 4,690.7 DJSTOXX 50 (Europe) -0.4% 23.2% 4,267.4 Nikkei 225 (Japan) -1.6% 8.4% 29,302.7
Dow Jones 0.5% 19.0% 35,813.8 FTSE 100 (U.K.) 0.2% 16.4% 7,277.7 Hang Seng (Hong Kong) 0.1% -7.0% 24,685.5
NASDAQ Composite -0.5% 23.2% 15,775.1 DAX Index (Germany) -0.7% 15.4% 15,825.0 Korea Kospi 100 -0.1% 4.7% 2,994.3
Russell 2000 -0.1% 18.8% 2,327.9 CAC 40 (France) -0.3% 29.4% 7,022.5 Singapore STI 0.0% 17.1% 3,227.2
Brazil Bovespa 0.0% -12.9% 103,648 FTSE MIB (Italy) 0.0% 21.2% 26,937.0 Shanghai Comp. (China) 0.1% 3.4% 3,592.7
S&P/TSX Comp. (Canada) 0.2% 26.0% 21,453.8 IBEX 35 (Spain) -0.1% 11.4% 8,810.2 Bombay Sensex (India) -0.6% 23.4% 58,341.0
Mexico IPC 1.2% 18.3% 51,116.3 MOEX Index (Russia) -0.4% 25.7% 3,944.8 S&P/ASX 200 (Australia) -0.2% 17.8% 7,399.4
Global % chg. % YTD Value Developed International % chg. %YTD Value Emerging International % chg. %YTD Value
MSCI All-Country World Idx -0.2% 18.0% 749.2 MSCI EAFE -0.7% 10.6% 2,311.1 MSCI Emerging Mkts -0.5% -0.8% 1,255.4
Note: International market returns shown on a local currency basis. The equity inde x data shown above is o n a to tal return basis, inclusive o f dividends.
S&P 500 Sectors % chg. % YTD Value Equity Income Indices % chg. % YTD Value Commodities
Communication Services -0.4% 22.9% 270.5 JPM Alerian MLP Index 1.6% 32.1% 183.3 Futures & Spot (Intra-day) % chg. % YTD Value
Consumer Discretionary -0.6% 27.7% 1,654.0 FTSE NAREIT Comp. TR 0.8% 32.4% 26,819.2 CRB Raw Industrials 0.4% 27.6% 651.6
Consumer Staples 0.7% 11.8% 761.2 DJ US Select Dividend 0.8% 29.4% 2,828.0 NYMEX WTI Crude (p/bbl.) -0.3% 61.4% 78.3
Energy 3.0% 57.6% 432.1 DJ Global Select Dividend 0.0% 20.6% 249.1 ICE Brent Crude (p/bbl.) -0.2% 58.6% 82.1
Financials 1.5% 38.2% 667.3 S&P Div. Aristocrats 0.3% 22.7% 4,089.2 NYMEX Nat Gas (mmBtu) -0.2% 95.3% 5.0
Health Care 0.1% 18.1% 1,541.9 Spot Gold (troy oz.) -0.1% -5.9% 1,786.8
Industrials 0.2% 21.1% 896.3 Spot Silver (troy oz.) -0.6% -10.9% 23.5
Materials 0.1% 23.7% 555.4 Bond Indices % chg. % YTD Value LME Copper (per ton) -0.3% 26.5% 9,805.0
Real Estate 1.1% 35.6% 302.7 Barclays US Agg. Bond -0.4% -2.4% 2,333.9 LME Aluminum (per ton) -0.9% 35.2% 2,668.5
Technology -0.2% 30.5% 2,965.3 Barclays HY Bond -0.4% 3.8% 2,427.2 CBOT Corn (cents p/bushel) 0.7% 34.6% 592.5
Utilities 0.1% 10.6% 343.1 CBOT Wheat (cents p/bushel) 0.1% 35.2% 868.8
Foreign Exchange (Intra-day) % chg. % YTD Value % chg. % YTD Value % chg. % YTD Value
Euro (€/$) -0.4% -8.3% 1.12 Japanese Yen ($/¥) 0.0% -10.3% 115.16 Canadian Dollar ($/C$) -0.2% 0.2% 1.27
British Pound (£/$) -0.2% -2.3% 1.34 Australian Dollar (A$/$) -0.3% -6.3% 0.72 Swiss Franc ($/CHF) -0.3% -5.4% 0.94
Data/Price Source: Bloomberg. Equity Index data is total return, inclusive of dividends, where applicable.
Global Equity Regions - Tactical Views
MSCI All-Country GAAC GAAC MSCI All-Country GAAC GAAC
World Index GAAC Tactical Recommended World Index GAAC Tactical Recommended
Weight Tactical View Overlay Weight Weight Tactical View Overlay Weight
United States 58.4% Overweight 3.0% 61.4% Latin America 0.9% Equalweight - 0.9%
Europe ex U.K. 13.2% Overweight 3.0% 16.2% Asia-Pacific ex Japan 14.2% Underweight -2.0% 12.2%
United Kingdom 3.5% Equalweight - 3.5% Japan 6.0% Underweight -3.0% 3.0%
Canada 2.8% Equalweight - 2.8% Middle East / Africa 1.0% Underweight -1.0% 0.0%
as of: September 30, 2021
Index weightings are based on the regional market capitalizations of the MSCI All-Country World Index as of 09/24/2021. The GAAC Tactical Overlay, as well as the Recommended Tactical Weights, are derived
from the Ameriprise Global Asset Allocation Committee (GAAC). Views are expressed relative to the Index and are provided to represent investment conviction in each region. Tactical Allocations are designed to
augment Index returns over a 6-12 month time horizon. Numbers may not add due to rounding.
Ameriprise Global Asset Allocation Committee (GAAC)
U.S. Equity Sector - Tactical Views
S&P 500 GAAC GAAC S&P 500 GAAC GAAC
Index GAAC Tactical Recommended Index GAAC Tactical Recommended
Weight Tactical View Overlay Weight Weight Tactical View Overlay Weight
Information Technology 28.1% Overweight 2.0% 30.1% Communication Services 11.2% Equalweight - 11.2%
Financials 11.2% Overweight 2.0% 13.2% Energy 2.6% Equalweight - 2.6%
Industrials 8.0% Overweight 2.0% 10.0% Real Estate 2.6% Equalweight - 2.6%
Health Care 13.4% Equalweight - 13.4% Materials 2.6% Equalweight - 2.6%
Consumer Discretionary 12.3% Equalweight - 12.3% Consumer Staples 5.7% Underweight -4.0% 1.7%
Utilities 2.5% Underweight -2.0% 0.4%
As of: September 30, 2021
Index weightings represent the respective market capitalization of each sector in the S&P 500 as of 09/24/2021. The GAAC Tactical Overlay, as well as Recommended Tactical Weights, is derived from the Ameriprise Global
Asset Allocation Committee (GAAC).Views are expressed relative to the Index and are provided to represent investment conviction in each region. Tactical Allocations are designed to augment Index returns over a 6-12
month time horizon. Numbers may not add due to rounding.
© 2021 Ameriprise Financial, Inc. All rights reserved.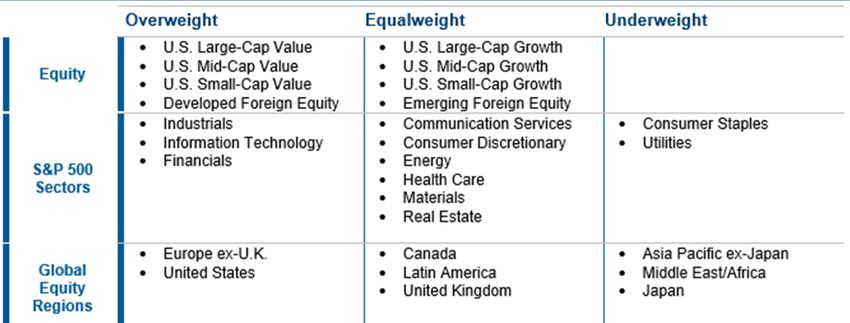
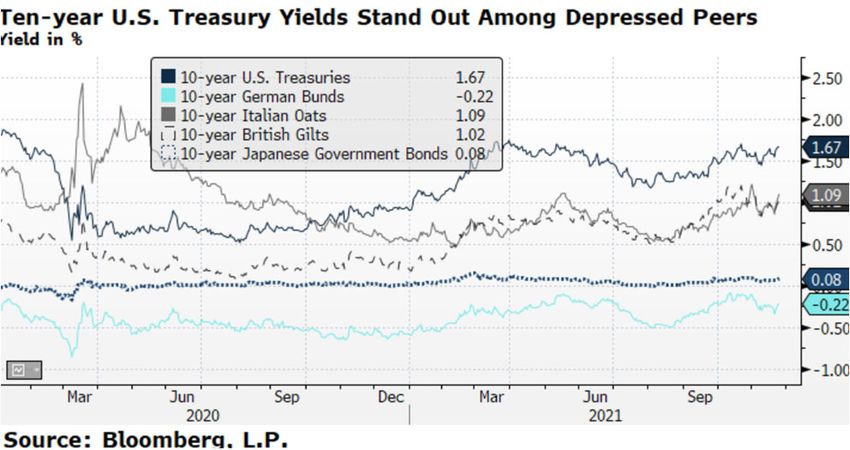
Before the Bell - Nov. 24, 2021 | Page 4

Fixed Income Perspectives
Brian M. Erickson, CFA – Vice President, Fixed Income Strategy
U.S. bond markets close for the Thanksgiving Holiday Thursday, and close early at 2:00 PM ET on Friday.
Taking Stock of the Bond Market: Heading into the final five weeks of 2021, we reflect on where we stand today for global
bond markets as context for where we may start the new year. The pace of growth, inflation and economic reopening leave
nations, both developed and emerging, still firmly in a multi-speed recovery.

Year to date the Bloomberg US Aggregate Index provided a -2.4% total return as the rise in Treasury yields and steepening
of the Treasury curve proved too much headwind for the modest coupons hig- quality bonds offer today.

Copious amounts of liquidity supported bond markets and economies as the pandemic made several trips around the world.
As a result, risk assets, including US High Yield Bonds destinations for incremental funds. Bloomberg’s US High Yield Index
outperformed the US Aggregate with a 3.8% total return. The JPMorgan Emerging Market Bond Index lagged with a -2.7%
year-to-date total return, but stocks were the winner with the S&P 500 up 24.8% year to date as of this morning.

Looking at 10-year global sovereign debt yields, we see greater dispersion than at the start of 2021, which makes sense
given the unique challenges of inflation and reopening in each region. Though 10-year yields in the U.S., Britain and Italy
progressed somewhat higher, yields on German and Japan debt remained anchored, leading to a still quite sizable $12.5
trillion of global debt trading at a negative yield. At the start of 2022, we see the multi-speed recovery reflected even in
developed sovereign debt markets. While global monetary policy likely evolves through next year, we believe the liquidity
deployed in 2020 likely takes 12 to 24 months to reabsorb, leaving risk assets poised to outperform.

Economic News and Views:
Russell T. Price, CFA – Chief Economist

Releases for Wednesday, November 24, 2021                          All times Eastern. Consensus estimates via Bloomberg

Time           Period     Release                               Consensus Est.       Actual       Prior      Revised to
8:30 AM        Nov. 20    Initial Claims                           260k              199k         268k        270k
8:30 AM        Nov. 13    Continuing Claims                        2030k             2049k        2080k
8:30 AM        Q3-S       Q3-Real GDP – Second Estimate            +2.2%             +2.1%        +2.0%
8:30 AM        Q3-S       Q3 Personal Consumption                  +1.6%             +1.7%        +1.6%
8:30 AM        OCT        Advance Goods Trade Balance              -$95.0B           -82.9B       -96.3B

8:30 AM        OCT        New Orders for Durable Goods (MoM)         +0.2%           -0.5%        -0.3%
8:30 AM        OCT        Durables Ex. Transports (MoM)              +0.5%           +0.5%        +0.5%

10:00 AM       OCT        Personal Income (MoM)                      +0.2%                        -0.3%
10:00 AM       OCT        Personal Spending (MoM)                    +1.0%                        +0.6%
10:00 AM       OCT        PCE Deflator (MoM)                         +0.7%                        +0.3%
10:00 AM       OCT        Core PCE Deflator (MoM)                    +0.4%                        +0.2%
10:00 AM       OCT        Core PCE Deflator (YoY)                    +4.1%                        +3.6%

© 2021 Ameriprise Financial, Inc. All rights reserved.
Before the Bell - Nov. 24, 2021 | Page 5
10:00 AM OCT New Home Sales (annualized) 800k 800k
10:00 AM OCT New Home Sales (MoM) +0.0% +14.0%
10:00 AM Nov. F U. of M. Consumer Sentiment 67.0 66.8
Commentary:
Generally good economic data this morning. Of particular note, last week’s new claims for unemployment
insurance were their lowest since 1969, according to Bloomberg.
Additionally, the rather sharp narrowing of the
October trade deficit for Goods is a good sign for
Q4 real GDP estimates.
Total New Orders for Durable Goods meanwhile
were light on the top-line due to weaker orders for
civilian aircraft. The weakness is primarily
reflective of the ongoing issues at Boeing. Orders
for new vehicles and parts, meanwhile jumped
4.8% in October following two straight months of
rather material declines. The increased orders
may be an indication that auto makers are
signaling a potential near-term improvement in
production volumes (thus taking the orders). The
chart at right is sourced from FactSet and HAS
been updated to reflect today’s release.
New orders for Non-defense Capital Goods
Excluding Aircraft, the commonly used proxy for
business investment spending were up 0.6% in the month (see comments below) and growing at a 3-month
annualized pace of +8.7% through the month.
Shortages of product and labor have businesses scrambling to invest. One of the key measures offered by the
monthly Durables report is that of new orders for business equipment and machinery; specifically, “new orders for
non-defense capital goods excluding aircraft.” See chart above.
As seen in the chart, orders for such equipment have increased significantly during the COVID period as businesses
scramble to address supply shortages with added capacity. Labor shortages have also been a factor as businesses
look to improve the productivity of the workers they have.
So, are we finally at the point where machines are replacing humans more noticeably in many industries? Yes and
no, in our view. As we are all well aware, such transitions have been occurring for decades. Yet despite ever
increasing mechanization and automation, labor was already tight before the pandemic and is now even tighter as
many businesses cannot find the workers they need.
We believe there’s little doubt that mechanization and artificial intelligence will steadily increase over time.
However, such moves are necessary to expand worker productivity as to maintain economic growth above a simply
growing at the same pace as the labor force – which has slowed considerably from decades past and will continue
to slow based on demographic projections. Simply put, low unemployment CAN coexist with rising technology
utilization to boost worker productivity and economic growth, in our view.
This space intentionally left blank.
© 2021 Ameriprise Financial, Inc. All rights reserved.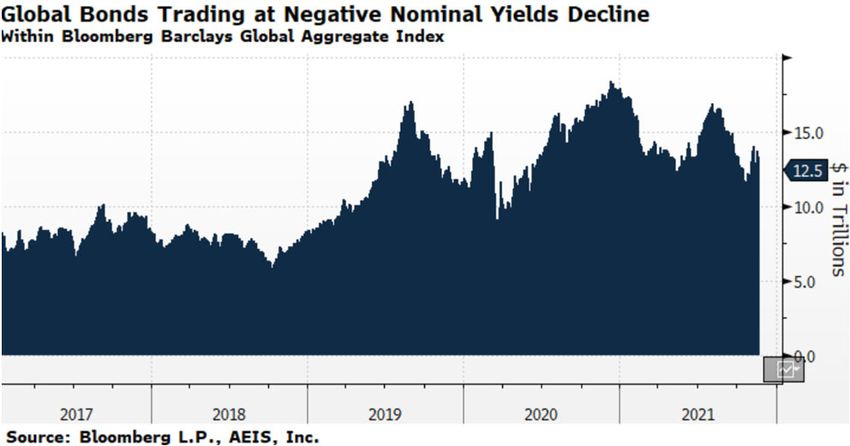
Before the Bell - Nov. 24, 2021 | Page 6
Ameriprise Economic Projections
Forecast: Full-year Quarterly
Actual Actual Est. Est. Actual Actual Actual Actual Est. Est. Est.
2019 2020 2021 2022 Q4-2020 Q1-2021 Q2-2021 Q3-2021 Q4-2021 Q1-2022 Q2-2022
Real GDP (YOY) 2.3% -3.4% 5.4% 4.5% 4.5% 6.3% 6.7% 2.0% 6.0% 4.5% 5.0%
Unemployment Rate 3.5% 6.7% 4.5% 3.5% 6.7% 6.0% 5.9% 4.8% 4.3% 4.0% 3.7%
CPI (YoY) 1.8% 1.3% 6.0% 2.5% 1.3% 2.6% 5.4% 5.4% 6.9% 6.2% 4.2%
Core PCE (YoY) 1.7% 1.4% 4.1% 2.6% 1.5% 2.0% 3.6% 3.6% 4.4% 4.5% 3.1%
So urces: Histo rical data via FactSet. Estimates (Est.) via A merican Enterprise Investment Services Inc.
Yo Y = Year-o ver-year, Unemplo yment numbers are perio d ending. GDP : Gro ss Do mestic P ro duct; CP I: Co nsumer P rice Index
P CE: P erso nal Co nsumptio n Expenditures P rice Index. Co re excludes fo o d and energy.
A ll Q ua rt e rly e s t im a t e s o t he r t ha n G D P a re pe rio d e nding . Last Updated: Novem ber 22, 2021
Chronological Forecast Adjustments: Russell T. Price, CFA – Chief Economist
GDP: (10/29/2021): Actual real GDP for Q3 came-in at +2.0% - moderately below our estimate of +2.4%. Reduced
business spending on automobiles (largely due to lack of availability) was the most prominent factor in the shortfall
versus our expectations, while higher than estimated import activity (which is a negative contributor to GDP) also weighed
on the results more than we anticipated.
To the positive, consumer spending was notably stronger than we expected. We were forecasting a +0.5% qtr/qtr. pace
of expansion whereas the Commerce Department report showed a strong +1.6% gain. The Commerce Department
attributed the strength to a strong return of international travel spending late in the quarter.
Overall, the slowdown in Q3 was primarily due to the Delta-variant’s negative impact on domestic consumer and business
spending. Some items, particularly automobiles, remained unavailable in the quantities desired by consumers and
businesses due to infection outbreaks elsewhere in the world.
Inflation: (10/7/2021): We hiked our inflation forecast modestly. Our headline CPI gets a boost due to rising energy
prices while our Core PCE estimate gets a boost from hotter than forecast gain in core prices during August. More
goods and services are experiencing shortages but the recent moderation in the pace of growth should help ease such
upward price pressures over the intermediate-term.
Ameriprise Global Asset Allocation Committee Targets and Views
Targets
Outlook Commentary: Anthony M. Saglimbene, Global Market Strategist
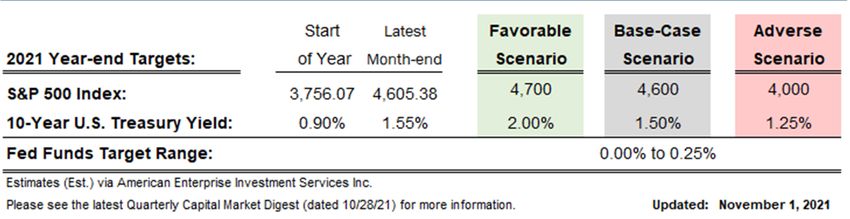
November 10: The S&P 500 could finish the year above our base and favorable targets. In our view, that's a win for investors.
We doubt investors would find much value in an S&P 500 target adjustment that attempts to predict the last several weeks
of the year after the Index has already posted such substantial gains in 2021. Thus, we are comfortable leaving our S&P 500
targets unchanged through the rest of the year and recognize the market's bias could be higher than we forecast in July (the
last time we changed our S&P 500 targets). And while the final S&P 500 level this year may fall outside our base and favorable
targets, the current messaging and direction around our targets (and the scenario forecasts found in the latest Quarterly
Capital Market Digest) should remain applicable through year-end.
© 2021 Ameriprise Financial, Inc. All rights reserved.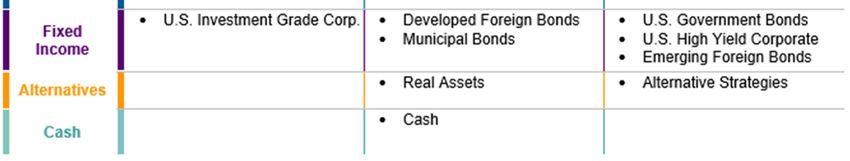
Before the Bell - Nov. 24, 2021 | Page 7

Recommended Weightings

Note: Our Tactical Allocations are designed to augment a Strategic portfolio over a 6-12-month time horizon. Asset Allocation and diversification
do not ensure or guarantee better performance and do not eliminate the risk of investment losses. Investors should note that rising interest
rates could have a detrimental effect on bond prices. Please consult with your financial advisor. Cash generally refers to assets, securities
and/or products low in risk and highly liquid. For asset allocation purposes, instruments can include Treasury bills, certificates of deposit, money
market funds and high-quality bonds whose maturities are less than 3 months. Outside of asset allocation purposes, cash investments can also
include illiquid cash held in a mutual fund or pledged as collateral for derivatives. You can only access this cash by redeeming the fund using it,
subject to fees or time constraints associated with redemptions.

                                                     This space intentionally left blank.

© 2021 Ameriprise Financial, Inc. All rights reserved.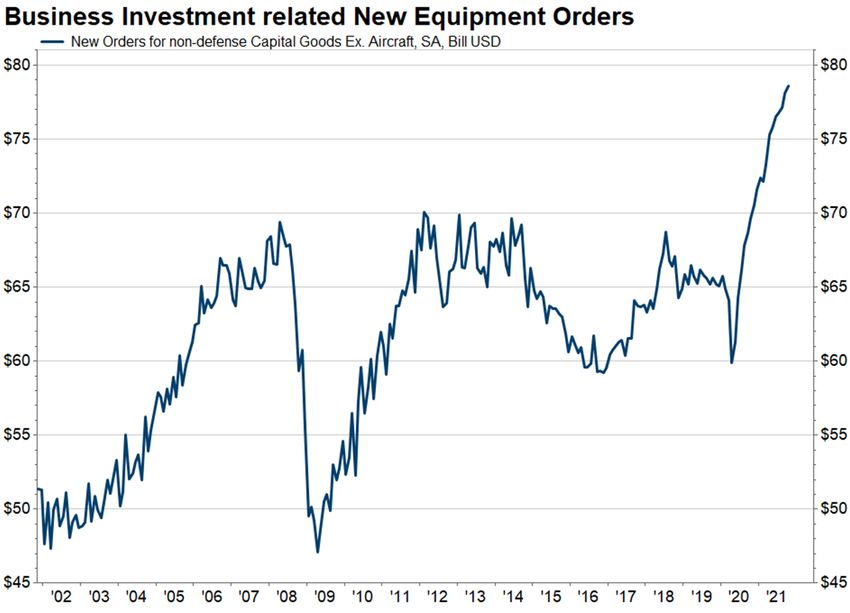
Before the Bell - Nov. 24, 2021 | Page 8

The Ameriprise Investment Research Group
With Ameriprise Financial, you can benefit from our dedicated team of experienced investment research and due diligence
professionals. Our objective market insight, strategies and guidance are designed to provide you with investment strategies
and solutions to help you feel more confident about your financial future. It’s the higher level of sophistication and service
you’ve come to expect from Ameriprise.

Research and                                    Manager                                           Fixed income
due diligence leader                            research                                          research and strategy
Lyle B. Schonberger                             Michael V. Jastrow, CFA                           Brian M. Erickson, CFA
Vice President                                  Vice President                                    Vice President

Business Unit Compliance Liaison                Mark Phelps, CFA                                  Jon Kyle Cartwright
Jeff Carlson, CLU, ChFC                         Director – Multi-asset solutions                  Sr Director – High yield and investment grade
Sr Manager                                                                                        credit
                                                ETFs, CEFs, UITs
Kimberly K. Shores                              Jeffrey R. Lindell, CFA                           Stephen Tufo
Investment Research Coordinator                 Director                                          Director – High yield and investment grade
                                                                                                  credit
                                                                                   ®
Jillian Willis                                  James P. Johnson, CFA, CFP
Sr Administrative Assistant                     Sr Analyst

                                                Alternatives                                      Retirement
Strategists                                     Justin E. Bell, CFA
                                                Vice President – Quantitative research and
                                                                                                  research
                                                alternatives
Chief Market Strategist                                                                           Open
                                                Kay S. Nachampassak                               Vice President
David M. Joy                                    Director
Vice President                                                                                    Open
                                                Quantitative research                             Director
Global Market Strategist
                                                Kurt J. Merkle, CFA, CFP®, CAIA
Anthony M. Saglimbene                           Sr Director
                                                                                                  Matt Morgan
Vice President                                                                                    Sr Manager
                                                Peter W. LaFontaine
Thomas Crandall, CFA, CMT, CAIA                 Sr Analyst
Sr Director – Asset allocation
                                                David Hauge, CFA
Cedric Buermann Jr., CFA                        Analyst
Analyst – Quantitative, Asset allocation
                                                Blake Hockert
Gaurav Sawhney                                  Sr Associate
Research Analyst
                                                Bishnu Dhar
Amit Tiwari, CFA                                Sr Research Analyst
Sr Research Associate
                                                Parveen Vedi
Chief Economist                                 Sr Research Associate
Russell T. Price, CFA
Vice President                                  Darakshan Ali
                                                Research Process Trainee

Equity                                          Equities
                                                Christine A. Pederson, CAIA, CIMA
research                                        Sr Director – Growth equity, infrastructure and
                                                REIT
Justin H. Burgin                                Benjamin L. Becker, CFA
Vice President                                  Director – International and global equity
Patrick S. Diedrickson, CFA                     Cynthia Tupy, CFA
Director – Consumer goods and services          Director – Value equity and equity income
William Foley, ASIP                             Open
Director – Energy and utilities                 Analyst – Core equity
Lori Wilking-Przekop
Sr Director – Financial services and REITs      Fixed income
                                                Steven T. Pope, CFA, CFP®
Daniel Garofalo                                 Sr Director – Non-core fixed income
Director – Health care
                                                Douglas D. Noah, CFA
Frederick M. Schultz                            Sr Analyst – Core taxable and tax-exempt fixed
Director – Industrials and materials            income
Open
Director – Quantitative strategies and
international
Andrew R. Heaney, CFA
Technology and Communication Services

© 2021 Ameriprise Financial, Inc. All rights reserved.
Before the Bell - Nov. 24, 2021 | Page 9

The content in this report is authored by American              written request to Ameriprise Financial, Inc., 1441 West
Enterprise Investment Services Inc. (“AEIS”) and                Long Lake Road, Troy MI, 48098. Independent third party
distributed by Ameriprise Financial Services, LLC (“AFS”)       research on individual companies is available to clients at
to financial advisors and clients of AFS. AEIS and AFS          ameriprise.com/research-market-insights/. SEC filings
are affiliates and subsidiaries of Ameriprise Financial, Inc.   may be viewed at sec.gov.
Both AEIS and AFS are member firms registered with
FINRA and are subject to the objectivity safeguards and         Investors should consider the investment objectives,
disclosure requirements relating to research analysts and       risks, charges and expenses of a mutual fund or
the publication and distribution of research reports. The       exchange traded fund (ETF) carefully before investing.
“Important Disclosures” below relate to the AEIS research       For a free prospectus, which contains this and other
analyst(s) that prepared this publication. The “Disclosures     important information about the funds, please contact
of Possible Conflicts of Interest” section, where               your financial advisor. The prospectus should be read
applicable, relates to the conflicts of interest of each of     carefully before investing.
AEIS and AFS, their affiliates and their research analysts,     Tactical asset class recommendations mentioned in this
as applicable, with respect to the subject companies            report reflect The Ameriprise Global Asset Allocation
mentioned in the report.                                        Committee’s general view of the financial markets, as of
Each of AEIS and AFS have implemented policies and              the date of the report, based on then current conditions.
procedures reasonably designed to ensure that its               Our tactical recommendations may differ materially from
employees involved in the preparation, content and              what is presented in a customized long-term financial
distribution of research reports, including dually              plan or portfolio strategy. You should view our
registered employees, do not influence the objectivity or       recommendations in conjunction with a broader long-
timing of the publication of research report content. All       term portfolio strategy. Not all products, services, or asset
research policies, coverage decisions, compensation,            classes mentioned in this report may be available for sale
hiring and other personnel decisions with respect to            at Ameriprise Financial Services, Inc. Please consult with
research analysts are made by AEIS, which is                    your financial advisor.
operationally independent of AFS.                               Diversification and Asset Allocation do not assure a
                                                                profit or protect against loss.
Important disclosures
As of September 30, 2021                                        Risk Factors
The views expressed regarding the company(ies) and              Dividend and interest payments are not guaranteed. The
sector(s) featured in this publication reflect the personal     amount of dividend payment, if any, can vary over time
views of the research analyst(s) authoring the publication.     and issuers may reduce or eliminate dividends paid on
Further, no part of research analyst compensation is            securities in the event of a recession or adverse event
directly or indirectly related to the specific                  affecting a specific industry or issuer. Should a company
recommendations or views contained in this publication.         be unable to pay interest on a timely basis a default may
                                                                occur and interruption or reduction of interest and
A part of a research analyst’s compensation may be              principal occur. Investments in a narrowly focused sector
based upon overall firm revenue and profitability, of which     may exhibit higher volatility than investments with broader
investment banking, sales and trading, and principal            objectives and is subject to market risk and economic
trading are components. No part of a research analyst’s         risk.
compensation is based on a specific investment banking
transaction, nor is it based on sales, trading, or principal    Income Risk: We note that dividends are declared solely
trading. A research analyst may have visited the material       at the discretion of the companies’ boards of directors.
operations of one or more of the subject companies              Dividend cuts or eliminations will likely negatively impact
mentioned in this research report. No payment was               underlying company valuations. Published dividend yields
received for the related travel costs.                          are calculated before fees and taxes. Dividends paid by
                                                                foreign companies to ADR holders may be subject to a
Additional information and current research disclosures         withholding tax which could adversely affect the realized
on individual companies mentioned in this research report       dividend yield. In certain circumstances, investors in ADR
are available on our website at                                 shares have the option to receive dividends in the form of
ameriprise.com/legal/disclosures in the Additional              cash payments, rights shares or ADR shares. Each form
Ameriprise research disclosures section, or through             of dividend payment will have different tax consequences
your Ameriprise financial advisor. You may also submit a

© 2021 Ameriprise Financial, Inc. All rights reserved.
Before the Bell - Nov. 24, 2021 | Page

and therefore generate a different yield. In some                company’s equity and that trade similarly to domestic
instances, ADR holders are eligible to reclaim a portion of      equities, and are either listed on an exchange or over-
the withholding tax.                                             the- counter. As with any equity investment, ADRs are
                                                                 subject to market and company specific risks. ADRs will
International investing involves increased risk and              also be subjected to foreign market risks. These risks
volatility due to political and economic instability, currency   include possible losses due to foreign currency
fluctuations, and differences in financial reporting and         translation, geopolitical instability, and deviations in the
accounting standards and oversight. Risks are                    market value of an ADR compared to that of the
particularly significant in emerging markets.                    underlying common shares in its primary market. ADRs
Market Risk: Model portfolios and markets in general             may suffer from a lack of investor protection and
could sustain significant volatility due to several factors.     recourse. In the event of a liquidation of the underlying
As we have seen recently, both economic and                      company, the holders of its ADRs are not guaranteed of
geopolitical issues could have a material impact on this         being able to enforce their right of claim and therefore
model portfolio and the equity market as a whole.                they may lose their entire investment. Investors of ADRs
                                                                 may also take on risks associated with the parties
Sector Risk: The Ameriprise Global Asset Allocation              involved with the sponsoring Bank.
Committee and managers of this model portfolio can elect
to overweight or underweight (or completely avoid)               Alternative investments cover a broad range of strategies
certain economic sectors. This could lead to substantial         and structures designed to be low or non-correlated to
underperformance versus a more diversified or balanced           traditional equity and fixed-income markets with a long-
weighting.                                                       term expectation of illiquidity. Alternative investments
                                                                 involve substantial risks and are more volatile than
Security Recommendation Risk: The research team                  traditional investments, making them more suitable for
may not be successful in selecting securities that               investors with an above-average tolerance for risk.
collectively perform better than the benchmark. When
viewing return comparisons investors should keep in              There are risks associated with fixed-income
mind the following information. Our model portfolio              investments, including bond funds, such as credit risk,
generally maintains less than 50 securities, whereas             interest rate risk, and prepayment and extension risk. In
benchmark indices contain several times that amount.             general, bond prices rise when interest rates fall and vice
The benchmark index is market capitalization weighted,           versa. This effect is usually more pronounced for longer-
providing greater weight to the larger company                   term securities.
movements, whereas our model portfolio is designed to            Growth securities, at times, may not perform as well as
be equally dollar weighted. Furthermore, the model               value securities or the stock market in general and may
portfolio may deviate significantly, at times, from the          be out of favor with investors.
sector allocation of the benchmark due to our
interpretation of economic conditions and market factors         International investing involves increased risk and
as well as our security selection process.                       volatility due to political and economic instability, currency
                                                                 fluctuations, and differences in financial reporting and
The benchmark index returns are taken from Bloomberg             accounting standards and oversight. Risks are enhanced
Financial Markets and reflect dividends reinvested.              for emerging market issuers.
Additionally, there is no fee or cost assumption in the
index comparison return.                                         Interest payments on inflation-protected securities may
                                                                 be more volatile than interest payments on ordinary
Product Risk Disclosures                                         bonds. In periods of deflation, these securities may
Corporate Bonds are debt instruments issued by a                 provide no income.
private corporation. Non-Investment grade securities,
commonly known as “high-yield” or “junk” bonds, are              Index definitions
historically subject to greater risk of default, including the   An index is a statistical composite that is not managed. It
loss of principal and interest, than higher-rated bonds,         is not possible to invest directly in an index.
which may result in greater price volatility than
experienced with a higher-rated issue.                           Definitions of individual indices mentioned in this report
                                                                 are available on our website at
American Depository Receipts (ADR) are securities                ameriprise.com/legal/disclosures/ in the Additional
issued by a U.S. bank that typically represent a foreign

© 2021 Ameriprise Financial, Inc. All rights reserved.
Before the Bell - Nov. 24, 2021 | Page Ameriprise research disclosures section, or through Ameriprise Financial Services, LLC. Member FINRA and your Ameriprise financial advisor. SIPC. Disclosures of potential conflicts of interest One or more members of the research team who prepared this research report may have a financial interest in securities mentioned in this research report through investments in a discretionary separately managed account program. Disclaimer section Except for the historical information contained herein, certain matters in this report are forward-looking statements or projections that are dependent upon certain risks and uncertainties, including but not limited to, such factors and considerations as general market volatility, global economic and geopolitical impacts, fiscal and monetary policy, liquidity, the level of interest rates, historical sector performance relationships as they relate to the business and economic cycle, consumer preferences, foreign currency exchange rates, litigation risk, competitive positioning, the ability to successfully integrate acquisitions, the ability to develop and commercialize new products and services, legislative risks, the pricing environment for products and services, and compliance with various local, state, and federal health care laws. See latest third-party research reports and updates for risks pertaining to a particular security. This summary is based upon financial information and statistical data obtained from sources deemed reliable, but in no way is warranted by Ameriprise Financial, Inc. as to accuracy or completeness. This is not a solicitation by Ameriprise Financial Services, LLC of any order to buy or sell securities. This summary is based exclusively on an analysis of general current market conditions, rather than the appropriateness of a specific proposed securities transaction. We will not advise you as to any change in figures or our views. Past performance is not a guarantee of future results. Investment products are not federally or FDIC- insured, are not deposits or obligations of, or guaranteed by any financial institution, and involve investment risks including possible loss of principal and fluctuation in value. Third-party companies mentioned are not affiliated with Ameriprise Financial Services, LLC. Ameriprise Financial, Inc. and its affiliates do not offer tax or legal advice. Consumers should consult with their tax advisor or attorney regarding their specific situation. © 2021 Ameriprise Financial, Inc. All rights reserved.
You can also read