Bass Strait Central Zone Scallop Fishery - 2022 Survey - AFMA Project 2019-0807 June 2022 Matt Koopman and Ian Knuckey
←
→
Page content transcription
If your browser does not render page correctly, please read the page content below
Bass Strait Central Zone
Scallop Fishery —
2022 Survey

AFMA Project 2019-0807

June 2022

Matt Koopman and Ian Knuckey
BSCZSF – 2022 Scallop Survey

Contents
 About this document .................................................................................................................................................... 3
 Executive Summary....................................................................................................................................................... 4
 List of Tables .................................................................................................................................................................. 5
 List of Figures ................................................................................................................................................................. 5
 Acknowledgements....................................................................................................................................................... 6
 1 Introduction.......................................................................................................................................................... 7
 1.1 Objectives ..................................................................................................................................................... 8
 2 Methods................................................................................................................................................................ 8
 2.1 Survey History .............................................................................................................................................. 8
 2.2 Survey Design............................................................................................................................................. 13
 3 Results ................................................................................................................................................................. 16
 3.1 Survey order ............................................................................................................................................... 16
 3.2 Biomass, size and potential commercial catch rates .............................................................................. 16
 3.3 Biologicals .................................................................................................................................................. 17
 3.4 Bycatch ....................................................................................................................................................... 17
 4 Discussion ........................................................................................................................................................... 27
 References ................................................................................................................................................................... 29
 Appendix 1 – Methods................................................................................................................................................ 30
 Appendix 2 - Time series data .................................................................................................................................... 31

Securing Australia’s fishing future AFMA.GOV.AU 2 of 34
BSCZSF – 2022 Scallop Survey

About this document
© 2022 Fishwell Consulting.

All rights reserved.

ISBN

Title: Bass Strait and Central Zone Scallop Fishery - 2022 Survey

AFMA Project 2019-0807

2022

Ownership of Intellectual Property Rights

Unless otherwise noted, copyright (and any other intellectual property rights, if any) in this publication is owned by the Fishwell
Consulting and the Australian Fisheries Management Authority.

This publication (and any information sourced from it) should be attributed to:

Koopman, M., and Knuckey, I. (2022). Bass Strait and Central Zone Scallop Fishery - 2022 Survey. AFMA Project 2019-0807. Fishwell
Consulting. 39 pp.

Creative Commons Licence

All material in this publication is licensed under a Creative Commons Attribution 3.0 Australia Licence, save for content supplied by
third parties, logos and the Commonwealth Coat of Arms.

 Creative Commons Attribution 3.0 Australia Licence is a standard form licence agreement that
 allows you to copy, distribute, transmit and adapt this publication provided you attribute the
 work. A summary of the licence terms is available from
 creativecommons.org/licenses/by/3.0/au/deed.en. The full licence terms are available from
creativecommons.org/licenses/by/3.0/au/legalcode.

Inquiries regarding the licence and any use of this document should be sent to: ian@fishwell.com.au

Cover photo: Jess Kube

Disclaimer

The authors do not warrant that the information in this document is free from errors or omissions. The authors do not accept any
form of liability, be it contractual, tortious, or otherwise, for the contents of this document or for any consequences arising from its
use or any reliance placed upon it. The information, opinions and advice contained in this document may not relate, or be relevant,
to a reader’s particular circumstances. Opinions expressed by the authors are the individual opinions expressed by those persons
and are not necessarily those of the publisher, research provider or the AFMA.

 Researcher Contact Details

 Name: Ian Knuckey
 Address: Fishwell Consulting
 27A Hesse St Queenscliff, VIC 3225
 Phone: +61 3 5258 4399
 Web: www.fishwell.com.au

Securing Australia’s fishing future AFMA.GOV.AU 3 of 34
BSCZSF – 2022 Scallop Survey

Executive Summary
At the start of each Bass Strait and Central Zone Scallop Fishery (BSCZSF) fishing season, the Australian
Fisheries Management Authority (AFMA) provides a 150 t research catch allowance to enable fishers to
search for commercially viable scallop (Pecten fumatus) beds. Industry members must then undertake
research surveys to determine if the fishery can remain open under a Tier 1 (catches ≤ 2,000 t) or Tier 2
(catches > 2,000 t) management arrangement. Research surveys must carry an independent observer or
electronic monitoring that is able to verify catch quantity, shell size and any other scientific data required to
determine biomass estimates. This report provides the results of the 2022 research surveys.

Four commercial fishing vessels were selected by an independent panel to conduct the 2022 scallop
surveys: the Shandara, Northern Star, Odete C and the Rachel Maree. During May 2022, stratified random
surveys were conducted using these vessels on three beds in the Flinders Island (FI) region, five beds in the
King Island (KI) region and two beds in the Apollo Bay (AB) region. Choice and prioritisation of these beds
was based on previous surveys and commercial catches from 2021, and input from the Scallop Resource
Assessment Group (ScallopRAG) and the Industry Co-Management Committee. Beds surveyed during 2022
were a combination of new beds and beds that had been previously surveyed. Both of the new beds for
2022 were in the FI region. Biomass estimates were calculated for each bed using area swept calculated
from the straight-line distance between the start and end tow points and the measured internal width of
the dredges.

Biomass of Commercial Scallops greater than 85 mm was estimated to be 13,064 t at the two AB beds,
5,005 t at the three FI beds and 13,824 t at the FI beds (Table 9). Total biomass greater than 85 mm at all
sites combined was 31,893 t. The percent of Commercial Scallops greater than 85 mm was more than 80%
at most sites, while only 46.9%, 38.2% and 49.4% of Commercial Scallops were greater than 85 mm at KI –
7, KI – 9 and KI – Blue Dot South East (BDSE) respectively. The lower percentage of larger scallops at these
sites is attributed to significant recent recruitment. Densities in individuals per m2 ranged 0.05 at KI – (Blue
Dot Extended) BDE to 2.39 at AB – The Hill (Table 9).

Catch composition varied greatly between beds. Overall, live Commercial Scallops comprised 30% of the
catch, while Broken Shell (20%), Old Single Shell (14%). The other 36% of the catch comprised a total of 60
different bycatch species / groups with significant amounts of sponges and ascidians. Several high risk
species were recorded. One Southern Blue-Ringed Octopus was recorded from a tow at each at FI – North
of Babel (NB) and FI – The Wreck B. Some Black and White Seastars were also recorded. Observers
identified King Island Thickshell-Clams at a number of sites but the large number of mollusc species present
in catches, lack of obvious identifying features and lack of time inhibits the observers’ ability to accurately
identify every mollusc species.

These results were presented at the ScallopRAG meeting on 7 June 2022 and at the Scallop Management
Advisory Committee (ScallopMAC) meeting on 9 June 2022.

Securing Australia’s fishing future AFMA.GOV.AU 4 of 34
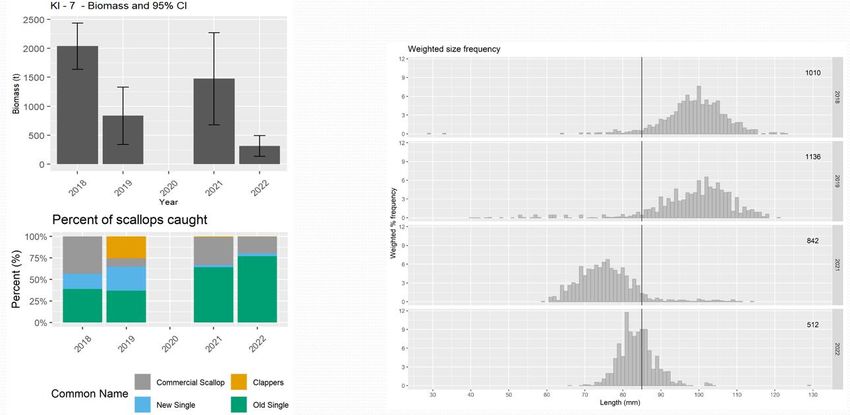
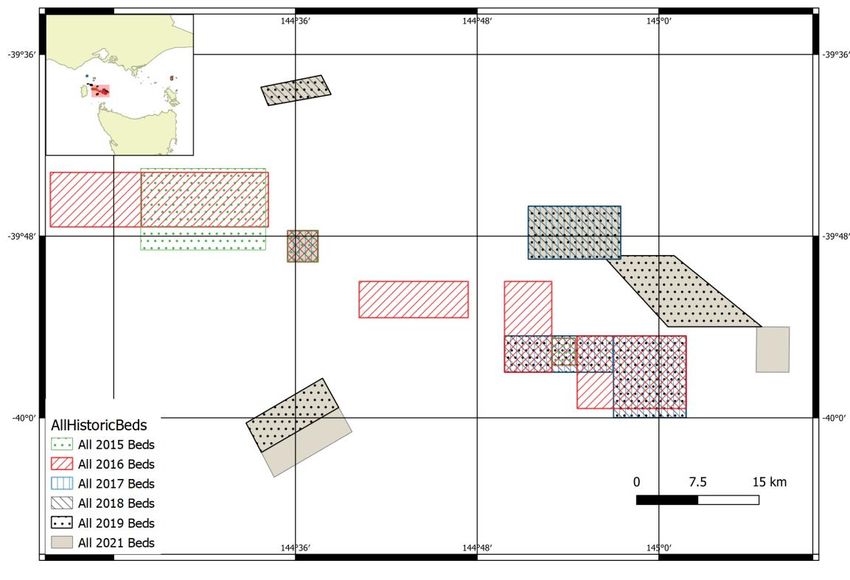
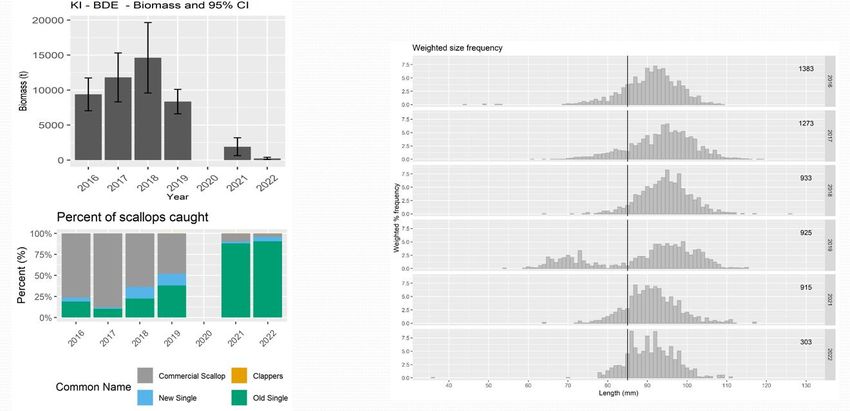
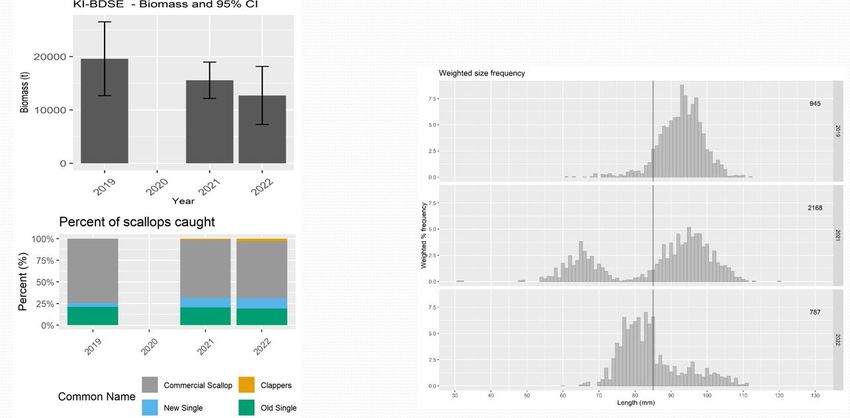
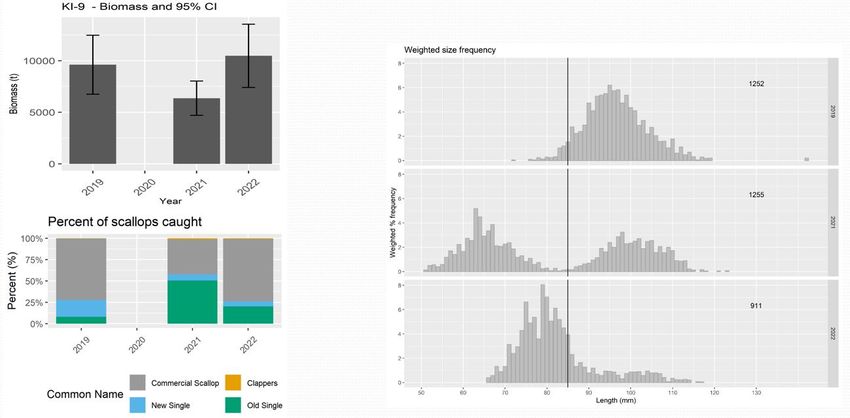
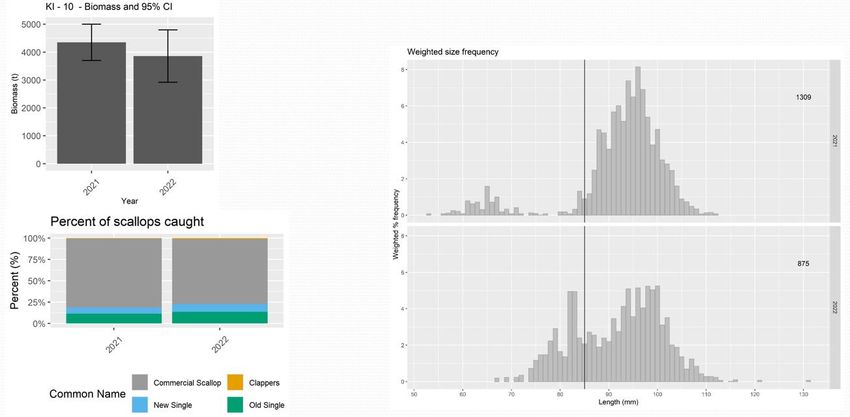
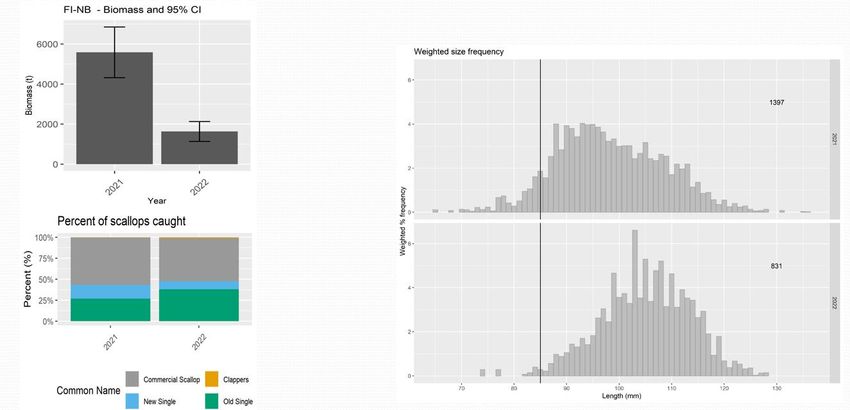
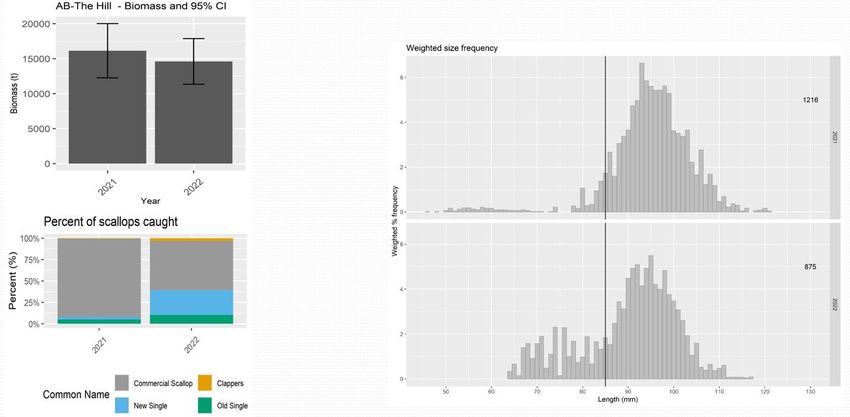
BSCZSF – 2022 Scallop Survey

List of Tables
Table 1. Description of beds surveyed since 2015 and beds new to 2022. See Figure 3 for maps of beds. ............ 11

Table 2 Names, nicknames (used in this report) surveyed in 2021 and area of polygons (km2). ............................ 18

Table 3. Total commercial catch (t) and the number of vessels that fished within each 2022 survey bed during
 the 2021 fishing season based on logbook data. Records coloured red are confidential – they were
 used in the analyses but removed for final report. .................................................................................... 18

Table 4. Biomass estimates, 95% confidence intervals and number of tows included in analyses. Note that both
 densities have been adjusted for a 33% assumed dredge efficiency........................................................ 19

Table 5. Percent weight of scallops > 85 mm (catch weighted by weight), and biomass estimates 95% confidence
 intervals for scallops greater than 85 mm. ................................................................................................. 20

Table 6. Number of length measurements (N), median, mean and standard error (SE) of scallops measured, and
 % of scallops measured (catch weighted by weight) less than and greater than 85 mm and mean
 number of meats per kg of scallops greater than 85 mm from each bed. ............................................... 20

Table 7. Number of scallops retained for biological sampling, and parameter estimates for length weight
 relationships. The Blue Dot Beds sub area included KI-BDE, KI-BDSE and KI-10. .................................... 21

Table 8. Catch of each species in each bed. (u) refers to undifferentiated species recorded at a higher taxonomic
 level. ............................................................................................................................................................... 21

Table 9. Summary of data used to inform the 2022 ScallopRAG and ScallopMAC recommendation for harvest
 strategy requirements and TAC. .................................................................................................................. 28

Table 10. Gonad maturation scheme for macroscopic field staging of scallops (modified from Semmens et al.,
 2019). ............................................................................................................................................................. 30

List of Figures
Figure 1. History of beds surveyed off Flinders Island from 2015 to 2021. .................................................................. 9

Figure 2. History of beds surveyed off King Island from 2015 to 2 021. ..................................................................... 10

Figure 3 History of beds surveyed off Apollo Bay and King Island from 2015 to 2 021. ............................................ 10

Figure 4. Scallop density (kg / 1000 m2) within the FI – The Wreck A, FI – The Wreck B and FI – North of Babel
 beds near Flinders Island. The scale bubbles on the right reflect the estimated scallop density of each
 tow assuming a dredge efficiency of 33%. Red circles denote zero catches. ........................................... 22

Figure 5. Scallop density (kg / 1000 m2) within the KI - BDE, KI – BDSE, KI - 10, KI – 7 and KI - 9 beds. The scale
 bubbles on the right reflect the estimated scallop density of each tow assuming a dredge efficiency of
 33%. Red circles denote zero catches.......................................................................................................... 23

Figure 6. Scallop density (kg / 1000 m2) within the AB – The Hill and AB – Five Hours beds. The top right scale
 bubbles reflect the estimated scallop density of each tow assuming a dredge efficiency of 33%. Red
 circles denote zero catches. ......................................................................................................................... 23

Securing Australia’s fishing future AFMA.GOV.AU 5 of 34
BSCZSF – 2022 Scallop Survey

Figure 7. Log transformed A) length and weight, B) length and height, C) length and width and D) height and
 width from each area bed. ........................................................................................................................... 24

Figure 8. Catch weighted size frequency from tows included in biomass estimates from each bed. The vertical
 line is at 85 mm. ............................................................................................................................................ 25

Figure 9. Frequency of combined meat and gonad weights of scallops >85 mm measured from each bed binned
 into 2 g weight categories. ........................................................................................................................... 25

Figure 10. Percent of scallops at each stage from each bed based on macroscopic staging criteria shown in Table
 10. ................................................................................................................................................................... 26

Figure 11. Percent catch composition by weight from all beds. ................................................................................. 26

Figure 12. Percent composition of clappers, live scallop, new single and old single shell from each Bed............... 27

Figure 13. Time series of biomass estimate, size frequency and percent of scallop (live/shell type) at the FI –
 North of Babel bed. ....................................................................................................................................... 31

Figure 14. Time series of biomass estimate, size frequency and percent of scallop (live/shell type) at the KI – BDE
 bed.................................................................................................................................................................. 31

Figure 15. Time series of biomass estimate, size frequency and percent of scallop (live/shell type) at the KI –
 BDSE bed. ....................................................................................................................................................... 32

Figure 16. Time series of biomass estimate, size frequency and percent of scallop (live/shell type) at the KI – 10
 bed.................................................................................................................................................................. 32

Figure 17. Time series of biomass estimate, size frequency and percent of scallop (live/shell type) at the KI – 7
 bed.................................................................................................................................................................. 33

Figure 18. Time series of biomass estimate, size frequency and percent of scallop (live/shell type) at the KI – 9
 bed.................................................................................................................................................................. 33

Figure 19. Time series of biomass estimate, size frequency and percent of scallop (live/shell type) at the AB – The
 Hill................................................................................................................................................................... 34

Figure 20. Time series of biomass estimate, size frequency and percent of scallop (live/shell type) at the AB – Five
 Hours. ............................................................................................................................................................. 34

Acknowledgements
We would like to thank Glen Wisby and the crew of the Odete C, John and Johno Hammond and crew of
the Shandara, John, Graham and Dusty Cull and crew of the Rachel Maree and Andy and Jake Watts and the
crew of the Northern Star for all of their assistance and hard work in undertaking the 2022 survey. Dusty
Cull and Jake Watts provided valuable information used to define the new Flinders Island beds. The
observers Matt Dorter and Tom Wright worked very hard to collect all data required to a high-quality
standard. Heather Johnston (AFMA), provided the logbook data used to guide the survey design. Heather,
together with ScallopRAG, ScallopMAC and the BSCZSF Co-Management Committee provided valuable
input into the survey logistics and design.

Securing Australia’s fishing future AFMA.GOV.AU 6 of 34
BSCZSF – 2022 Scallop Survey

1 Introduction
The main target species in the Bass Strait Central Zone Scallop Fishery (BSCZSF) is the Commercial Scallop,
Pecten fumatus. Commercial Scallops in wild populations live for between five and nine years, but have
been observed to die-off rapidly after only three to five years in some situations (Haddon et al., 2006). The
species is generally subject to high spatial and temporal variability in recruitment and abundance, variable
growth and mortality, and rapidly changing meat yield and reproductive condition. This variability means
that management of Commercial Scallops must be adaptable to sometimes rapidly changing circumstances,
yet still ensure protection of the resource in line with the Commonwealth Fisheries Harvest Strategy Policy
2018 (HSP).

Under the original HSP, the initial harvest strategy for the BSCZSF was developed during 2007. It was
revised during the 2012 season and in response to industry concerns about the cost-effectiveness and
flexibility, was further reviewed during 2014. The BSCZSF Harvest Strategy (the Harvest Strategy) has two
primary objectives. To:

 1. keep stocks within the BSCZSF at ecologically sustainable levels and, within that context, maximise
 the economic returns to the Australian community; and,

 2. pursue efficient and cost-effective management in attaining (1) above.

The Harvest Strategy uses a tiered approach designed to apply different levels of management and
research services depending on the state of the resource. Underpinning the tiered approach is the need to
balance the risk of over exploitation with obtaining initial knowledge on the status of the stock at the
commencement of the season through pre-season surveys.

At the start of each fishing season, the Australian Fisheries Management Authority (AFMA) provides a 150 t
research catch allowance to enable fishers to search for commercially viable scallop beds, defined as “…an
area or scallop bed containing no greater than 20 per cent of scallops of a size less than 85 mm”. To
increase the catch allowance above 150 t, industry members must undertake research surveys to
determine if the fishery can remain open under Tier 1 or Tier 2 level management arrangements.

 • Tier 1 management arrangements require initial closure of an area/s (not more than 2 scallop
 beds) that contain ≥1,500 tonnes in total of high density scallops of a minimum size of 85 mm. The
 season begins with a 1,000 t total allowable catch (TAC) that can be increased to 2,000 t if good
 catches are achieved.

 • Tier 2 management arrangements require initial closure of an area/s (not more than 2 scallop
 beds) that contain ≥3,000 tonnes in total of scallops of a minimum size limit of 85 mm of high
 density. The season begins with a 2,000 t TAC that can be increased if good catches are achieved.

Research surveys must carry an independent observer or electronic monitoring that is able to verify catch
quantity, shell size and any other scientific data required to determine biomass estimates. This report
provides the results of the 2022 stratified random surveys.

Securing Australia’s fishing future AFMA.GOV.AU 7 of 34
BSCZSF – 2022 Scallop Survey

1.1 Objectives
1. Estimate the scallop biomass and potential commercial catch rates in three different areas of the
 BSCZSF.

2. Measure the size frequency distribution of scallops in each area to calculate discard rates.

3. Report results to AFMA, the Scallop Resource Assessment Group (ScallopRAG) and the Scallop
 Management Advisory Committee (ScallopMAC).

2 Methods
2.1 Survey History
The 2015 survey covered three beds in the King Island (KI) region and one bed in the Flinders Island region
(Figure 3). To provide greater flexibility in management arrangements regarding closures, this was
expanded in 2016 with the addition of an extra four sites in the KI region and another site in the FI region
(Figure 3, Table 1). In addition to the extra sites, the boundaries of some of the 2015 sites were modified
(for example northern and southern boundaries of the bed known as KIMain in Knuckey et al. (2015) were
brought in slightly, and the eastern and western boundaries moved east slightly to form a bed titled KI-2 in
Knuckey et al. (2016). The beds surveyed during 2017 were based on advice from the Scallop Research
Workshop and input from ScallopRAG and the BSCZSF Co-Management Committee. They comprised
previously surveyed beds, modified beds and new exploratory beds. In 2018 two beds were added off King
Island, while Apollo Bay (AB)-3, AB-4, FI-3 and FI-4 were not surveyed. In 2019 as well as the FI bed, AB 1
and 2 were surveyed, and two new beds (one stretching south-east of KI Bluedot Extended (BDE) and
another called the KI-JH bed comprising high density of juvenile scallops) were added. To protect the
juveniles at KI-JH, sampling intensity was reduced, and a fine mesh cover was placed over half of the dredge
to better sample small scallops. No survey was undertaken in 2020 because of concerns regarding the
Covid-19 outbreak. Twelve beds were surveyed in 2021 when the FI -The Sisters and FI- North of Babel (NB)
beds were added in the FI region, the KI-JH site was extended to the southeast, AB-2 was extended to the
north and AB-The Hill and AB-Five Hours sites were added in the AB region. The beds surveyed in 2022
were based on previous surveys, analysis of 2021 catch and effort data and advice from the ScallopRAG and
the BSCZSF Co-Management Committee.

Changes to the beds surveyed since 2015 are outlined in Table 1.

Securing Australia’s fishing future AFMA.GOV.AU 8 of 34
BSCZSF – 2022 Scallop Survey

 2017: FI – 4

 2015: FI 2017: FI – 3
 2016: FI2
 2017: FI2
 2018: FI 2015: FI 2021: FI North– The Sisters
 2019: FI 2016: FI1
 2021: FI 2017: FI1
 2018: FI
 2019: FI
 2021: FI

 2021: FI South – North of Babel
 2022: FI South – North of Babel

Figure 1. History of beds surveyed off Flinders Island from 2015 to 2021.

Securing Australia’s fishing future AFMA.GOV.AU 9 of 34
BSCZSF – 2022 Scallop Survey

 2018: KI7
 2019: KI7
 2021: KI7
 2016: KI - Bluedot
 2017: KI - Bluedot Extended
 2018: KI - Bluedot Extended
 2015: KI - Middle 2019: KI - Bluedot Extended
 2016: KI - Middle 2021: KI - Bluedot Extended
 2017: KI - Middle
 2018: KI - Middle 2019: KI - Bluedot South East
 2021: KI - Bluedot South East
 2016: KI - 1
 2015: KI - Main 2016: KI - 3
 2016: KI - 2

 2016: KI - 4New
 2017: KI - New
 2018: KI - New 2019: KI - 10
 2019: KI - New 2021: KI - 10
 2016: KI – 5 / New
 2017: KI - New – 5 Small
 2018: KI - New – 5 Small
 2019: KI – JH 2019: KI - New – 5 Small
 2021: KI - JH

Figure 2. History of beds surveyed off King Island from 2015 to 2021.

 2017: AB2
 2018: AB2
 2019: AB2 2017: AB3
 2021: AB2

 2017: AB4 2017: AB1
 2018: AB1
 2019: AB1

 2021 AB – The Hill North

 2021 AB – Five Hours

 2019: KI – 8B
 2018: KI - 6
 2019: KI – 8A 2019: KI - 6

 2019: KI - 9
 2021: KI - 9

Figure 3 History of beds surveyed off Apollo Bay and King Island from 2015 to 2021.

Securing Australia’s fishing future AFMA.GOV.AU 10 of 34
BSCZSF – 2022 Scallop Survey

Table 1. Description of beds surveyed since 2015 and beds new to 2022. See Figure 3 for maps of beds.

 Bed Name Description
 Type

 KI-5S Originally a larger area that was surveyed in 2016, KI-5S was formed by extending the
 eastern boundary of KI-New south to -40˚S, and including the area of KI-5 to the east of that.
 This bed remained unchanged from the 2017 to 2019 when it was last surveyed.

 KI-New KI-New was a bed that was defined for management proposes (it formed the initial closure)
 after the 2016 survey, covering at least parts of three different beds surveyed in 2016. It
 comprised parts of a bed called KIEast which was surveyed during 2015, and again in 2016,
 along with two new adjacent beds, KI-4 and KI-5. KI-New remained unchanged from the 2017
 to 2019 when it was last surveyed.

 KI-BDE During the TAC setting by the MAC for the 2016 season, industry provided information
 regarding a dense bed of small scallops that would be more suitable for closure than the KI-
 New bed. This bed titled King Island Blue Dot was mapped out and then surveyed during
 August of 2016. The area was expanded north and west to form an area closure that
 replaced the closure of KI-New. The boundaries of this expanded area are shown in Figure 3.
 This bed remained unchanged from the 2017 to 2022 surveys.
 Previously surveyed

 AB-1 and Seven exploratory marks in the KI region were provided by industry in 2017 to be explored
 AB-2 and considered for additional survey beds. Only one of those showed enough promise to
 survey, and the skippers mapped out area, splitting it into two beds. Two additional smaller
 beds were added to each of the western and eastern boundaries, however these contained
 low densities of scallops and were dropped from the 2018 and future surveys. The AB-1 and
 AB-2 bed boundaries remained unchanged during the 2018 and 2019 surveys. For the 2021
 survey, only AB-2 was surveyed, and the northern boundary was moved north to cover
 relatively high levels of commercial effort in that area. Neither were surveyed in 2022

 KI-6 Examination of 2018 commercial catch and effort data revealed significant catches in a large
 area at approximately longitude 144˚ 17’, latitude 39˚ 32’. The vessels mapped out this area
 to provide a smaller area with high density scallops with the boundaries shown in Figure 3.
 The bed boundaries remained unchanged from the 2018 survey, was resurveyed in 2019, but
 dropped for the 2021 survey.

 KI-7 Examination of 2018 commercial catch and effort data revealed significant catches in a large
 area at approximately longitude 144˚ 36’, latitude 39˚ 38’. The vessels mapped out this area
 to provide a smaller area with high density scallops with the boundaries shown in Figure 3.
 The bed boundaries remained unchanged from the 2018 survey, was resurveyed in 2019 and
 was surveyed in 2021 as a replacement for KI-Mid (in accordance with ScallopRAG
 recommendations) after exploratory revealed low densities there. It was resurveyed in 2022

 FI FI-1 was called the “Flinders Island” bed during the 2015 survey. For the 2016 and 2017
 surveys, the area was expanded and spilt into the two beds (FI-1 and FI-2). Two additional
 smaller beds were added to the northern boundary of FI-2 in 2017, however because of low
 Previously surveyed

 densities, these were dropped for the 2018 survey. For the 2018 survey, FI-1 and FI-2 were
 combined into a single large bed (Figure 3). The bed boundaries remained unchanged from
 the 2018 survey and was resurveyed in 2019 and 2021, but not in 2022.

 KI-8a and Examination of 2019 commercial catch and effort data revealed significant catches in a large
 KI-8b area at approximately longitude 144˚ 10’, latitude 39˚ 31’. Within the general area of this
 effort, there were three main patches of densely populated scallop beds separated by areas
 of low density and an underwater cable. The two largest of these small areas were selected
 to survey in that year. They were not surveyed in 2021 or 2022.

Securing Australia’s fishing future AFMA.GOV.AU 11 of 34
BSCZSF – 2022 Scallop Survey

 Bed Name Description
 Type

 KI-9 Examination of 2019 commercial catch and effort data revealed significant catches in a large
 area at approximately longitude 144˚ 21’, latitude 39˚ 35’. The final boundaries were set
 based on a combination of fishing effort by the survey vessel in the previous year and
 exploratory fishing. This bed was resurveyed in 2021 and 2022.

 KI-JH An industry member provided two marks that bound a line of exploratory tows that
 contained relatively high densities of juvenile scallops (~50 mm). Being the most recent sign
 of significant recruitment there was interest in tracking the growth of this bed, however
 there was some sensitivity around the potential to disturb the bed by surveying it. As a
 compromise, a relatively small survey area was set with only 20 sampling sites. Based on
 advice from industry, the bed was extended to the south-east for the 2021 survey. This bed
 was not surveyed in 2022

 KI-BDSE Examination of 2019 commercial catch and effort data revealed significant catches in a large
 area at approximately longitude 145˚ 00, latitude 39˚ 49. The final boundaries were set
 based on a combination of fishing effort by the survey vessel in the previous year and
 exploratory fishing. This bed was resurveyed in 2021 and 2022.

 KI-Mid This bed remained unchanged from 2015, 2016, 2017 and 2018. In accordance with RAG
 Previously surveyed

 recommendations, five exploratory tows were conducted at this bed during 2021 revealing
 low densities (no scallops were caught), and so KI-7 was surveyed instead. This bed was not
 surveyed in 2022

 KI – 10 Significant catches were taken from an area to the south-east of the KI-BDSE site during
 2020. KI – 10 is that surrounds that catch and was surveyed in 2021 and 2022.

 AB – The Industry members provided marks about 17 nm to the south-east of Apollo 2 where
 Hill North significant amounts of scallops were caught in 2020. Based on commercial effort reported
 from the area, and notes made on a fishing vessel’s plotter, a bed was defined and surveyed
 in 2021 and 2022.

 AB – Five Industry members provided marks about 19 nm to the south-east of AB – Apollo 2 where
 hours significant amounts of scallops were caught in 2020. Based on commercial effort reported
 from the area, and notes made on a fishing vessel’s plotter, a bed was defined and surveyed
 in 2021 and 2022.

 FI – North Significant catches were taken from an area about 11 nm to the east of the FI site. Based on
 - The commercial effort reported from the area, and notes made on a fishing vessel’s plotter, a
 Sisters bed was defined. This bed was surveyed in 2021, but not in 2022.

 FI – South Significant catches were taken from an area about 31 nm to the south-south-east of the FI
 – North of site. Based on commercial effort reported from the area, and notes made on a fishing
 Babel vessel’s plotter, a bed was defined and surveyed in 2021 and 2022.

Securing Australia’s fishing future AFMA.GOV.AU 12 of 34
BSCZSF – 2022 Scallop Survey

 FI – The Significant catches were taken from an area to the north-west of the FI South – North of
 Wreck A Babel site during 2021. FI – The Wreck A is a new bed that together with FI – The Wreck B,
 Exploratory / New Beds

 surrounds that catch.
 FI – The Significant catches were taken from an area to the north-west of the FI South – North of
 Wreck B Babel site during 2021. FI – The Wreck B is a new bed that together with FI – The Wreck A,
 surrounds that catch.
 Industry members provided a mark about 8.5 nm to the east of the old Flinders Island bed.
 FI –
 (Explorat
 ory mark)

For the 2022 survey, ScallopRAG recommended including the following beds:

 1. Apollo Bay Five Hours

 2. Apollo Bay The Hill North

 3. King Island Blue Dot Extended

 4. King Island Blue Dot South East

 5. King Island 10

 6. King Island 9

 7. King Island 7

 8. Flinders Island South/ North of Babel

 9. Flinders Island The Wreck A

 10. Flinders Island The Wreck B

 11. Flinders Island (Exploratory mark)

Survey bed names were given nick names to simplify for tables and figures. These are shown in Table 2 and
are used throughout this report.

2.2 Survey Design
Survey methods follow those of Knuckey et al. (2015, 2016, 2017, 2018), Koopman et al. (2019, 2021),
modified from those described in Harrington et al. (2008). Four vessels were selected to undertake the
survey.

The number of survey points allocated to each bed was largely guided by sampling effort during past
surveys, with consideration given to the maximum number of tows that can be achieved in a 12-hour
sampling block1. Primary sampling sites within each bed were randomly allocated using the QGIS Random
Points in Polygons Tool. Additional survey points were allocated to each bed as “backup sites”, to be used
where “primary sites” were unfishable.

1 For OHS reasons, observers are restricted to a maximum of 12 hours of sampling in a 24-hour period.

Securing Australia’s fishing future AFMA.GOV.AU 13 of 34
BSCZSF – 2022 Scallop Survey

During 2022, surveys were conducted onboard the fishing vessels Rachel Maree (Scientific Permit#
1005312), Shandara (Scientific Permit# 1005313), Odete C (Scientific Permit# 1005309) and the Northern
Star (Scientific Permit# 1005308), which were selected by an independent panel. To be considered a valid
tow, the vessel must dredge within 100 m of the tow location provided. Lotek LAT1400-64kb temperature-
depth loggers were attached to the dredge at the start of the first tow for each trip. They were set to
record an observation at regular intervals so that multiple records would be obtained for each trip.

2.2.1 Sampling methods
For each tow, estimates were made of weight of: total live scallop catch, dead shell and all bycatch by
species / species group. Dead shell was separated into:

 • Clappers (both valves still connected at the hinge)

 • Old single (single valve – inside appears old and overgrown with epiphytes / epifauna)

 • New single (single valve – inside appears new without any epiphytes / epifauna)

A random sample of at least 35 scallops (where available) was collected from each tow before they went
through the tumbler. The observer measured the length of those scallops using an electronic measuring
board. Either the first or last (or both) scallop from each tow measured using the measuring board was also
measured by hand using digital callipers or a metal ruler. This was done to ensure accuracy and consistency
of the measuring board throughout the survey. The sample weight of scallops measured was also recorded.

From every fifth tow, an additional 10 random scallops were taken before passing through the tumbler to
collect biological information. First, the whole scallop was weighed, then split and the gonad condition
staged according to the scale in based on Semmens, et al. (2018) (Table 10). Adductor meat and gonad
were removed from the shell and weighed together to calculate number of meats per kg. Shell height and
width were also measured for morphometric analyses.

2.2.2 Data analysis
All data processing and analysis was undertaken in R (R Core Team, 2022). Estimates of biomass and
potential commercial catch rates followed the methods of Semmens and Jones (2014).

2.2.3 Biomass estimates
The internal widths of the dredges used during the survey were measured in accordance with Semmens
and Jones (2014). Dredge widths used by the Shandara, Odete C, Northern Star and Rachel Maree were
4.87 m 3.905 m, 3.583 m and 3.930 m (Table 2). A dredge efficiency of 33% was assumed.

Swept area (S) of each tow was calculated as follows:

S=LxW

Where L is the tow distance (m) and W is the width of the dredge (m). Tow distance was calculated from
the straight-line distance between start and end tow positions.

Scallop catch in each tow (Cstandardised in kg/1000 m2) was calculated as follows:

Cstandardised = (C/S)x1000

Where C is the estimated catch in a tow (kg).

Assuming a 33% dredge efficiency, biomass (B) in tonnes and 95% confidence interval (CI) were estimated
for each stratum (bed) as follows:

Securing Australia’s fishing future AFMA.GOV.AU 14 of 34
BSCZSF – 2022 Scallop Survey

B = meanD * A * 3.03 / 1000

Upper 95% CI= ((meanD + (tn-1 x SEmeanD)) x A)*3.03 / 1000

Lower 95% CI= ((meanD - (tn-1 x SEmeanD)) x A)*3.03 / 1000

Were meanD is the mean density (kg) of scallops per m2 swept, tn-1 is the t –value for the number of tows
(n) -1, SEmeanD is the standard error of meanD and A is the total stratum area (m2). The area of each bed was
calculated using the R package “Simple Features” (Pebesma, 2018).

Biomass and upper and lower 95% confidence intervals (CI) of scallops greater than 85 mm were calculated
as follows:

B>85 mm = B * (1-discard rate)

Upper 95% CI >85 mm = Upper 95% CI * (1-discard rate)

Lower 95% CI >85 mm = Lower 95% CI * (1-discard rate)

where the discard rate was calculated using catch weighted length frequencies converted to weight.

An estimate of density in individuals per square metre (I) was obtained as follows

 = ∑ /

Were WLf is the weighted length frequency for each length class len, and S is the swept area (m2).

All densities (kg / m2 and individuals per m2) reported have been adjusted for the 33% assumed dredge
efficiency (see Harrington et al. (2008) for origin of the 33%).

2.2.4 Biologicals
The length-weight relationship was calculated for each area separately, and the parameters of the
relationship are provided in the results. Length-weight relationship was applied to catch-weighted size
frequencies to calculate the discard rate at 85 mm. The discard rate was used in calculations of biomass of
scallops greater than 85 mm. Number of meats per kg was calculated separately for each bed by dividing
1000 by the mean meat and gonad weight in grams.

2.2.5 Quality Assurance
The survey was undertaken following Standard Operating Procedures. All tow and scallop catch data were
recorded in ORLAC Dynamic Data Logger (DDL), which contains quality assurance protocols including
automatic data capture (time, date and position), field restrictions, range checks, mandatory fields and
lookup tables. These data are maintained in the ORLAC Dynamic Data Manager (DDM) database on a cloud-
based server from which data are extracted for analyses. Data were manually error checked against data
sheets. Analyses were undertaken using R (R Core Team, 2022), and a subset of outputs were reproduced
and compared using an alternative software package. Scallops were measured using electronic measuring
boards, or callipers in the event of measuring board failure. The first or last (or both) scallop from each tow
was measured by both the measuring board and by hand using either digital callipers or a metal ruler. This
was done to ensure accuracy and consistency of the measuring board throughout the survey.

Results and their interpretations and conclusions were discussed amongst the research team, and draft
reports were reviewed by co-authors and AFMA managers. Where required, comments were addressed in
preparation of the final report.

Securing Australia’s fishing future AFMA.GOV.AU 15 of 34
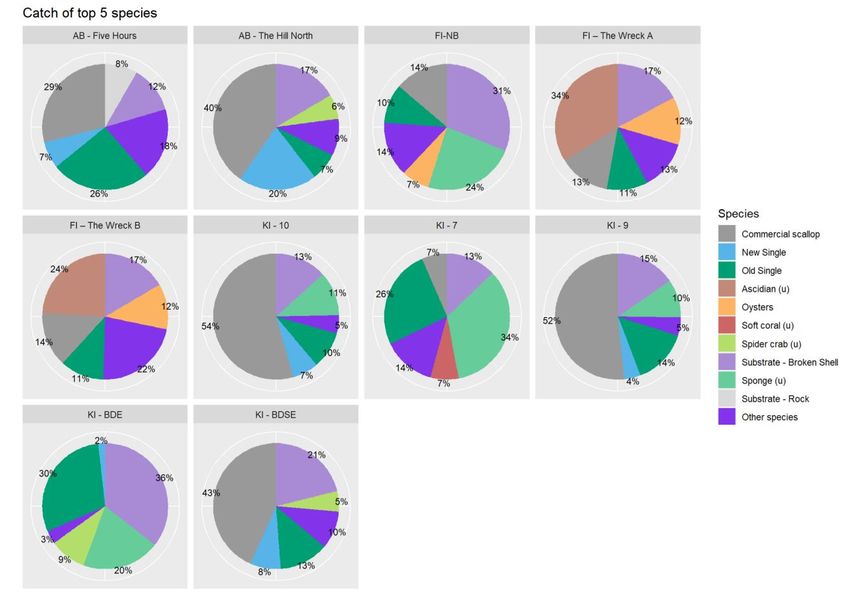
BSCZSF – 2022 Scallop Survey

3 Results
3.1 Survey order
The 2022 BSCZSF survey was undertaken over four legs during May. During the first leg, the Rachel Maree
surveyed the AB – The Hill, AB – Five Hours and KI – 9 (see Table 2 for bed nicknames) beds between 1st
May 2022 and the 3rd May 2022. The Odete C surveyed KI – 7, KI – BDE and KI – 10 between the 9th May
2022 and 11th May 2022. The Shandara surveyed KI – BDSE and FI – NB between the 20th May 2022 and
22nd May 2022. The Northern Star surveyed FI – The Wreck A and FI – The Wreck B between 23th May 2022
and 24th May 2022, and undertook one exploratory tow at the Flinders Island Exploratory mark, however
hydraulic issues caused the vessel top cease fishing and return to port. The total area of each bed is shown
in Table 2.

3.2 Biomass, size and potential commercial catch rates
Mean biomass estimates for AB – Five Hours and AB – The Hill were 1,037 t (95%CI 553 t – 1,521 t) and
14,601 t (95%CI 11,343 t – 17,859 t) respectively (Table 4). The percentage of scallops >85mm at each of
those beds were 97.8% and 82.5% (Table 5), and consequently the mean biomasses of scallops > 85 mm
were 1,014 t and 12,050 t respectively (Table 5).

Mean biomass estimates for FI – The Wreck A, FI – The Wreck B and FI – NB were 1,578 t (95%CI 1,138 t –
2,018 t), 1,856 t (95%CI 1,335 t – 2,337 t) and 1,632 t (95%CI 1,135 t – 2,130 t) respectively (Table 4). The
percentage of scallops 85 mm were only slightly lower than total biomass estimates: 1,544 t, 1,839 t and
1,622 t respectively (Table 5).

Mean biomass estimates for KI – 10, KI – 7, KI – 9, KI-BDSE and KI-BDE were 3,860 t (95%CI 2,920 t –
4,799 t), 313 t (95%CI 134 t – 492 t) , 10,482 t (95%CI 7,412 t – 13,552 t) , 12,707 t (95%CI 7,264 t –
18,150 t) and 234 t (95%CI 75 t – 393 t) respectively (Table 4). The percentage of scallops 85 mm of 3,178 t, 147 t, 4,007 t, 6,278 t and 214 t respectively (Table 5).

Densities in kg/1000m2 for the FI beds are shown in Figure 4. At all three beds, medium densities were
relatively consistent throughout, with some low density catches, particularly in the south of the FI – North
of Babel bed and the west of the FI – The Wreck A and FI – The Wreck B. KI – BDE and KI – 7 were the only
beds at which zero catches were recorded (Figure 5). Continuing on from the low density catches in the
south-east of KI – BDE, densities in the north of KI – BDSE were also low, but very high in the south.
Densities were consistently medium throughout KI – 10. At KI – 9 there were medium to high density tows
recorded in the south. Medium to high density tows were also recorded throughout AB – The Hill, while
medium density tows were recorded in the north of AB – Five Hours, but low densities in the south (Figure
6).

Estimated densities in numbers of Commercial Scallops >85 mm ranged 0.05 individuals per m2 at KI – BDE
to 2.39 individuals per m2 (Table 4). Densities were relatively low at all three FI beds.

Comparisons of biomass estimates, percent catch composition and size distributions of beds that have been
repeatedly surveyed and surveyed in 2021 are shown in Appendix 2. While the sampling methods have
been consistent, the areas of the beds have changed considerably. Care should be taken when interpreting
those results, and consideration of changes in bed areas over time should be made.

Securing Australia’s fishing future AFMA.GOV.AU 16 of 34
BSCZSF – 2022 Scallop Survey

3.3 Biologicals
Mean length of scallops measured from beds ranged 83 mm at KI – 7 to 105 mm at FI – NB (Table 6). Length
frequency distributions from all sites are shown in Figure 8. Significant recruitment was observed at KI-7, KI
– 10, KI-9 and KI-BDSE, while small signs of recruitment were observed at AB – The Hill, AB – Five Hours and
FI – The Wreck. Scallop meats of were much smaller at the KI and AB beds compared to FI (Table 6, Figure
9). Overall, most meats were less than 20 g, and meats per kg ranged 48 at FI – NB to 158 at The Hill (Table
6). The larger meat weights at the Flinders beds are reflected in the maturity stages (Table 10), with the
highest proportion of stage 2 gonads at FI – The Wreck A, FI – The Wreck B and FI – NB-TS. No stage 3
gonads were observed.

Comparison of length-weight regressions between beds revealed that the interaction term was significant
(p
BSCZSF – 2022 Scallop Survey

Table 2 Names, nicknames (used in this report) surveyed in 2021 and area of polygons (km2).

 Bed Nickname Total Area (km2)

 Flinders Island – The
 FI – The Wreck A 37.51
 Wreck A
 Flinders Island– The Wreck
 FI – The Wreck B 36.41
 B
 Flinders Island South -
 FI - NB 31.43
 North of Babel
 Apollo Bay - The Hill North AB - The Hill 60.47
 Apollo Bay - Five Hours AB - Five Hours 23.59
 King Island - 10 KI - 10 17.11
 King Island - Blue Dot 56.47
 KI - BDE
 Extended
 King Island - Blue Dot 66.88
 KI - BDSE
 South East
 King Island - 9 KI-9 36.36
 King Island - 7 KI - 7 14.52

Table 3. Total commercial catch (t) and the number of vessels that fished within each 2022 survey bed during the 2021
fishing season based on logbook data. Records coloured red are confidential – they were used in the analyses but
removed for final report.

 Bed Catch (t) Number of vessels

 FI – The Wreck A 370 7
 FI – The Wreck B 501 8
 FI-NB 256 6
 AB - The Hill Confidential
BSCZSF – 2022 Scallop Survey

Table 4. Biomass estimates, 95% confidence intervals and number of tows included in analyses. Note that both densities have been adjusted for a 33% assumed dredge efficiency.
 Area Bed Number of Mean density Standard Lower Estimated Upper Potential catch Density (ind/m2
 tows (kg/1000 m2) deviation 95% CI biomass 95% CI rate >85mm)
 (kg/1000 m2) (t) (t) (t) (kg/hr)
 Apollo AB-5 Hours 25 44 49.7 553 1,037 1,521 174 0.43
 AB-The Hill 25 241.5 130.5 11,343 14,601 17,859 956 2.39
 Sub-total 50 15,638

 FI – The
 Flinders 25 42.1 28.4 1,138 1,578 2,019 167 0.34
 Wreck A
 FI – The
 25 51 34.7 1,335 1,856 2,377 202 0.43
 Wreck B
 FI-NB 25 51.9 38.3 1,135 1,632 2,130 206 0.36
 Sub-total 75 5,066

 King KI - 10 25 225.6 133 2,920 3,860 4,799 893 2.06
 KI - 7 25 21.6 29.9 134 313 492 85 0.14
 KI - 9 25 288.3 204.6 7,412 10,482 13,552 1,142 1.17
 KI-BDSE 25 190 197.2 7,264 12,707 18,150 752 0.97
 KI - BDE 25 4.1 6.8 75 234 393 16 0.05
 Sub-total 125 27,596

 Total 250 250 48,300

Heading 1 – Insert Document Title Here AFMA.GOV.AU 19 of 34
BSCZSF – 2022 Scallop Survey

Table 5. Percent weight of scallops > 85 mm (catch weighted by weight), and biomass estimates 95% confidence intervals
for scallops greater than 85 mm.
 Area Bed % weight > Lower 95% Estimated Upper 95%
 85 mm CI (t) Biomass (t) CI (t)
 Apollo AB-5 Hours 97.8 541 1,014 1,488
 AB-The Hill 82.5 9,361 12,050 14,739
 Sub-total 13,064

 Flinders FI – The Wreck A 97.8 1,113 1,544 1,975
 FI – The Wreck B 99.1 1,323 1,839 2,355
 FI-NB 99.4 1,128 1,622 2,117
 Sub-total 5,005

 King KI - 10 82.3 2,404 3,178 3,951
 KI - 7 46.9 63 147 231
 KI - 9 38.2 2,833 4,007 5,180
 KI-BDSE 49.4 3,589 6,278 8,966
 KI - BDE 91.4 69 214 359
 Sub-total 13,824

 Total 31,893
Table 6. Number of length measurements (N), median, mean and standard error (SE) of scallops measured, and % of
scallops measured (catch weighted by weight) less than and greater than 85 mm and mean number of meats per kg of
scallops greater than 85 mm from each bed.

 Length (mm) 85 mm Meats / kg
 Bed N Median Mean SE %< %> Mean
 AB - Five Hours 599 98 97 0.3 97.8 2.2 98
 AB - The Hill North 875 94 93 0.3 82.5 17.5 158
 FI – The Wreck A 875 101 101 0.3 97.8 2.2 54
 FI – The Wreck B 791 100 100 0.3 99.1 0.9 52
 FI-NB 831 105 105 0.3 99.4 0.6 48
 KI - 10 875 96 95 0.3 82.3 17.7 70
 KI - 7 512 83 83 0.2 46.9 53.1 91
 KI - 9 911 84 87 0.4 38.2 61.8 108
 KI - BDSE 787 88 88 0.3 49.4 50.6 80
 KI - BDE 303 91 91 0.4 91.4 8.6 70
BSCZSF – 2022 Scallop Survey

Table 7. Number of scallops retained for biological sampling, and parameter estimates for length weight relationships.
The Blue Dot Beds sub area included KI-BDE, KI-BDSE and KI-10.

 Sub Area N a b Adjusted R2
 Flinders Island 136 -6.7037 2.4483 0.72
 KI - Blue Dot Beds 110 -8.07122 2.73304 0.89
 KI-7 and KI-9 100 -6.8211 2.4465 0.83
 AB – The Hill 49 -3.5422 1.7009 0.54
 AB – Five Hours 48 -4.5781 1.9595 0.87
Table 8. Catch of each species in each bed. (u) refers to undifferentiated species recorded at a higher taxonomic level.
 Catch (kg)
 AB - Five AB - The Hill FI – The FI – The KI -
 Species Hours North FI-NB Wreck A Wreck B KI - 10 KI - 7 KI - 9 KI - BDE BDSE
 Commercial Scallop 753.94 4297.2 1059.91 641.58 855 4341.61 398.18 4763.7 80.51 3896.92
 Clappers 2.55 222.33 15.19 1.73 5.82 53.6 5.03 58.82 6.9 180.38
 New Single 180.96 2153.5 192.76 80.34 182.87 530.42 65.54 383.61 117.7 705.66
 Old Single 664.94 755.16 776.86 509.76 690.74 770.24 1565.82 1321.24 1959.22 1139.3
 Ascidian (U) 130.3 36.7 1635.36 1468.69 69.36 72.7 17.9 78.29 26
 Banded Stingaree 1.15 1.07 3.6 0.45 0
 Barracouta 0.05
 Bassina Spp. 1.7
 Black And White Seastar 0.22 0.08
 Bluefin Leatherjacket 0.25
 Brittlestars (U) 0.76 0.01 1.57
 Cockle 2.75 0.1 8.15
 Cocky Gurnard 0.9 0.4 0.4 13.97 0.4 2.5 0.75 1
 Common Gurnard Perch 0.8 0.4 0.35 0.4 0.6 0.5
 Common Stargazer 2.1 1.85
 Cowrie (U) 0.6
 Crab (U) 0.06 0.01 0.42
 Cuttlefish (U) 0.7
 Dog Whelk 1.6 3
 Doughboy Scallop 5.6 3.78 126.05 0.44 8
 Eleven-Arm Seastar 321
 87.45 102.92 118.18 42.93
 False Bailer Shell 6.3 4.7 9.1 2
 Greenback Stingaree 2.05 0.25 0.2 0.35 0.15 0.2 0
 Hard Coral 0.35
 Hermit Crab (U) 1.9 3.2 49.34 17.94 19.54 6.5 20.9 1.1 8.24 13
 Holothurian (U) 6.8
 King Island Thickshell-Clam 1.45 2 68.18 3.06 4.44
 Longnose Skate 1.8 4.1 0.34 1 2.8 0
 Maori Octopus 0.4 0.4
 Mollusc (U) 0.2 2.16 0.96
 Octopus (U) 3.3 3.65 6.09 4.1 2.7 4.2 3.6 1.35 1.15 2
 Oysters 14.3 548.72 590.94 711.08 22
 Pale Octopus 2.4 1 1.3 1.4
 Polychaete Worm (U) 0.01
 Razorfish (U) 12.1 0.9 5.52
 Roundsnout Gurnard 0.15
 Sea Urchin (U) 0.15 1.9
 Seapen (U) 20 5.65 1.38 1.38 0.8 4.58 15
 Seastar (U) 1.12 0.48
 Shark Egg (U) 0.3 0.28 0.35 1.1 0.15 0.2
 Shaw Cowfish 0.15 0.1 0.45
 Silverbelly 0.05
 Skate (U) 5 2.99 0.46
 Soft Coral (U) 22.8 46.4 83.64 353.63 1.1 443.75
 Sole (U) 0.12 7
 Solitary Ascidians (U) 11.4 0.7 0.4 1.25 0.25 1.65 0.1 2
 Southern Blue-Ringed Octopus 0.2 0.3
 Southern Red Scorpionfish 0.06
 Southern Sand Flathead 0.2 0.5
 Sparsely-Spotted Stingaree 0.5 0.85 0.85 0.5 0.2 0.5 0.2 6
 Speckled Stargazer 1.7 2.3 0.45 0.35
 Spider Crab (U) 108.2 673.5 51.8 33.05 15.1 139.2 79.78 109.1 624.11 473.3
 Sponge (U) 160.15 614.8 1819 215.05 514.81 906.35 2087.99 907.22 1320.1 209.9
 Substrate - Broken Shell 315.3 1766.1 2390.5 834.21 1005.91 1060.51 786.8 1418.63 2339.8 1900.3
 Substrate - Rock 216.95 52.8 382.6 11.2 56.9 13.5 259.2 28.1
 Tasmanian Numbfish 0.35 0.45 0.8 0.5 0.65 0.25 0
 Tiger Flathead 2.2 0.8
 Venus Shells 2.4 47.83 4.16 7.44 0.05
 Volute (U) 17.2 0.3 0.85 0.66 0.5 2.32 4.3 1
 Whelk 15.4 2.65 91.29 45.08 42.18 54 255.96 40.27 40.73 86

Securing Australia’s fishing future AFMA.GOV.AU 21 of 34
BSCZSF – 2022 Scallop Survey

Figure 4. Scallop density (kg / 1000 m2) within the FI – The Wreck A, FI – The Wreck B and FI – North of Babel beds near
Flinders Island. The scale bubbles on the right reflect the estimated scallop density of each tow assuming a dredge
efficiency of 33%. Red circles denote zero catches.

Securing Australia’s fishing future AFMA.GOV.AU 22 of 34
BSCZSF – 2022 Scallop Survey

Figure 5. Scallop density (kg / 1000 m2) within the KI - BDE, KI – BDSE, KI - 10, KI – 7 and KI - 9 beds. The scale bubbles on
the right reflect the estimated scallop density of each tow assuming a dredge efficiency of 33%. Red circles denote zero
catches.

Figure 6. Scallop density (kg / 1000 m2) within the AB – The Hill and AB – Five Hours beds. The top right scale bubbles
reflect the estimated scallop density of each tow assuming a dredge efficiency of 33%. Red circles denote zero catches.

Securing Australia’s fishing future AFMA.GOV.AU 23 of 34
BSCZSF – 2022 Scallop Survey

 A B

 C D

Figure 7. Log transformed A) length and weight, B) length and height, C) length and width and D) height and width from
each area bed.

Securing Australia’s fishing future AFMA.GOV.AU 24 of 34
BSCZSF – 2022 Scallop Survey

Figure 8. Catch weighted size frequency from tows included in biomass estimates from each bed. The vertical line is at
85 mm.

Figure 9. Frequency of combined meat and gonad weights of scallops >85 mm measured from each bed binned into 2 g
weight categories.

Securing Australia’s fishing future AFMA.GOV.AU 25 of 34
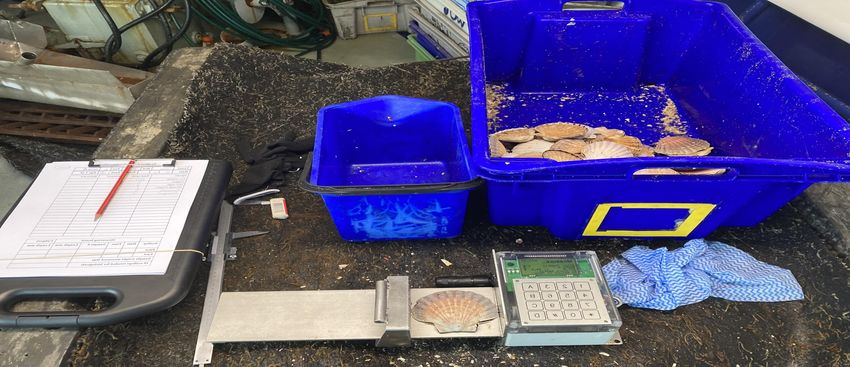
BSCZSF – 2022 Scallop Survey

Figure 10. Percent of scallops at each stage from each bed based on macroscopic staging criteria shown in Table 10.

Figure 11. Percent catch composition by weight from all beds.

Securing Australia’s fishing future AFMA.GOV.AU 26 of 34
BSCZSF – 2022 Scallop Survey

Figure 12. Percent composition of clappers, live scallop, new single and old single shell from each Bed.

4 Discussion
Random stratified surveys were successfully undertaken on ten scallop beds off FI, KI and AB . Beds were
selected based on a combination of previous surveys, distribution of catch and effort, advice from
ScallopRAG and marks provided by industry. In total, 250 valid, random survey tows were undertaken.
Biomass was calculated for each bed using area swept calculated from the straight-line distance between
the start and end tow points and the measured internal width of the dredges.

Biomass of Commercial Scallops greater than 85 mm was estimated to be 13,064 t at the two AB, 5,005 t at
the three FI Beds and 13,824 t at the KI beds (Table 9). Total biomass greater than 85 mm at all sites
combined was 31,893 t. The percent of Commercial Scallops greater than 85 mm was more than 80% at
most sites, while only 46.9%, 38.2% and 49.4% of Commercial Scallops were greater than 85 mm at KI – 7,
KI – 9 and KI – BDSE respectively, all three sites with significant recruitment observed. Densities in
individuals per m2 ranged 0.05 at KI – BDE to 2.39 at AB – The Hill (Table 9).

These results were presented at the ScallopRAG meeting on 7 June 2022 and at the ScallopMAC meeting on
9 June 2022.

Securing Australia’s fishing future AFMA.GOV.AU 27 of 34
BSCZSF – 2022 Scallop Survey

Table 9. Summary of data used to inform the 2022 ScallopRAG and ScallopMAC recommendation for harvest strategy
requirements and TAC.

Securing Australia’s fishing future AFMA.GOV.AU 28 of 34
BSCZSF – 2022 Scallop Survey

References
Haddon, M., Harrington, J.J. and Semmens, J.M., 2006. Juvenile Scallop Discard Rates and Bed Dynamics:
 Testing the Management Rules for Scallops in Bass Strait. Tasmanian Aquaculture and Fisheries
 Institute, Taroona, Tasmania.

Harrington, Semmens & Haddon (2008). 2008 Commonwealth Bass Strait Central Zone Scallop Fishery
 Survey. Survey Final Report. Tasmanian Aquaculture and Fisheries Institute. University of
 Tasmania.

Knuckey, I., Koopman, M., and Davis, M. (2015). Bass Strait and Central Zone Scallop Fishery - 2015 Survey.
 AFMA Project 2015/001291. Fishwell Consulting 22pp.

Knuckey, I., Koopman, M., and Davis, M. (2016). Bass Strait and Central Zone Scallop Fishery - 2016 Survey.
 AFMA Project 2016/0804. Fishwell Consulting. 30pp

Knuckey, I., Koopman, M., Hudson, R., Davis, M., and A. Sullivan (2017). Bass Strait and Central Zone Scallop
 Fishery - 2017 Survey. AFMA Project 2016/0806. Fishwell Consulting. 42pp.

Knuckey, I., Koopman, M. and, Hudson, R., (2018). Bass Strait and Central Zone Scallop Fishery - 2018
 Survey. AFMA Project 2017/0822. Fishwell Consulting. 44pp.

Koopman, M., Knuckey, I., Sih, T. and Kube, J. (2019). Bass Strait and Central Zone Scallop Fishery - 2019
 Survey. AFMA Project 2019-0812. Fishwell Consulting. 39 pp.

Koopman, M., Knuckey, I., Kube, J., Davis, A. and Sullivan, A. (2021). Bass Strait and Central Zone Scallop
 Fishery - 2021 Survey. AFMA Project 2019-0812. Fishwell Consulting. 39 pp.

Pebesma, E., 2018. Simple Features for R: Standardized Support for Spatial Vector Data. The R Journal 10
 (1), 439-446, https://doi.org/10.32614/RJ-2018-009

R Core Team (2022). R: A language and environment for statistical computing. R Foundation for Statistical
 Computing, Vienna, Austria. URL https://www.R-project.org/.

Semmens, J.M., Mendo, T., Jones, N., Keane, J., Leon, R., Ewing, G. and Hartmann, K. (2018). Determining
 when and where to fish: Linking scallop spawning, settlement, size and condition to
 collaborative spatial harvest and industry in-season management strategies, Institute for Marine
 and Antarctic Studies and University of Tasmania, Hobart, June. CC BY 3.0

Semmens, J. and Jones, N. (2014). Draft 2014 BSCZSF survey report. Institute for Marine and Arctic
 Studies. July 2014.

Securing Australia’s fishing future AFMA.GOV.AU 29 of 34
You can also read