ATLANTIC STATES MARINE FISHERIES COMMISSION
←
→
Page content transcription
If your browser does not render page correctly, please read the page content below
ATLANTIC STATES MARINE FISHERIES COMMISSION

REVIEW OF THE INTERSTATE FISHERY MANAGEMENT PLAN
                           HORSESHOE CRAB
                         (Limulus polyphemus)

                            2019 Fishing Year

                     Prepared by the Plan Review Team

                        Approved October 21, 2020
      Revised 1/5/2021 to include Massachusetts 2019 bait landings data

             Sustainable and Cooperative Management of Atlantic Coastal Fisheries
Table of Contents

I.     Status of the Fishery Management Plan .............................................................................. 1
II.    Status of the Stock and Assessment Advice ......................................................................... 3
III.   Status of the Fishery ............................................................................................................. 4
IV.    Status of Research and Monitoring ...................................................................................... 8
V.     Status of Management Measures and Issues .................................................................... 12
VI.    PRT Recommendations and Research Needs..................................................................... 13
VII.   State Compliance and Monitoring Measures..................................................................... 16
I.      Status of the Fishery Management Plan

Date of FMP Approval:                  December 1998

Amendments                             None

Addenda                                Addendum I (April 2000)
                                       Addendum II (May 2001)
                                       Addendum III (May 2004)
                                       Addendum IV (June 2006)
                                       Addendum V (September 2008)
                                       Addendum VI (August 2010)
                                       Addendum VII (February 2012)

Management Unit:                       Entire coastwide distribution of the resource from the
                                       estuaries eastward to the inshore boundary of the EEZ

States with Declared Interest:         Massachusetts – Florida, Potomac River Fisheries
                                       Commission

Active Boards/Committees:              Horseshoe Crab Management Board, Advisory Panel,
                                       Technical Committee, and Plan Review Team; Delaware
                                       Bay Ecosystem Technical Committee
Goals and Objectives
The Interstate Fishery Management Plan for Horseshoe Crabs (FMP) established the following
goals and objectives.

2.0. Goals and Objectives
The goal of this Plan is to conserve and protect the horseshoe crab resource to maintain
sustainable levels of spawning stock biomass to ensure its continued role in the ecology of the
coastal ecosystem, while providing for continued use over time. Specifically, the goal includes
management of horseshoe crab populations for continued use by:

     1) current and future generations of the fishing and non-fishing public (including the
        biomedical industry, scientific and educational research);
     2) migrating shorebirds; and,
     3) other dependent fish and wildlife, including federally listed (threatened) sea turtles.

To achieve this goal, the following objectives must be met:
    (a) prevent overfishing and establish a sustainable population;
    (b) achieve compatible and equitable management measures among jurisdictions
    throughout the fishery management unit;

                                                                                                  1
(c) establish the appropriate target mortality rates that prevent overfishing and maintain
adequate spawning stocks to supply the needs of migratory shorebirds;
(d) coordinate and promote cooperative interstate research, monitoring, and law
enforcement;
(e) identify and protect, to the extent practicable, critical habitats and environmental factors
that limit long-term productivity of horseshoe crabs;
(f) adopt and promote standards of environmental quality necessary for the long-term
maintenance and productivity of horseshoe crabs throughout their range; and,
(g) establish standards and procedures for implementing the Plan and criteria for
determining compliance with Plan provisions.
Fishery Management Plan Summary
The framework for managing horseshoe crabs along the Atlantic coast was approved in October
1998 with the adoption of the Interstate Fishery Management Plan (FMP) for Horseshoe Crabs.
The goal of this plan is to conserve and protect the horseshoe crab resource to maintain
sustainable levels of spawning stock biomass to ensure its continued role in the ecology of
coastal ecosystems while providing for continued use over time.
In 2000, the Horseshoe Crab Management Board approved Addendum I to the FMP. Addendum
I established a state-by-state cap on horseshoe crab bait landings at 25 percent below the
reference period landings (RPL's), and de minimis criteria for those states with a limited
horseshoe crab fishery. Those states with more restrictive harvest levels (Maryland and New
Jersey) were encouraged to maintain those restrictions to provide further protection to the
Delaware Bay horseshoe crab population, recognizing its importance to migratory shorebirds.
Addendum I also recommended that the National Marine Fisheries Service (NMFS) prohibit the
harvest of horseshoe crabs in federal waters (3-200 miles offshore) within a 30 nautical mile
radius of the mouth of Delaware Bay, as well as prohibit the transfer of horseshoe crabs in
federal waters. A horseshoe crab reserve was established on March 7, 2001 by NMFS in the
area recommended by ASMFC. This area is now known as the Carl N. Shuster Jr. Horseshoe
Crab Reserve.
In 2001, the Horseshoe Crab Management Board approved Addendum II to the FMP. The
purpose of Addendum II was to provide for the voluntary transfer of harvest quotas between
states to alleviate concerns over potential bait shortages on a biologically responsible basis.
Voluntary quota transfers require Technical Committee review and Management Board
approval.
In 2004, the Board approved Addendum III to the FMP. The addendum sought to further the
conservation of horseshoe crab and migratory shorebird populations in and around the
Delaware Bay. It reduced harvest quotas and implemented seasonal bait harvest closures in
New Jersey, Delaware, and Maryland, and revised monitoring components for all jurisdictions.
2Addendum IV was approved in 2006. It further limited bait harvest in New Jersey and Delaware
to 100,000 crabs (male only) and required a delayed harvest in Maryland and Virginia.
Addendum V, adopted in 2008, extended the provisions of Addendum IV through October 31,
2010.
In early 2010, the Board initiated Draft Addendum VI to consider management options that
would follow expiration of Addendum V. The Board voted in August 2010 to extend the
Addendum V provisions, via Addendum VI, through April 30, 2013. The Board also chose to
include language allowing them to replace Addendum VI with another Addendum during that
time, in anticipation of implementing an Adaptive Resource Management (ARM) Framework.
The Board approved Addendum VII in February 2012. This addendum implemented an ARM
framework for use during the 2013 fishing season and beyond. The framework considers the
abundance levels of horseshoe crabs and shorebirds in determining the optimized bait harvest
level for the Delaware Bay states of New Jersey, Delaware, Maryland, and Virginia (east of the
COLREGS).
II. Status of the Stock and Assessment Advice
A benchmark stock assessment was completed and approved for management use in 2019. The
assessment report is available at:
http://www.asmfc.org/uploads/file/5cd5d6f1HSCAssessment_PeerReviewReport_May2019.pdf
This assessment was the first to successfully apply a stock assessment model to a component of
the horseshoe crab stock. A Catch Multiple Survey Analysis (CMSA) model, a stage-based model
that tracks progression of crab abundances from pre-recruits to full recruits to the fishery, was
applied to female crabs in the Delaware (DE) Bay region (New Jersey-Virginia). This model
estimated regional female crab abundance using relative abundance information from the
Virginia Tech Benthic Trawl Survey, New Jersey Ocean Trawl Survey, and Delaware Adult Trawl
Survey, and estimates of mortality including natural mortality, commercial bait harvest,
commercial discard mortality, and mortality associated with biomedical use. While reference
points were not approved to determine stock status, the CMSA population estimates were
recommended as the best estimates for female horseshoe crab abundance in the DE Bay
region.
The base CMSA model population estimates show an increase in the number of female crabs in
the DE Bay region since 2012, when the ARM Framework was established via Addendum VII.
This increasing trend is supported by positive trends in regional fishery-independent surveys
during this time period. Population estimates from the base model are not publicly available
due to the inclusion of confidential biomedical data. However, a sensitivity run assuming no
biomedical mortality is publicly viewable, and these estimates are not significantly different
from the base model results. Estimates of discard mortality from the Northeast Fisheries
Observer Program (NEFOP) were also included in the base CMSA model and indicate that
3discard mortality could be significant, of similar or greater magnitude than mortality due to bait harvest. Population estimates from the CMSA are currently being considered for incorporation into the ARM Framework, which is applied annually to specify bait harvest quotas for the DE Bay region. Autoregressive Integrated Moving Average (ARIMA) models, similar to those used in previous assessments, were applied to all regions. ARIMA models were fit to fishery-independent survey indices trends of abundance in each of the regional horseshoe crab populations: Northeast (Massachusetts-Rhode Island), New York (Connecticut-New York), DE Bay, and Southeast (North Carolina-Florida). No definitions for overfishing or overfished status have been adopted by the Management Board. However, the assessment characterized the status of each regional and the coastwide population based on the percentage of surveys within a region (or coastwide) having a >50% probability of the terminal year being below the ARIMA reference point. The ARIMA reference point was the 1998 index for each survey. “Poor” status was defined as >66% of surveys meeting this criterion, “Good” status was defined as
greater than 5% of coastal landings are required to report sex for at least a portion of their bait
harvest, and within these states, 17% of reported landings were unclassified in 2019.
The hand, trawl, and dredge fisheries typically account for the majority of reported commercial
horseshoe crab bait landings. Other gears that account for the remainder of the harvest include
rakes, hoes, and tongs, fixed nets, and gill nets.

Table 1. Reported commercial horseshoe crab bait landings by jurisdiction. Note: Landings from 2017
and earlier were updated to numbers validated by all jurisdictions for use in the 2019 benchmark
stock assessment.
                                State
                 ASMFC
 Jurisdiction                   Quota        2019        2018        2017        2016        2015
                Quota 2019
                                2019
     MA          330,377       165,000     172,664     159,002      134,707     110,399     117,611
      RI          26,053        8,398          C         1,889       3,415      20,676       7,867
      CT          48,689       48,689       17,588      21,870      19,944      21,945       19,632
      NY         366,272       150,000     167,181     138,223      195,717     176,632     145,324
     NJ*         162,136          0            0           0           0           0           0
     DE*         162,136       159,211     164,225     126,065      201,132     109,836     151,262
     MD*         255,980       255,980     145,907      66,647      237,146     157,013      27,494
    PRFC             0            -            0           0           0           0           0
    VA**         172,828       172,828     151,727     140,584      160,331     128,848     102,235
      NC          24,036       24,036       13,463      10,998      25,161      25,197       24,839
      SC             0            0            0           0           0           0           0
      GA          29,312       29,312          0           0           0           0           0
      FL           9,455        9,455          0           C         1,394        689         264
    TOTAL         1,587,274 1,022,909 832,755            665,278     978,947      751,235    596,528
*Male-only harvest
**Virginia harvest east of the COLREGS line is limited to 81,331 male-only crabs under the ARM harvest
package #3. Virginia data shown are preliminary. Virginia harvest east of the COLREGS in 2019 was 65,113
crabs. The total above represents harvest on both sides of the COLREGS line.

                                                                                                      5
Figure 1. Number of horseshoe crabs harvested for bait and collected for biomedical purposes, 1998-
2019.
* Biomedical collection numbers, which are annually reported to the Commission, include all horseshoe
crabs brought to bleeding facilities except those that were harvested as bait and counted against state
quotas.
* Most biomedical crabs collected are returned to the water after bleeding; a 15% mortality rate is
assumed for all bled crabs that are released. This number plus observed mortality reported annually by
bleeding facilities via state compliance reports is noted in the above graph as 'Estimated Biomedical
Mortality.'
Biomedical Use
The horseshoe crab is an important resource for research and manufacture of materials used
for human health. There are five companies along the Atlantic Coast that process horseshoe
crab blood for use in manufacturing Limulus Amebocyte Lysate (LAL): Associates of Cape Cod,
Massachusetts; Lonza (formerly Cambrex Bioscience), Limuli Laboratories, New Jersey; Wako
Chemicals, Virginia; and Charles River Endosafe, South Carolina. Addendum III requires states
where horseshoe crabs are collected for biomedical bleeding to collect and report total
collection numbers, crabs rejected, crabs bled (by sex) and to characterize mortality.
The Plan Review Team (PRT) annually calculates total coastwide collections and estimates
mortality associated with biomedical use. In 2019, 637,029 crabs coastwide were collected for
biomedical purposes only (Table 2); this does not include bait crabs that were bled and then
returned to the bait market, which are counted against state bait quotas. This represents a 25%
increase from 2018. Males accounted for 60% of total biomedical collections and females
comprised 40%. Some crabs were rejected prior to bleeding due to mortality, injuries, slow
movement, and size (mortality observed while crabs were going through the biomedical
6process is included under ‘Observed Mortality’ in Table 2). Approximately 2% of crabs collected
solely for biomedical purposes were observed and reported as dead from the time of collection
up to the point of bleeding.
During the 2019 benchmark stock assessment, literature estimates were analyzed to estimate
post-bleeding mortality. Although many of these studies did not implement biomedical best
practices, these values are the only available estimates of mortality experienced after bleeding.
Post-bleeding mortality was estimated at 15%. Tagging data was used in the assessment to
compare survivorship between crabs that were and were not bled. These results indicated
some decrease in short-term survivorship, but greater long-term survivorship for bled crabs.
These results are likely attributable to the culling process used by biomedical facilities to select
healthy crabs for bleeding.
Post-bleeding mortality, calculated as 15% of the number of bled biomedical-only crabs (not
sold for bait), for 2019 was estimated as 88,404 crabs. Total mortality (observed mortality plus
post-bleeding mortality) of biomedical crabs for 2019 was estimated as 101,193 crabs. This
represents approximately 11% of the 2019 total directed use mortality (933,948 crabs), which
includes both total biomedical mortality and removals for bait.
The 1998 FMP establishes a biomedical mortality threshold of 57,500 crabs that, if exceeded,
requires the Board to consider management action. Based on the estimated total mortality of
101,193 crabs, this threshold was exceeded in 2019, as it has been for 12 of the last 13 years.
Estimated mortality from biomedical use in 2019 represents the highest value in the time series
(a 30% increase from 2018 in numbers of crabs). Results of the 2019 Benchmark Stock
Assessment indicate that levels of biomedical mortality prior to 2017 (the terminal year of data
used in the assessment), which were relatively consistent between 2013-2018 (with the
exception of 2016), did not have a significant effect on horseshoe crab population estimates or
fishing mortality in the Delaware Bay region.
Table 2. Numbers of horseshoe crabs collected, bled, and estimated mortality for the biomedical
industry. Numbers shown are for crabs collected solely for biomedical use. Mortality of bled crabs that
enter the bait industry after bleeding is included in bait harvest.
Post-Bleeding Observed
Year Crabs Collected Crabs Bled Total Mortality
Mortality Mortality
2010 480,914 412,781 61,917 6,829 68,746
2011 545,164 486,850 73,028 24,139 97,166
2012 541,956 497,956 74,693 7,370 82,063
2013 464,657 440,402 66,060 5,447 71,507
2014 467,897 432,340 64,851 5,658 70,509
2015 494,123 464,506 69,676 5,362 75,038
2016* 344,495 318,523 47,778 1,004 48,782
2017 483,245 444,115 66,617 6,056 72,674
2018 510,407 479,142 71,871 5,588 77,459
2019 637,029 589,361 88,404 12,789 101,193
*Some biomedical collections were reduced in 2016 due to temporary changes in production.
7IV. Status of Research and Monitoring
The Horseshoe Crab FMP set forth an ambitious research and monitoring strategy in 1999 and
again in 2004 to inform future management decisions. Despite limited time and funding there
are many accomplishments since 1999. These accomplishments were largely made possible by
forming partnerships between state, federal and private organizations, and the support of
hundreds of public volunteers.
Addendum III Monitoring Program
Addendum III requires affected states to carry out three monitoring components:
All states who do not qualify for de minimis status report monthly harvest numbers and
subsample a portion of the catch for sex and harvest method. In addition, those states with
annual landings above 5% of the coastwide harvest report all landings by sex and harvest
method. Although states with annual landings less than 5% of annual coastwide harvest are not
required to report landings by sex, the PRT recommends all states require sex-specific reporting
for horseshoe crab harvest.
States with biomedical collections are required to monitor and report collection numbers and
mortality associated with the transportation and bleeding of the crabs.
States must identify spawning and nursery habitat along their coasts. All states have completed
this requirement, and a few continue active monitoring programs.
Virginia Tech Research Projects
The Virginia Tech Horseshoe Crab Trawl Survey (VT Survey) was not conducted in 2013-2015,
due to a lack of funding, but was conducted in 2016-2019, and is in progress for 2020. The 2019
survey results indicate decreases from 2018 across all demographic groups (immature, newly
mature, and mature females and males) in the coastal Delaware Bay area (DBA). It is noted that
the 2019 Delaware Bay spawning survey was conducted from late August to late September.
The average bottom water temperature in 2019 was the highest in the time series. The 2019
lower Delaware Bay (LDB) survey was conducted in mid-October, nearly a month earlier than in
2018, and later than the DBA survey. As a result, the average LDB water temperature was 5.6 C°
cooler than the average DBA temperature. Horseshoe crabs that were within the Bay during
most of the DBA survey because of the warm temperature, and not enumerated, may have
moved out of the Bay by the time the LDB survey was conducted, and again not enumerated.
This may have resulted in underestimates of horseshoe crabs in both survey areas and
contributed to the apparent decrease in mature M:F ratios in both survey areas since 2016.
Mean catch-per-tow of mature males and females in the coastal Delaware Bay area have shown
increasing trends since 2002.
The Adaptive Resource Management (ARM) Working Group will use the indices from this survey
to estimate horseshoe crab abundance for the ARM model, which specifies harvest limits for
the upcoming year. The VT Survey for 2020 is currently in progress and is funded for 2021.
Funding sources beyond 2021 continue to be explored.
8Spawning Surveys
The redesigned Delaware Bay spawning survey was completed for the 21st year in 2019.
Baywide female spawning activity over the past 21 years showed no significant trend; though,
the slope was slightly negative. Baywide male spawning activity showed a significant increasing
trend. At the state level, trends in male spawning exhibited a significant positive slope in both
states. The trend from the index of female spawning activity exhibited a slightly negative slope
in Delaware, and a slightly positive slope in New Jersey. Neither was statistically significant.
Female spawning activity in 2019 peaked during the third lunar period sampled (June 1 – June
5). The annual baywide sex ratio was 5.5:1 (Male: Female) the second highest ratio in the time
series. The range of annual observed sex ratios on the Delaware Bay spawning beaches over
the time series has ranged from 3.1:1 to 5.6:1.
Tagging Studies
The USFWS continues to maintain a toll-free telephone number and a website for reporting
horseshoe crab tag returns and assists interested parties in obtaining tags. Tagging work
continues to be conducted by biomedical companies, research organizations, and other parties
involved in outreach and spawning surveys. Beginning with the 2013 tagging season, additional
efforts were implemented to ensure that current tagging programs are providing data that
benefits the management of the coastwide horseshoe crab population. All existing and new
tagging efforts are required to submit an annual application to be considered for the USFWS
tagging program and all participants must submit an annual report along with their tagging and
resighting data to indicate how their tagging program addresses at least one of the following
objectives: determine horseshoe crab sub-population structure, estimate horseshoe crab
movement and migration rates, and/or estimate survival and mortality of horseshoe crabs. The
PRT recommends all tagging programs approved by the states coordinate with the USFWS
tagging program, in order to ensure a consistent coastwide program to support management.
Since 1999, over 360,000 crabs have been tagged and released through the USFWS tagging
program along the Atlantic coast. Crabs have been tagged and released from every state on the
Atlantic Coast from Florida to New Hampshire. In the early years of the program, tagging was
centered around Delaware Bay; however, in recent years, tagging has expanded and increased
in Long Island Sound and the Southeast. Tagging information from this database has been used
in the 2019 Benchmark Stock Assessment to define stock structure, estimate total mortality,
and characterize impacts of biomedical use on crab mortality.
New York Region Monitoring
Following the 2019 Benchmark Stock Assessment, which characterized the status of the
horseshoe crab population in the New York region as “Poor”, the Board directed the PRT to
monitor fishery-independent surveys in this area to track progress of state management actions
toward improving this regional population. During the assessment, five surveys were included
in the ARIMA model to characterize this population. One of these, the Northeast Area
Monitoring and Assessment Program (NEAMAP), includes sample areas outside of the New York
region, making it too data-intensive to specify the regional index on an annual basis. The most
recent information from the state-conducted surveys used in the assessment is summarized
9below, but can be viewed in greater detail in the Connecticut and New York state compliance
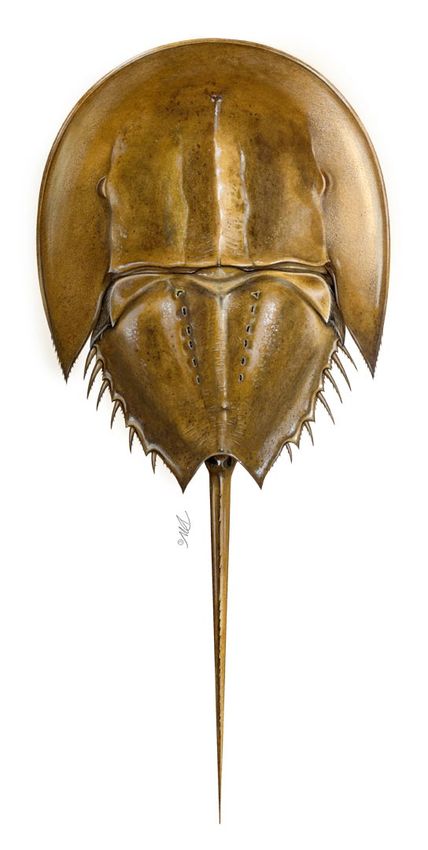
reports. The Western Long Island (WLI) Little Neck Bay and Manhasset Bay seine surveys were
combined in the assessment to form a single index, but are shown below separately. Figures 2-5
show the annual index for each survey over the time series.
Connecticut
• Long Island Sound Trawl (Fall) – 2019 index = 0.82 kg/tow, decrease from 2018
New York
• Peconic Trawl – 2019 index = 0.2 (delta distribution average catch per unit effort
[CPUE]), slight increase from 2018, below 2010-19 average (0.23)
• WLI Jamaica Bay Seine (all horseshoe crabs) – 2019 index = 0.23 (geometric mean),
decrease from 2018, below 2010-19 average (0.32)
• WLI Little Neck Bay Seine (all) – 2019 index = 0.88 (geometric mean), decrease from
2018, below 2010-19 average (1.16)
• WLI Manhasset Bay Seine (all) – 2019 index = 0.68 (geometric mean), decrease from
2018, below 2010-19 average (0.65)
Figure 2. LISTS Horseshoe Crab Indices, 1992-2019.
10Figure 3. Peconic Bay Trawl Survey: May through July, 1987-2019.
Figure 4. NYSDEC WLI Beach Seine Survey All Horseshoe Crab GM Index, 1987-2019.
11Figure 5. Little Neck Bay Seine Survey All Horseshoe Crab GM Index, 1987-2019.
Figure 6. Manhasset Bay Seine Survey All Horseshoe Crab GM Index, 1987-2019.
V. Status of Management Measures and Issues
ASMFC
Initial state harvest quotas were established through Addendum I. Addendum III outlined the
monitoring requirements and recommendations for the states. Addendum IV set harvest
closures and quotas, and other restrictions for New Jersey, Delaware, Maryland, and Virginia,
which were continued in Addendums V and VI.
The Board approved Addendum VII, implementation of the ARM Framework, in February 2012
for implementation in 2013. Addendum VII includes an allocation mechanism to divide the
Delaware Bay optimized harvest output from the ARM Framework among the four Delaware
Bay states (New Jersey, Delaware, Maryland, and Virginia east of the COLREGS). Season
12closures and restrictions, present within Addendum VI, remain in effect as part of Addendum
VII.
State-specific charts outlining compliance and monitoring measures are included in Section VII.
The PRT finds that all jurisdictions appear to be in compliance with the FMP and subsequent
Addenda in 2019.
Alternative Baits
Trials testing effectiveness of alternative baits to horseshoe crab for the American eel and
whelk fisheries have previously been conducted. Additionally, a survey of current bait usage in
the eel and whelk fisheries was conducted in 2017. This survey is available at:
http://www.asmfc.org/uploads/file/5a04b785HSC_BaitSurveyTCReport_Oct2017.pdf. The
Horseshoe Crab TC is currently determining whether any additional alternative bait products
will be tested in the near future.
Shorebird
The USFWS received petitions in 2004 and 2005 to emergency list the red knot under the
Endangered Species Act. In fall 2005, it determined that emergency listing was not warranted at
the time. As part of a court settlement, the USFWS agreed to initiate proposed listings of over
200 species, including the red knot. In fall 2013, the USFWS released a proposal for listing the
red knot as threatened. In January 2015 the USFWS designated the red knot as threatened
under the Endangered Species Act.
The red knot remains listed as an endangered species in the state of New Jersey (since 2012).
VI. PRT Recommendations and Research Needs
De Minimis
States may apply for de minimis status if, for the last two years, their combined average
horseshoe crab bait landings (by numbers) constitute less than one percent of coastwide
horseshoe crab bait landings for the same two-year period. States may petition the Board at
any time for de minimis status, if their fishery falls below the threshold level. Once de minimis
status is granted, designated States must submit annual reports to the Board justifying the
continuance of de minimis status.
States that qualify for de minimis status are not required to implement any horseshoe crab
harvest restriction measures, but are required to implement components A, B, E and F of the
monitoring program (Section 3.5 of the FMP; further modified by Addendum III). Since de
minimis states are exempt from a harvest cap, there is potential for horseshoe crab landings to
shift to de minimis states and become substantial, before adequate action can be taken. To
control shifts in horseshoe crab landings, de minimis states are encouraged to implement one
of the following management measures:
131. Close their respective horseshoe crab bait fishery when landings exceed the de
minimis threshold;
2. Establish a state horseshoe crab landing permit, making it only available to
individuals with a history of landing horseshoe crabs in that state; or
3. Establish a maximum daily harvest limit of up to 25 horseshoe crabs per person per
day. States which implement this measure can be relieved of mandatory monthly
reporting, but must report all horseshoe crabs harvests on an annual basis.
The following states have been removed from the Management Board in recent years:
Pennsylvania (2007), Maine (2011), and New Hampshire (2014). The Potomac River Fisheries
Commission, South Carolina, Georgia, and Florida are requesting de minimis status for the 2019
fishing season based on the 2018-19 season landings and meet the FMP requirements for being
granted this status (Table 1). The PRT recommends granting these jurisdictions de minimis
status.
Biomedical Threshold
In 2019, total biomedical mortality exceeded the FMP’s mortality threshold of 57,500 crabs,
which requires the Board to consider management action. This threshold has been exceeded in
12 of the last 13 years. The PRT has noted previously that the results of the 2019 Benchmark
Stock Assessment indicated recent levels of biomedical use did not result in mortalities that
would significantly alter population status. However, biomedical mortality in 2019 was 39%
higher than the average biomedical mortality between 2009 and 2018.
Funding for Research and Monitoring Activities
The PRT strongly recommends the funding and continuation of the VT benthic trawl survey. This
effort provides a statistically reliable estimate of horseshoe crab relative abundance that is
essential to continued ARM implementation and use of the CMSA stock assessment model.
Discard Mortality Estimation
Results of the 2019 Benchmark Stock Assessment indicate that discard mortality may be
significant, of similar or greater magnitude than bait harvest. The Review Panel’s report
indicated that these estimates could be further refined to reduce their uncertainty and more
precisely characterize this mortality source. The PRT recommends the Board take steps to
increase access to and use of data from the NEFOP, allowing for improved monitoring and
estimation of discard mortality.
Improvement of the New York Regional Population
Results of the 2019 Benchmark Stock Assessment indicate a “Poor” status for the New York
regional population, due to negative trends in regional abundance indices. New York and
Connecticut have indicated that they will take actions within their states to improve this
population. The PRT recommends that the Board encourage such actions to continue so that
this population’s status may improve. The PRT notes that bait harvest from New York increased
by 25% from 2018 to 2019.
14The PRT has begun and will continue to annually report regional indices of abundance so that
progress of management actions may be tracked through the annual FMP Reviews. The PRT
notes that indices of abundance from the Fall CT Long Island Sound Trawl Survey, Jamaica Bay
Seine Survey, Little Neck Bay Seine Survey, and the Manhasset Bay Seine Survey all decreased
from 2018; there was a slight increase from 2018 in the Peconic Bay Small Mesh Trawl Survey
index.
15VII. State Compliance and Monitoring Measures
MASSACHUSETTS
2019 Compliance 2020 Management Proposal
De minimis status Did not qualify for de miminis Does not qualify for de miminis
Bait Harvest Restrictions and Landings
- ASMFC Quota 330,377 330,377
(Voluntary State Quota) (165,000) (165,000)
Bait: 300 crab daily limit year Bait: 300 crab daily limit year
round; limited entry; round;
Biomedical: 1,000 crab daily Biomedical: 1,000 crab daily
limit; limit;
Conch pot and eel fishermen: Conch pot and eel fishermen:
no possession limit no possession limit
- Other Restrictions
All: May and June 5-day lunar All: May and June 5-day lunar
closures; No mobile gear closures; No mobile gear
harvest Fri-Sat during summer harvest Fri-Sat during summer
flounder season; 7” PW flounder season; 7” PW
minimum size; Pleasant Bay minimum size; Pleasant Bay
Closed Area Closed Area
- Landings 172,664 --
Monitoring Component A1
Yes, plus weekly dealer Yes, plus weekly dealer
- Mandatory monthly reporting
reporting through SAFIS reporting through SAFIS
- Characterize commercial bait fishery Yes Yes
Monitoring Component A2
- Biomedical reporting Yes Yes
- Required information for biomedical
Yes Yes
use of crabs
Monitoring Component A3
Yes Yes
Identify spawning and nursery habitat
Yes, VT Trawl Survey will be
Monitoring Component B1 Yes, VT Trawl Survey was conducted in 2020 & 2021;
Coastwide benthic trawl survey conducted in 2019 future years and spatial scope
unknown at this time
Monitoring Component B2
Continue existing benthic sampling Yes Yes
programs
Monitoring Component B3
Yes Yes
Implement spawning survey
Yes – w/NPS and USFWS; Yes – w/NPS and USFWS;
Monitoring Component B4
Pleasant Bay, Monomy NWR, Pleasant Bay, Monomy NWR,
Tagging program
Waquoit Bay Waquoit Bay
16RHODE ISLAND
2019 Compliance 2020 Management Proposal
De minimis status Did not qualify for de minimis Does not qualify for de minimis
Bait Harvest Restrictions and Landings
- ASMFC Quota 26,053 26,053
(Voluntary State Quota) (8,398) (8,398)
State Restrictions: State Restrictions:
- Daily possession limit: 60 - Daily possession limit: 60
crabs per permit crabs per permit
- Bait Fishery Closure: May 1- - Bait Fishery Closure: May 1-
- Other Restrictions May 31 May 31
- Biomedical Fishery Closure: - Biomedical Fishery Closure:
48 hours prior to and 48 48 hours prior to and 48
hours following new and full hours following new and full
moons during May moons during May
- Landings Confidential --
Monitoring Component A1
Yes, weekly call in and monthly Yes, weekly call in and monthly
- Mandatory monthly reporting
on paper on paper
- Characterize commercial bait fishery Yes Yes
Monitoring Component A2
- Biomedical reporting Yes Yes
- Required information for biomedical Yes, details within Captured in Massachusetts’
use of crabs Massachusetts’ reports reports
Monitoring Component A3
Yes Yes
Identify spawning and nursery habitat
Yes, VT Trawl Survey will be
Monitoring Component B1 Yes, VT Trawl Survey was conducted in 2020 & 2021;
Coastwide benthic trawl survey conducted in 2019 future years and spatial scope
unknown at this time
Monitoring Component B2
Continue existing benthic sampling Yes Yes
programs
Monitoring Component B3 Yes, since 2000 (methods
Yes
Implement spawning survey unspecified)
State Wildlife Grant for 2020-
Monitoring Component B4 RI DEM 2001-2004 only, 2021 tagging program in
Tagging program No current state program collaboration with URI. Status
unknown beyond 2021.
17CONNECTICUT
2019 Compliance 2020 Management Proposal
De minimis status Did not qualify for de miminis Does not qualify for de miminis
Bait Harvest Restrictions and Landings
- ASMFC Quota 48,689 48,689
Limited entry program, Limited entry program,
- Other Restrictions possession limits, and seasonal possession limits, and seasonal
and area closures and area closures
- Landings 17,588 --
Monitoring Component A1
- Mandatory monthly reporting Yes Yes
No – exempt under Addendum No – exempt under Addendum
- Characterize commercial bait fishery III because landings are < 5% of III because landings are < 5% of
coastwide total coastwide total
Monitoring Component A2
- Biomedical reporting Not Applicable Not Applicable
- Required information for biomedical
Not Applicable Not Applicable
use of crabs
Monitoring Component A3
Yes Yes
Identify spawning and nursery habitat
Yes, VT Trawl Survey will be
Monitoring Component B1 Yes, VT Trawl Survey was conducted in 2020 & 2021;
Coastwide benthic trawl survey conducted in 2019 future years and spatial scope
unknown at this time
Monitoring Component B2
Continue existing benthic sampling Yes Yes
programs
Monitoring Component B3 Yes, since 1999 (methods differ
Yes
Implement spawning survey from DE Bay survey)
Yes, in collaboration with local
Monitoring Component B4
universities (Sacred Heart Yes
Tagging program
University since 2015)
18NEW YORK
2019 Compliance 2020 Management Proposal
De minimis status Did not qualify for de miminis Does not qualify for de miminis
Bait Harvest Restrictions and Landings
- ASMFC Quota 366,272 366,272
(Voluntary State Quota) (150,000) (150,000)
Ability to close areas to harvest; Ability to close areas to harvest;
- Other Restrictions seasonal quotas and daily seasonal quotas and daily
harvest limits harvest limits
- Landings 167,181 --
Monitoring Component A1
- Mandatory monthly reporting Yes Yes
- Characterize commercial bait fishery Yes Yes
Monitoring Component A2
- Biomedical reporting Not Applicable Not Applicable
- Required information for biomedical
Not Applicable Not Applicable
use of crabs
Monitoring Component A3
Yes Yes
Identify spawning and nursery habitat
Yes, VT Trawl Survey will be
Monitoring Component B1 Yes, VT Trawl Survey was conducted in 2020 & 2021;
Coastwide benthic trawl survey conducted in 2019 future years and spatial scope
unknown at this time
Monitoring Component B2
Continue existing benthic sampling Yes Yes
programs
Monitoring Component B3 Yes – adapted from DE Bay
Yes
Implement spawning survey survey
Monitoring Component B4
Yes Yes
Tagging program
19NEW JERSEY
2019 Compliance 2020 Management Proposal
Qualifies but not requesting de
De minimis status Qualified for de miminis
miminis
Bait Harvest Restrictions and Landings
- ASMFC Quota 162,136 [male only] 162,136 [male only]
(Voluntary state quota) (0) (0)
- Other Restrictions Bait harvest moratorium Bait harvest moratorium
- Landings 0 --
Monitoring Component A1
- Mandatory monthly reporting N/A N/A
- Characterize commercial bait fishery N/A N/A
Monitoring Component A2
- Biomedical reporting Yes Yes
- Required information for biomedical
Yes Yes
use of crabs
Monitoring Component A3
Yes Yes
Identify spawning and nursery habitat
Yes, VT Trawl Survey will be
Monitoring Component B1 Yes, VT Trawl Survey was conducted in 2020 & 2021;
Coastwide benthic trawl survey conducted in 2019 future years and spatial scope
unknown at this time
Monitoring Component B2
Continue existing benthic sampling Yes Yes
programs
Monitoring Component B3
Yes Yes
Implement spawning survey
Monitoring Component B4 Outside, independent groups
No
Tagging program currently
Monitoring Component B5 Yes, but removed as a
Yes
Egg abundance survey mandatory component
Monitoring Component B6
Yes Yes
Shorebird monitoring program
20DELAWARE
2019 Compliance 2020 Management Proposal
De minimis status Did not qualify for de miminis Does not qualify for de miminis
Bait Harvest Restrictions and Landings
- ASMFC Quota 162,136 [male only] 162,136 [male only]
(Adjusted Quota from Overage) 159,211 [male only] 157,122 [male only]
Closed season (January 1 – June
Closed season (January 1 – June
- Other Restrictions 7); season closed early on June
7)
16
- Landings 164,225 males --
Monitoring Component A1
Yes (daily call-in reports &
- Mandatory monthly reporting Yes
monthly logbooks)
- Characterize commercial bait fishery Yes Yes
Monitoring Component A2
- Biomedical reporting Not Applicable Not Applicable
- Required information for biomedical
Not Applicable Not Applicable
use of crabs
Monitoring Component A3 Yes –updates once every 5 Yes – updates once every 5
Identify spawning and nursery habitat years or as needed years or as needed
Yes, VT Trawl Survey will be
Monitoring Component B1 Yes, VT Trawl Survey was conducted in 2020 & 2021;
Coastwide benthic trawl survey conducted in 2019 future years and spatial scope
unknown at this time
Monitoring Component B2
Continue existing benthic sampling Yes Yes
programs
Monitoring Component B3
Yes Yes
Implement spawning survey
No state program but has
Monitoring Component B4 assisted in the past with various
No
Tagging program Delaware Bay horseshoe crab
tagging initiatives
Monitoring Component B5
Removed as component Removed as component
Egg abundance survey
Monitoring Component B6
Yes Yes
Shorebird monitoring program
Note: The egg abundance survey has been discontinued as a mandatory monitoring element. Delaware will
include information on the survey if it continues, but is no longer required to perform the survey.
21MARYLAND
2019 Compliance 2020 Management Proposal
De minimis status Did not qualify for de miminis Does not qualify for de miminis
Bait Harvest Restrictions and Landings
- ASMFC Quota 255,980 (male only) 255,980 (male only)
Delayed harvest and closed Delayed harvest and closed
- Other Restrictions
season/area combinations season/area combinations
- Landings 145,907 males --
Monitoring Component A1
Yes (weekly reports for permit Yes (weekly reports for permit
- Mandatory monthly reporting holders; monthly for non- holders; monthly for non-
permit holders) permit holders)
- Characterize commercial bait fishery Yes Yes
Monitoring Component A2
- Biomedical reporting Yes Yes
- Required information for biomedical
Yes Yes
use of crabs
Monitoring Component A3
Yes Yes
Identify spawning and nursery habitat
Yes, VT Trawl Survey will be
Monitoring Component B1 Yes, VT Trawl Survey was conducted in 2020 & 2021;
Coastwide benthic trawl survey conducted in 2019 future years and spatial scope
unknown at this time
Monitoring Component B2
Continue existing benthic sampling Yes Yes
programs
Monitoring Component B3
Yes Yes
Implement spawning survey
Monitoring Component B4
Yes – through biomedical use Yes – through biomedical use
Tagging program
22POTOMAC RIVER FISHERIES COMMISSION
2019 Compliance 2020 Management Proposal
De minimis status granted in De minimis requested and
De minimis status
2019. meets criteria.
- Ability to close fishery if de minimis
threshold is reached
- Daily possession limitVIRGINIA
2019 Compliance 2020 Management Proposal
De minimis status Did not qualify for de miminis Does not qualify for de miminis
Bait Harvest Restrictions and Landings
172,828 172,828
- ASMFC Quota
(81,331 male-only east of (81,331 male-only east of
COLREGS line) COLREGS line)
Closed season (January 1 – June Closed season (January 1 – June
7) for federal waters. Effective 7) for federal waters. Effective
January 1, 2013 harvest of January 1, 2013 harvest of
- Other Restrictions horseshoe crabs, from east of horseshoe crabs, from east of
the COLREGS line, is limited to the COLREGS line, is limited to
trawl gear and dredge gear trawl gear and dredge gear
only. only.
151,727
- Landings --
(100,609 males)
Monitoring Component A1
Yes – new permit system;
- Mandatory monthly reporting limited entry to fishery and Yes
individual quotas established
- Characterize commercial bait fishery Yes Yes
Monitoring Component A2
- Biomedical reporting Yes Yes
- Required information for biomedical
Yes Yes
use of crabs
Monitoring Component A3
Yes – completed No
Identify spawning and nursery habitat
Yes, VT Trawl Survey will be
Monitoring Component B1 Yes, VT Trawl Survey was conducted in 2020 & 2021;
Coastwide benthic trawl survey conducted in 2019 future years and spatial scope
unknown at this time
Monitoring Component B2
Continue existing benthic sampling No No
programs
Monitoring Component B3
No No
Implement spawning survey
Monitoring Component B4
No No
Tagging program
24NORTH CAROLINA
2019 Compliance 2020 Management Proposal
De minimis status Did not qualify for de miminis Does not qualify for de minimis
Bait Harvest Restrictions and Landings
- ASMFC Quota 24,036 24,036
Trip limit of 50 crabs; Trip limit of 50 crabs;
- Other Restrictions Proclamation authority to Proclamation authority to
adjust trip limits, seasons, etc. adjust trip limits, seasons, etc.
- Landings 13,463 --
Monitoring Component A1
Yes – trip level reporting each Yes – trip level reporting each
- Mandatory monthly reporting
month month
- Characterize commercial bait fishery Yes Yes
Monitoring Component A2
- Biomedical reporting Not Applicable Not Applicable
- Required information for biomedical
Not Applicable Not Applicable
use of crabs
Little information available;
Monitoring Component A3 Survey discontinued after 2002
Not specified
Identify spawning and nursery habitat and 2003 due to low levels of
crabs recorded
Yes, VT Trawl Survey will be
Monitoring Component B1 Yes, VT Trawl Survey was conducted in 2020 & 2021;
Coastwide benthic trawl survey conducted in 2019 future years and spatial scope
unknown at this time
Monitoring Component B2
Continue existing benthic sampling Yes Yes
programs
Monitoring Component B3
No No
Implement spawning survey
Monitoring Component B4
No No
Tagging program
25SOUTH CAROLINA
2019 Compliance 2020 Management Proposal
De minimis status granted in De minimis requested for 2020
De minimis status
2019. and meets criteria.
- Ability to close fishery if de minimis
threshold is reached
- Daily possession limitGEORGIA
2019 Compliance 2020 Management Proposal
De minimis status granted in De minimis requested for 2020
De minimis status
2019. and meets criteria.
- Ability to close fishery if de minimis
Yes Yes
threshold is reached
- Daily possession limitFLORIDA
2019 Compliance 2020 Management Proposal
De minimis status granted in De minimis requested for 2019
De minimis status
2018. and meets criteria.
- Ability to close fishery if de minimis
Yes Yes
threshold is reached
25/person w/ valid saltwater 25/person w/ valid saltwater
- Daily possession limitYou can also read