Assessing tumor heterogeneity: integrating tissue and circulating tumor DNA (ctDNA) analysis in the era of immuno-oncology - blood TMB is not the ...
←
→
Page content transcription
If your browser does not render page correctly, please read the page content below
Open access Review
J Immunother Cancer: first published as 10.1136/jitc-2021-002551 on 30 August 2021. Downloaded from http://jitc.bmj.com/ on November 1, 2021 by guest. Protected by copyright.
Assessing tumor heterogeneity:
integrating tissue and circulating tumor
DNA (ctDNA) analysis in the era of
immuno-oncology - blood TMB is not
the same as tissue TMB
Stanislav Fridland ,1 Jaeyoun Choi,1 Myungwoo Nam,1
Samuel Joseph Schellenberg,1 Eugene Kim,1 Grace Lee,2 Nathaniel Yoon,2
Young Kwang Chae1,3
To cite: Fridland S, Choi J, ABSTRACT mutational landscape of a tumor, especially
Nam M, et al. Assessing tumor Tissue tumor mutational burden (tTMB) is calculated to when metastases are present.5 Some metas-
heterogeneity: integrating tissue aid in cancer treatment selection. High tTMB predicts a
and circulating tumor DNA
tases may not even be visible radiographically
favorable response to immunotherapy in patients with and thus cannot be evaluated. To compensate
(ctDNA) analysis in the era of
non-small cell lung cancer. Blood TMB (bTMB) from for this, clinicians have begun assessing blood
immuno-oncology - blood TMB
circulating tumor DNA is reported to have similar predictive
is not the same as tissue TMB. TMB (bTMB) from circulating tumor DNA
Journal for ImmunoTherapy power and has been proposed as an alternative to tTMB.
Across many studies not only are tTMB and bTMB not
(ctDNA).6 Necrotic and apoptotic tumors
of Cancer 2021;9:e002551.
doi:10.1136/jitc-2021-002551 concordant but also as reported previously by our group shed their DNA into circulation.7 By moni-
predict conflicting outcomes. This implies that bTMB is not toring this cell-free circulating DNA (cfDNA),
Accepted 12 July 2021 a substitute for tTMB, but rather a composite index that we can less invasively assess the tumor muta-
may encompass tumor heterogeneity. Here, we provide a tional landscape.8
thorough overview of the predictive power of TMB, discuss Upwards of 94% of all mutations can be
the use of tumor heterogeneity alongside TMB to predict detected in both blood and tissue, with a
treatment response and review several methods of tumor small percentage of mutations found in one
heterogeneity assessment. Furthermore, we propose a and not the other.9 However, bTMB does not
hypothetical method of estimating tumor heterogeneity
yield the same predictions as tTMB. Among
and touch on its clinical implications.
patients treated with immune checkpoint
inhibitors, high bTMB values were correlated
INTRODUCTION with shorter PFS and OS6. In another work,
Tumor mutational burden (TMB) is a clini- the DCR rates between bTMB- High and
cally approved and frequently used biomarker bTMB- Low groups showed no statistically
in the context of immunotherapy. Tissue significant difference.10 Consequently, tTMB
© Author(s) (or their TMB (tTMB), the total number of muta- and bTMB do not appear to be equivalent.
employer(s)) 2021. Re-use tions per exome, is associated with tumor Furthermore, the small percentage of discor-
permitted under CC BY-NC. No neoantigen load.1 Neoantigens arising from dant mutations may carry a predictive power.
commercial re-use. See rights Mutations, single nucleotide variations, can
and permissions. Published by
tumor-specific mutations can elicit a robust
BMJ. immune response which is strongly associated be classified as clonal or subclonal. A collec-
1
Northwestern University with clinical outcome.2 3 A strong correlation tion of these mutations can be used to quan-
Feinberg School of Medicine, between high tTMB and clinical outcomes— tify tumor heterogeneity, which has illustrated
Chicago, Illinois, USA progression-free survival (PFS) and overall predictive power in preclinical settings.11 In
2
Northwestern University, survival (OS)—has been observed in patients one study, 92% of tumors that exhibited low
Evanston, Illinois, USA heterogeneity (low neoantigen subclonal frac-
3
Robert H. Lurie Comprehensive
with non- small cell lung cancer (NSCLC)
Cancer Center of Northwestern receiving immunotherapy. In contrast, inter- tion) and high TMB demonstrated durable
University, Northwestern mediate and low tTMB values correlate with a clinical benefit with anti-PD-1 (Programmed
University Feinberg School of lower durable clinical response (DCR) rate.4 cell death protein 1) therapy.12 Furthermore,
Medicine, Chicago, Illinois, USA Tissue biopsy, a requirement for measuring high tumor heterogeneity has been observed
Correspondence to tTMB, is invasive and can be impossible to in patients with colorectal cancer with lower
Dr Young Kwang Chae; perform in many cases. More importantly, disease-free survival and higher rates of
young.chae@n orthwestern.edu single biopsies do not capture the entire metastases.13 A highly heterogeneous breast
Fridland S, et al. J Immunother Cancer 2021;9:e002551. doi:10.1136/jitc-2021-002551 1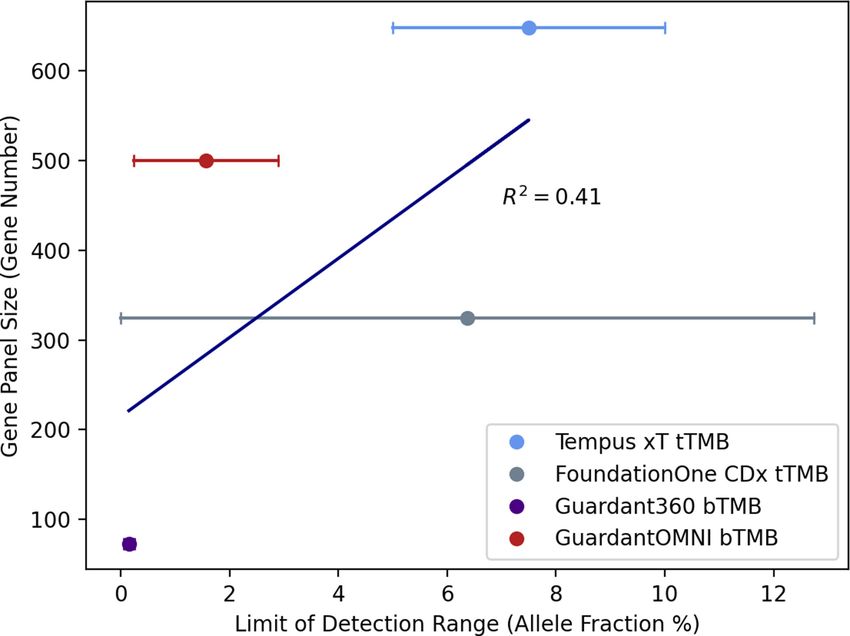
Open access
J Immunother Cancer: first published as 10.1136/jitc-2021-002551 on 30 August 2021. Downloaded from http://jitc.bmj.com/ on November 1, 2021 by guest. Protected by copyright.
cancer cohort exhibited lower levels of tumor infiltrate, in melanoma the rate was 19%.1 When used in conjunc-
decreased immune responses, and worse outcome.14 tion, they are very effective in stratifying patients. Out of
It has become increasingly clear that there is value in 22 patients with MSI high colorectal carcinoma, 13 were
complementing tTMB with other metrics such as bTMB tTMB high and 100% of them responded to immuno-
and tumor heterogeneity. Several approaches to measure therapy. In contrast, 66% of the patients with low tTMB
tumor heterogeneity have been developed and vali- had progressive disease. More importantly, the median
dated. As of this writing, no methods have successfully PFS had not been reached for the tTMB high group after
integrated tTMB, bTMB, and their respective clonality 18 months, while the median PFS for the tTMB low group
and subclonality characteristics. A thorough analysis of was 2 months.18 The relationship between MSI and TMB
current methods and our own proposed new method may is of ongoing research interest.
lead to better tumor lineage tracking, earlier detection of The sequencing methodology used to obtain the raw data
resistance-causing mutations, and more effective clinical is an important consideration. Whole exome sequencing
decision-making.15 (WES) selects for long stretches of DNA, covering mostly
exons, with some introns and intergenic regions. The use
of gene panels is an alternative approach that targets a
SINGLE BIOPSY TISSUE-BASED TMB list of genes ranging in number from the low 100s all the
Over the relatively short period of time during which way to 1000. The third and final method is whole genome
immunotherapies have been used, neoantigen burden sequencing (WGS). In this case, all available DNA frag-
has become strongly associated with treatment outcome. ments in the sample are sequenced, capturing inter-
To estimate this burden, single biopsy tTMB is routinely exonic regions. Despite this advantage the high cost and
used. In evaluating a commercial United States Food and high material requirements of WGS makes it unlikely to
Drug Administration (FDA) approved assay for tTMB be utilized clinically. Most importantly, less costly alterna-
(Oncomine Tumor Mutational Load assay), Alborelli et tives like gene panels and WES can be used to effectively
al4 observed a statistically significant relationship between measure clinically relevant biomarkers such as TMB and
tTMB and outcome metrics. Patients (n=76) experiencing neoantigen load. In comparing the performance of WGS
durable clinical benefit (stable disease for >6 months) with a small gene panel, TMB high colon cancer tumors
had a median tTMB=8.5 mut/Mb, while those with no showed a 100% concordance for important tumor driver
durable benefit had a median tTMB=5 mut/Mb (Dunn’s genes, such as BRAF, KRAS, and NRAS.19 Furthermore,
test p=0.018). Grouping patients based on a tTMB cut-off tTMB values derived from WES and three commercial
of 9 mut/Mb yielded a similar relationship. Patients with gene panels (OCAv3 0.39Mbp, TST170 0.53Mbp, OTML
a tTMB≥9 mut/Mb had a median PFS of 16.4 months, 1.7Mbp) yielded a strong correlation (0.77, 0.84, and 0.9
while their tTMB 20 mut/Mb) responded Biopsies are invasive and can only be performed on acces-
positively versus only 22% of patients with low tTMB sible tumors of the appropriate size. Additionally, several
responded positively. Furthermore, the median PFS of studies have shown that a single biopsy does not capture
these two groups was 12.8 versus 3.3 months, respectively, the entire tumor landscape. In evaluating four patients
a fourfold difference. For 102 patients within this same with renal cell carcinoma via multiregion biopsy, only 55%
cohort who received anti- PD-1/PD- L1 (Programmed of all mutations present within the tumor were detected
death ligand 1) monotherapy, there was a linear correla- by a single biopsy. Additionally, only 34% of all mutations
tion between tTMB and response likelihood: 4% for low were shared by every biopsy, indicating that most muta-
(1–5 mut/Mb), 26% for intermediate (6–19 mut/Mb), tions cannot be detected by a single biopsy.5 This effect
45% for high (20–50 mut/Mb), and 67% for very high has also been observed for tTMB in a study comparing
(>50 mut/Mb).16 To bring out further utility from TMB, the correlation between single and multiregion tTMB.
clinicians have attempted to use it alongside microsatel- The authors show that additional biopsies lead to statis-
lite instability (MSI). tically significant fold changes in tTMB, although tTMB
MSI is determined by measuring the addition or stops changing beyond three biopsies.21 One biopsy does
removal of nucleotides from microsatellite tracks. In not capture the mutational state of the tumor. However,
the context of immunotherapy, MSI has been shown to an additional two biopsies may be enough.
predict treatment outcome, especially when mismatch
repair mutations are considered.17 Even though both
MSI and tTMB have predictive value, they are not the PLASMA CTDNA AS AN ADDITIONAL BIOPSY
same. Among 11 348 different cancer indications, only Liquid biopsy can add another data point to comple-
1.5% were positive for tTMB and MSI, while specifically ment situations in which the opportunity for tissue biopsy
2 Fridland S, et al. J Immunother Cancer 2021;9:e002551. doi:10.1136/jitc-2021-002551Open access
J Immunother Cancer: first published as 10.1136/jitc-2021-002551 on 30 August 2021. Downloaded from http://jitc.bmj.com/ on November 1, 2021 by guest. Protected by copyright.
is limited. Blood draws are routine and non- invasive, Concordance between tTMB and bTMB is of primary
making them ideal procedures for disease monitoring research importance. Are bTMB and tTMB the same?
and treatment assessment. Such applications of liquid Within a 29 NSCLC patient cohort, tTMB and bTMB were
biopsy are still in development, and the research has correlated: the Pearson r=0.47 for stage I-II patients and
been promising. The presence and abundance of ctDNA 0.58 for stage III-IV patients. Interestingly, single region
has been associated with clinical outcome. In the context tTMB and multi region tTMB had a stronger correlation
of breast cancer, recurrence after stages I and II treat- (r=0.94). This implies that bTMB and tTMB may not
ment was exclusively associated with the detection of convey the same mutational information and most likely
chromosome 1q23.1 amplification.22 Generally, ctDNA are not equivalent.21 This observation is further substan-
levels tend to be associated with tumor burden and may tiated by a study of 20 patients with NSCLC receiving
be used to track tumor progression. Pre- surgical and immune checkpoint inhibitors. Within this cohort, higher
post-surgical ctDNA levels in patients with NSCLC were bTMB individuals had shorter PFS (45 vs 355 days) and
correlated with outcome. The mutation frequency also OS (106 days and not reached).29 In other works, a high
declined from 8.88% to 0.28%, with the largest declines bTMB did not associate with a favorable OS, regardless of
observed in stage I patients.23 Beyond total ctDNA levels, the bTMB cut-off that was chosen.30
tracking bTMB during treatment has also shown clin- In studying the concordance between tTMB and bTMB
ical value. Wang et al describe the significant response it is important to acknowledge the technical differences
experienced by a patient with metastatic breast cancer between tTMB and bTMB assays. Among four commonly
to a combination therapy of camrelizumab and vinorel- used assays FoundationOne CDx31 and Tempus xT32 for
bine. During therapy plasma ctDNA was monitored and tTMB and Guardant36033 and GuardantOMNI34 for bTMB
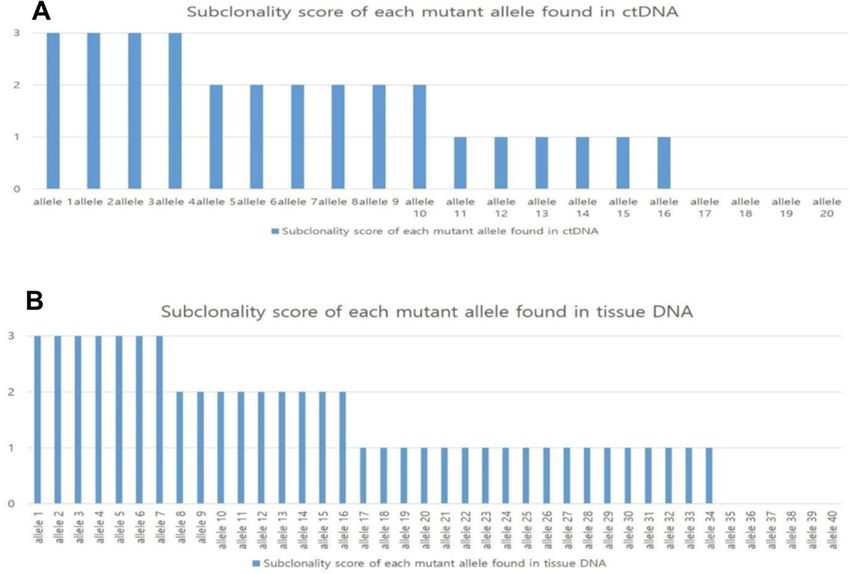
bTMB levels declined from 149.2 to 40.88 mut/Mb and there is variability between both gene panel size and allele
the patient experienced 5 months of PFS, prior to which fraction percentage limit of detection (LOD) (figure 1).
they had not shown response to any other treatment.24 There appears to be a weak correlation between panel
In a smaller cohort of six patients with NSCLC a similar size and limits of detection with an R2=0.41. The bTMB
trend was observed. After 4 weeks of chemoradiotherapy assays generally had a much narrower LOD range then
bTMB decreased significantly as compared with pretreat- their tTMB counterparts. Individual assay differences in
ment levels.25 Of four additional patients with NSCLC, the DNA extraction methods, sequencing library prepara-
only one presented with a significant increase in bTMB, tion, sequencing parameters, and raw data processing are
mutation frequency, and overall cell-free DNA levels. This all sources of bias that may play a significant role in the
was consistent with disease progression and confirmed level of concordance observed between bTMB and tTMB.
Furthermore, individual studies and clinical trials choose
radiographically.26
vastly different tTMB and bTMB cut- offs. One study
Changes in allele frequency of specific mutations
assessed the performance of an FDA approved tTMB
in response to treatment may yield significant clinical
cut-off of 10 mut/Mb in a metastatic colorectal cohort.
relevance. An increase in allele frequency was observed
They found that a 10 mut/Mb cut-off was not predictive
for an activating mutation in PIK3CA after paclitaxel, a
of outcome, while a cut-off of 4.1 mut/Mb was predictive.
truncating mutation in RB1 after cisplatin, a truncating
For this same cohort the established bTMB cut-off was
mutation in MED1 after tamoxifen and trastuzumab, and
28 mut/Mb illustrating the vast difference between the
a treatment resistance mutation in EGFR after gefitinib.8
cut-offs for tissue and blood.35 Generally, most research
As with tTMB, the same three sequencing methodolo-
papers studying the relationship between TMB and
gies—gene panel, WES, and WGS—have been applied to
outcome will select the TMB cut-off that yields the most
ctDNA. WGS has been successfully utilized to study the
statistically significant difference between groups.
relationship between PFS/OS and molecular progres-
sion (increase in ctDNA)/major molecular response
(decrease in ctDNA).27 Both WES and gene panels lend CLONES, SUBCLONES, AND TUMOR HETEROGENEITY
equally well to bTMB calculation at the 1021 gene level A widely accepted and verified explanation for the
with Pearson r values ranging from 0.85 to 0.91 depending inequivalence between tTMB and bTMB currently eludes
on indication.21 investigators. One possibility is that bTMB may be an
index that captures more than just mutational burden.
Concordance between bTMB and tTMB To investigate their previous finding that OS was not asso-
Given the convenience of ctDNA, bTMB calculation has ciated with bTMB, Wang et al28 adjusted his bTMB calcu-
been readily performed and its predictive value studied. lation for POPLAR,36 an open-label phase 2 randomly
Wang et al observed a strong association between bTMB controlled advanced NSCLC patient trial, and OAK,37
and PFS in a 34 NSCLC patient cohort treated with immu- an open- label phase 3 randomly controlled advanced
notherapy. PFS was significantly longer for patients with NSCLC patient trial, and a national cancer center cohort.
high bTMB (14.5 months) than their lower bTMB coun- Mutations with an allele frequency >5% were classified as
terparts (5.2 months). However, the more important high allele frequency (HAF), while the rest as low allele
metric, OS, was not associated with bTMB whatsoever.28 frequency (LAF). HAF- bTMB was strongly correlated
Fridland S, et al. J Immunother Cancer 2021;9:e002551. doi:10.1136/jitc-2021-002551 3Open access
J Immunother Cancer: first published as 10.1136/jitc-2021-002551 on 30 August 2021. Downloaded from http://jitc.bmj.com/ on November 1, 2021 by guest. Protected by copyright.
Figure 1 Comparison of gene panel size and limits of detection for four different TMB assays. Each point on the plot
represents gene panel size in terms of the number of genes covered by each assay and the mean allele fraction percentage
limit of detection. The horizontal lines represent the range of the limit of detection of all alterations. Alterations include
single nucleotide variations, Copy Number Variation (CNV), Inserted and/or deleted nucleotides (InDels), and changes in
homopolymeric regions. The horizontal lines represent the range of the limit.
with total ctDNA and thus was not associated with positive With more accurate predictive tools, clinicians can more
outcomes. While LAF-bTMB was not associated with total effectively predict treatment outcome by distinguishing
ctDNA. Additionally, LAF-bTMB-High was found to be between treatment sensitive homogenous cancers and
associated with favorable OS, PFS, and overall response heterogenous cancers capable of harboring treatment
rate (ORR).30 resistant subclones. Such an approach could minimize
Liu et al38 proposed that bTMB carries two types of the number of patients receiving treatments from which
bias. The first is called the big tumor burden effect: a they are unlikely to benefit.
larger tumor will shed more cells, resulting in higher In preclinical studies, tumor heterogeneity had a signifi-
amounts of ctDNA. The second is tumor heterogeneity: cant impact on tumor growth rates regardless of tTMB. At
low frequency mutations represent minor subclones. the center of the study are UVB-irradiated melanoma cells,
Mutations present at high and low allele frequencies which exhibit higher levels of tTMB than their parental
from larger tumors and minor subclones, respectively, counterparts. These UVB-irradiated cells had on average
may obscure the true bTMB value. On removing both 2734 more exonic mutations. In mice, cell clones with lower
confounding factors, a new bTMB value was calculated heterogeneity grew at significantly lower rates than both
for POPLAR and OAK cohorts. Patients treated with the original parental strain and the UVB-irradiated strain,
immunotherapy who had a high bTMB exhibited better regardless of tTMB (tTMB ranged from 3600 to 16 977
PFS, OS, and ORR prediction as compared with the Wang somatic mutations).11 These experiments imply that high
et al28 original bTMB calculations. This may imply that the tumor heterogeneity drives tumor growth and aggressive-
original bTMB values resulted in several bTMB high false ness, irrespective of mutational burden. In this experiment,
positives, which in the clinic would have received immu- tumor heterogeneity was measured via allele frequency, one
notherapy to no avail.38 While it is clear that patients with of several methods currently utilized in research.
a large tumor burden generally have a worse prognosis,
patients who exhibit high levels of tumor heterogeneity TUMOR HETEROGENEITY METHOD COMPARISON
via their subclonal LAF mutations are currently not strati- Assessing tumor heterogeneity has most commonly been
fied in clinical practice. accomplished by quantifying the frequency of different
4 Fridland S, et al. J Immunother Cancer 2021;9:e002551. doi:10.1136/jitc-2021-002551Open access
J Immunother Cancer: first published as 10.1136/jitc-2021-002551 on 30 August 2021. Downloaded from http://jitc.bmj.com/ on November 1, 2021 by guest. Protected by copyright.
Table 1 Tumor heterogeneity methods compared
Method Summary Input data type Output Publication Tissue/blood
40
PyClone Allele read counts .tsv file containing Clusters Roth et al ctDNA and tDNA
->cellular prevalence variant allele
estimation frequency and
copy number
variability
SciClone Like PyClone, but takes .tsv file containing Clusters Miller et al44 tDNA
a narrow selection of variant allele
genes (copy number frequency, copy
neutral and loss of number variability,
heterozygosity free) and common LOH
site to exclude
AFH VAF/MSAF VAF and MSAF AFH Score Liu et al47 ctDNA and tDNA
MATH Width of the VAF VAF MATH Score Mroz and Rocco48 tDNA
distribution
Shannon’s Diversity The negative sum of VAF Diversity Index Oh et al53 tDNA
Index the natural log of the Score
probability distribution
of VAF for all mutated
loci within a sample.
N
∑
H′ = − pi In pi
i=1
AFH, allele frequency heterogeneity; ctDNA, circulating tumor DNA; LOH, loss of heterogeneity; MATH, mutant allele tumor heterogeneity;
MSAF, maximum somatic allele frequency; tDNA, tumor DNA; VAF, variant allele frequency.
alleles across key genes, their copy numbers, and low heterogeneity counterparts (60 weeks). Further-
sequencing depth. The diverse algorithms that have been more, multivariate analysis showed that poor PFS was
developed and validated have their respective advantages associated with high heterogeneity (p=0.02), second
and disadvantages. A selection of these methodologies only to the type of therapy received (pyrotinib alone vs
are summarized in table 1. Additionally, a computa- pyrotinib +chemotherapy).41
tional comparison of some of these methods has been PyClone has also been applied to understanding the rela-
performed by Abécassis et al.39 tionship between tumor heterogeneity and neoantigen
burden. High neoantigen NSCLC tumors as measured
by a bioinformatics pipeline tend to be composed of
PYCLONE
cells that share a greater number of mutations; in other
PyClone, a Bayesian statistical model, is designed to estab-
words, they are more homogenous. These types of tumors
lish a cluster architecture from ctDNA data. It uses allelic
were associated with longer PFS. In a second cohort of
frequencies, read depth, and copy number variation to
64 patients with melanoma, a similar relationship was
estimate the size of the cell population that carries a
observed; there was an improved OS in tumors with a low
given mutation. If several mutations are present at the
same cell population size, then they are considered clus- tumor heterogeneity and a high neoantigen burden.12
tered. Cluster number and size can then be used as an PyClone has been utilized as a primary metric of intra-
estimation of the number of clones within a sample, in tumor heterogeneity in TCGA (The Cancer Genome
other words, heterogeneity. This approach relies on two Atlas) pan- cancer studies. PyClone enabled Morris et
assumptions about clonal populations. One, that they al to investigate the clonal landscape of nine different
are perfect, meaning no single mutation occurs more cancer indications, head and neck squamous carcinoma
than once and that for each mutation there is only one (HNSC), urothelial bladder carcinoma, breast invasive
somatic genotype. Two, that they are persistent, meaning carcinoma (BRCA), kidney renal clear cell carcinoma
that mutations do not revert to their somatic genotype. (KIRC), low-grade glioma (LGG), lung adenocarcinoma,
With these limitations in mind, PyClone has been used as lung squamous cell carcinoma, prostatic adenocarci-
a general way of assessing tumor heterogeneity in several noma (PRAD), and skin cutaneous melanoma. They were
studies.40 able to show that for five of the nine indications (HNSC,
Patients with highly heterogeneous breast cancer BRCA, KIRC, LGG, and PRAD) PyClone had a statistically
(>3 mutation clusters as determined via PyClone) had significant relationship with outcome. Most interestingly,
significantly shorter median PFS (30 weeks) versus their immune infiltration was inversely proportional to the
Fridland S, et al. J Immunother Cancer 2021;9:e002551. doi:10.1136/jitc-2021-002551 5Open access
J Immunother Cancer: first published as 10.1136/jitc-2021-002551 on 30 August 2021. Downloaded from http://jitc.bmj.com/ on November 1, 2021 by guest. Protected by copyright.
clone number calculated by PyClone. The authors surmise significant response experience by a patient to a combi-
that the heterogeneity captured by PyClone may be an nation therapy of camrelizumab and vinorelbine. During
indicator of a tumor’s ability to escape immune surveil- therapy plasma ctDNA was monitored, not only did bTMB
lance, a factor that must be considered during treatment levels decline from 149.2 to 40.88 mut/Mb but also large
selection.42 Building on this work, Dentro et al compared fluctuations in clonal clusters were observed via SciClone.
the performance of PyClone with other clustering-based This suggested to the clinicians that the immunotherapy
methodologies. They found that PyClone output relative was effective in targeting specific clones. Unfortunately,
similarity ranged from 0.5 to 0.81 across 10 methods. the patient did experience progressive disease after 5
When compared with consensus methods PyClone rela- months of being progression-free. This study is one of the
tive similarities ranging from 0.76 to 0.78, across three first to make active use of SciClone as a treatment moni-
methods. Differences in performance are expected due toring tool.24
to the many assumptions that each method makes during
data processing. Ultimately, it is clear that PyClone has
become a mainstay of intratumor heterogeneity measure- ALLELE FREQUENCY HETEROGENEITY
ment studies running from small cohorts all the way to Allele frequency heterogeneity (AFH) is a simpler
large pan-cancer analyses.43 approach which yields a score rather than a set of clusters.
It uses the abundance of low frequency alleles as an indi-
cator of high or low heterogeneity. Allele frequency (AF)
SCICLONE can be defined as the number of reads for a given mutant
A variation of PyClone, SciClone was recently developed at a specified position divided by the total number of reads
to provide higher confidence heterogeneity assessment. for that position. Maximum somatic allele frequency
This approach takes a narrower range of loci as input. (MSAF) represents the allele frequency of the somatic
Specifically, these genes come from copy number neutral mutant for a given position. The ratio of AF to MSAF
and loss of heterozygosity free portions of the genome. can have a wide range of values. A cut-off value must be
The intention is to provide a higher confidence measure chosen for this metric to be useful. For example, in prior
of variable allele frequency (VAF). VAFs are subsequently work a cut-off value of 10% or 0.1 was chosen. Whether
clustered using a variational Bayesian mixture model. a sample is above or below this cut-off dictates its allele
During validation, SciClone was able to interrogate a fraction heterogeneity status. Consequently, a sample’s
cluster architecture in both pre and post treatment heterogeneity can be determined in this binary way.47
samples from Acute Myeloid Leukemia (AML) and breast Although AFH has seen limited use it has been applied
cohorts. In both samples, it was able to illustrate which to two well studied cohorts. Applying AFH to (POPLAR
clusters responded to treatment and thus were no longer and OAK), the presence of AFH (AF/MSAFOpen access
J Immunother Cancer: first published as 10.1136/jitc-2021-002551 on 30 August 2021. Downloaded from http://jitc.bmj.com/ on November 1, 2021 by guest. Protected by copyright.
more the low fraction alleles are present within a tumor distribution for each across all the loci, yielding a score/
sample, thus capturing heterogeneity.48 index. A numerical representation of this calculation can
MATH was initially applied to a HNSC cohort of 74 be found in table 1. In applying this index to a colorectal
patients. This metric was associated with three poor cancer cohort, it was observed that stage I-III patients with
outcome classes of HNSC: tumors with disruptive TP53 high SDI exhibited a shorter PFS. In stage IV patients,
mutations, tumors negative for HPV (Human Papilloma- this association was not observed, most likely because at
virus), and smokers who were negative for HPV. Although the metastatic phase other factors play a more significant
this cohort was small, the relationship between MATH role. A similar result was obtained for a breast cancer
and outcome warrants more investigation.49 Extending cohort.53 High SDI has also been shown to be associated
MATH to a 305 patient TCGA HNSC cohort not only with poor prognostic biomarkers such as prostate specific
confirmed an association with known prognostic factors membrane antigen in prostate cancer.54 Another study
(clinical stage, HPV status, TP53 mutation, extent of illustrated a relationship between SDI and adverse patho-
Copy Number Alterations (CNAs), and mutational load) logic features in breast cancer tumors. These features
but also showed that higher MATH scores were inde- include high histologic grade, lymphovascular invasion,
pendently associated with decreased OS.50 p53 overexpression, high Ki-67 index, and negative HR.55
Furthermore, the value of MATH as a predictive score
was validated in other indications. A seven patient 409
gene panel colon cancer cohort from the UNM Cancer CALCULATING A SUBCLONALITY SCORE
Center Human Tissue Repository showed an association As discussed above, mutations found in blood and tissue
between MATH score and tumor stage. Additionally, stage can differ significantly. Thus, heterogeneity measured
II individuals who later went on to develop metastasis had via ctDNA and tissue DNA cannot be directly compared.
higher MATH scores (p=0.025) than stage II individuals More importantly, we believe that it is the detection and
who did not develop metastasis. Per the author’s sugges- quantification of subclonal mutations that determines
tions, stage II individuals with high MATH scores may be how heterogeneous a tumor is. The effectiveness of this
ideal candidates for additional treatment and at the very approach relies on our ability to determine if a given
least more aggressive screening.51 Another group applied mutation is subclonal.
MATH to a TCGA colorectal cancer cohort of 79 patients. We propose a hypothetical index called the Tumor
As a further confirmation of the work of previous groups, Heterogeneity Index (THI) that we believe may be able
in this cohort higher MATH scores were associated with to quantify heterogeneity by more constantly differenti-
advanced stage and lymph node metastasis. Post neoad- ating between clonal and subclonal mutations. First, we
juvant chemoradiation treatment samples in five of seven must score each mutation. In our initial iteration we focus
patients showed higher MATH scores than their pretreat- on three mutation conditions (table 2). Although we
ment counterparts (41.7 vs 28.8, p=0.04).52 ascribe one point to each condition, during future vali-
MATH was used in studying a breast cancer cohort. dation studies we expect that to optimize this approach
MATH scores were dichotomized based on cut-offs that the weight of each condition will need to be carefully
yielded statistically significant differences in survival. considered.
High MATH tumors were associated with worse OS, less Once all mutated loci have been scored, we then calcu-
antitumor CD8 and CD4 T cell infiltration, more immune late the fraction of all alleles that have a score greater than
suppressing regulatory T cells, and generally lower cyto- or equal to 2. We call this ratio the THI. By performing
lytic activity.14 this calculation for both tissue and blood samples, we
obtain tissue THI (tTHI) (figure 2B) and blood THI
(bTHI) (figure 2A), respectively. The mean of these two
SHANNON’S DIVERSITY INDEX values we call the composite THI (cTHI).56
Shannon’s Diversity Index (SDI) takes VAFs of a given set Subclonality scores and indexes like cTHI may act as
of mutated loci and sums the natural log of the probability another tool in effectively predicting outcome. In addi-
tion to being used on its own, this metric can be coupled
with others. Much the same as allele frequency cut-offs
Table 2 Scoring matrix were used by Liu et al,38 subclonality can be used along-
Assigned side TMB to minimize bias. Although this approach
Condition point value needs to be validated, it does open the door for further
Is this mutation not present in the highest 1 investigation.
frequency cluster as determined by PyClone?
Is the AF/MSAF ratio for this mutationOpen access
J Immunother Cancer: first published as 10.1136/jitc-2021-002551 on 30 August 2021. Downloaded from http://jitc.bmj.com/ on November 1, 2021 by guest. Protected by copyright.
Figure 2 Hypothetical distribution of alleles. (A) Hypothetical distribution of all alleles found in ctDNA, blood Tumor
Heterogeneity Index (bTHI) = the number of alleles with a subclonality score greater than or equal to 2/the total number of alleles
found in ctDNA=10/20=50%. (B) Hypothetical distribution of all alleles found in tissue DNA, tissue Tumor Heterogeneity Index
(tTHI) = the number of alleles with a subclonality score greater than or equal to 2/the total number of alleles found in tissue
DNA=16/40=40%. Thus, the composite THI for these two samples is 45%. ctDNA, circulating tumor DNA.
parts of the same tumor are inherently variable. The same Biodesix, Immuneoncia, Lilly Oncology, Merck, Takeda, Pfizer, Tempus, Lunit, Jazz
is true for blood samples obtained before, during, and Pharmaceuticals. All other authors have nothing to disclose.
after treatment. All these observations make it difficult to Patient consent for publication Not required.
accurately capture the mutational landscape of a tumor Provenance and peer review Not commissioned; externally peer reviewed.
within a given patient. However, considering both tumor Open access This is an open access article distributed in accordance with the
and blood biopsy and generating a score based on the Creative Commons Attribution Non Commercial (CC BY-NC 4.0) license, which
permits others to distribute, remix, adapt, build upon this work non-commercially,
presence and frequency of certain mutations, we believe and license their derivative works on different terms, provided the original work is
that a more accurate index can be calculated. The cTHI properly cited, appropriate credit is given, any changes made indicated, and the use
is one example of such an index, which can be used on its is non-commercial. See http://creativecommons.org/licenses/by-nc/4.0/.
own and in conjunction with other metrics. The next step ORCID iD
is to test and validate the value of cTHI on both publicly Stanislav Fridland http://orcid.org/0000-0001-7200-7154
and privately available data sets. This is crucial for the
field of precision medicine to move forward and become
a more accurate and effective means of improving treat- REFERENCES
ment outcomes. 1 Vanderwalde A, Spetzler D, Xiao N, et al. Microsatellite instability
status determined by next-generation sequencing and compared
with PD-L1 and tumor mutational burden in 11,348 patients. Cancer
Acknowledgements We would like to thank all the authors involved and Med 2018;7:746–56.
Northwestern University for providing access to necessary journal and reference 2 Schumacher TN, Schreiber RD. Neoantigens in cancer
materials. immunotherapy. Science 2015;348:69–74.
3 Thorsson V, Gibbs DL, Brown SD, et al. The immune landscape of
Contributors Conception and design: SF, JC, MN, YKC; Administrative support: cancer. Immunity 2018;48:e14:812–30.
All authors; Provision of study materials: SF, JC, MN, YKC; Manuscript writing: SF; 4 Alborelli I, Leonards K, Rothschild SI, et al. Tumor mutational
Manuscript editing: All authors; Final approval of manuscript: All authors. burden assessed by targeted NGS predicts clinical benefit from
immune checkpoint inhibitors in non-small cell lung cancer. J Pathol
Funding The authors have not declared a specific grant for this research from any 2020;250:ii59.
funding agency in the public, commercial or not-for-profit sectors. 5 Gerlinger M, Rowan AJ, Horswell S, et al. Intratumor heterogeneity
and branched evolution revealed by multiregion sequencing. N Engl
Competing interests YKC would like to disclose research grants from AbbVie, J Med 2012;366:883–92.
BMS, Biodesix, Lexent Bio, and Freenome. He also has/had honoraria/advisory 6 Davis AA, Chae YK, Agte S, et al. Comparison of tumor mutational
board roles for Roche/Genentech, BMS, AstraZeneca, Merck, Foundation burden (TMB) across tumor tissue and circulating tumor DNA
Medicine, Counsyl, Neogenomics, Guardant Health, Boehringer Ingelheim, (ctDNA). JCO 2017;35:e23028.
8 Fridland S, et al. J Immunother Cancer 2021;9:e002551. doi:10.1136/jitc-2021-002551Open access
J Immunother Cancer: first published as 10.1136/jitc-2021-002551 on 30 August 2021. Downloaded from http://jitc.bmj.com/ on November 1, 2021 by guest. Protected by copyright.
7 Jahr S, Hentze H, Englisch S, et al. Dna fragments in the blood 32 Tempus xT (V3) validation. Available: https://www.tempus.com/wp-
plasma of cancer patients: quantitations and evidence for their origin content/uploads/2020/02/xTv3-Validation_010920-1.pdf [Accessed
from apoptotic and necrotic cells. Cancer Res 2001;61:1659–65. 08 May 2021].
8 Murtaza M, Dawson SJ, Tsui DW. Non-Invasive analysis of acquired 33 The Guardant 360 assay. Available: https://www.therapyselect.
resistance to cancer therapy by sequencing of plasma DNA. Annals de/sites/default/files/downloads/guardant360/guardant360_
of Oncology 2014;25:iv36. specification-sheet_en.pdf [Accessed 08 May 2021].
9 Chae YK, Davis AA, Carneiro BA, et al. Concordance between 34 Helman E, Artieri C, Vowles JV. Abstract 5603: analytical validation
genomic alterations assessed by next-generation sequencing of a comprehensive 500-gene ctDNA panel designed for immuno-
in tumor tissue or circulating cell-free DNA. Oncotarget oncology and DNA damage research. Clin Res 2018.
2016;7:65364–73. 35 Loree JM, Topham JT, Kennecke HF, et al. Tissue and plasma tumor
10 Fang W, Ma Y, Yin JC, et al. Combinatorial assessment of ctDNA mutation burden (TMB) as predictive biomarkers in the CO.26 trial
release and mutational burden predicts anti-PD(L)1 therapy outcome of durvalumab + tremelimumab (D+T) versus best supportive care
in nonsmall-cell lung cancer. Clin Transl Med 2020;10:331–6. (BSC) in metastatic colorectal cancer (mCRC). JCO 2021;39:61.
11 Wolf Y, Bartok O, Patkar S, et al. Uvb-Induced tumor heterogeneity 36 Fehrenbacher L, Spira A, Ballinger M, et al. Atezolizumab versus
diminishes immune response in melanoma. Cell 2019;179:219-235. docetaxel for patients with previously treated non-small-cell lung
e21. cancer (poplar): a multicentre, open-label, phase 2 randomised
12 McGranahan N, Furness AJS, Rosenthal R, et al. Clonal neoantigens controlled trial. Lancet 2016;387:1837–46.
elicit T cell immunoreactivity and sensitivity to immune checkpoint 37 Rittmeyer A, Barlesi F, Waterkamp D, et al. Atezolizumab versus
blockade. Science 2016;351:1463–9. docetaxel in patients with previously treated non-small-cell lung
13 Joung J-G, Oh BY, Hong HK, et al. Tumor heterogeneity predicts cancer (oak): a phase 3, open-label, multicentre randomised
metastatic potential in colorectal cancer. Clin Cancer Res controlled trial. Lancet 2017;389:255–65.
2017;23:7209–16. 38 Liu Z, Xie Z, Cai X, et al. A modified algorithm adjusting both high
14 McDonald K-A, Kawaguchi T, Qi Q, et al. Tumor heterogeneity and minor allele frequency mutation to redefine blood-based
correlates with less immune response and worse survival in breast tumor mutational burden (bTMB) for optimal prediction of clinical
cancer patients. Ann Surg Oncol 2019;26:2191–9. benefits from immune checkpoint inhibitor therapy. J Thorac Oncol
15 Swanton C. Intratumor heterogeneity: evolution through space and 2020;15:e69-e72.
time. Cancer Res 2012;72:4875–82. 39 Abécassis J, Hamy A-S, Laurent C, et al. Assessing reliability of
16 Goodman AM, Kato S, Bazhenova L, et al. Tumor mutational burden intra-tumor heterogeneity estimates from single sample whole exome
as an independent predictor of response to immunotherapy in sequencing data. PLoS One 2019;14:e0224143.
diverse cancers. Mol Cancer Ther 2017;16:2598–608. 40 Roth A, Khattra J, Yap D, et al. PyClone: statistical inference of clonal
17 Sahin IH, Akce M, Alese O, et al. Immune checkpoint inhibitors for population structure in cancer. Nat Methods 2014;11:396–8.
the treatment of MSI-H/MMR-D colorectal cancer and a perspective 41 Ma F, Guan Y, Yi Z, et al. Assessing tumor heterogeneity using ctDNA
on resistance mechanisms. Br J Cancer 2019;121:809–18. to predict and monitor therapeutic response in metastatic breast
18 Schrock AB, Ouyang C, Sandhu J, et al. Tumor mutational burden is cancer. Int J Cancer 2020;146:1359–68.
predictive of response to immune checkpoint inhibitors in MSI-high 42 Morris LGT, Riaz N, Desrichard A, et al. Pan-Cancer analysis of
metastatic colorectal cancer. Ann Oncol 2019;30:1096–103. intratumor heterogeneity as a prognostic determinant of survival.
19 Echejoh G, Liu Y, Chung-Faye G, et al. Validity of whole genomes Oncotarget 2016;7:10051–63.
sequencing results in neoplasms in precision medicine. J Clin Pathol 43 Dentro SC, Leshchiner I, Haase K, et al. Characterizing genetic
: 2020. doi:10.1136/jclinpath-2020-206998. [Epub ahead of print: 29 intra-tumor heterogeneity across 2,658 human cancer genomes. Cell
Oct 2020]. 2021;184:2239-2254.e39.
20 Endris V, Buchhalter I, Allgäuer M, et al. Measurement of tumor 44 Miller CA, White BS, Dees ND, et al. SciClone: inferring clonal
mutational burden (TMB) in routine molecular diagnostics: in silico architecture and tracking the spatial and temporal patterns of tumor
and real‐life analysis of three larger gene panels. Int J Cancer evolution. PLoS Comput Biol 2014;10:e1003665.
2019;372. 45 Hardiman KM, Ulintz PJ, Kuick RD, et al. Intra-Tumor genetic
21 Zhang Y, Fang W, Yang Y, et al. P102 the correlations of tumor heterogeneity in rectal cancer. Lab Invest 2016;96:4–15.
mutational burden among Single-region tissue, Multi-region tissues 46 Li X, Kumar S, Harmanci A, et al. Whole-Genome sequencing of
and blood in NSCLC. J Thorac Oncol 2018;13:S1085. phenotypically distinct inflammatory breast cancers reveals similar
22 Goh JY, Feng M, Wang W, et al. Chromosome 1q21.3 amplification genomic alterations to non-inflammatory breast cancers. Genome
is a trackable biomarker and actionable target for breast cancer Med 2021;13:70.
recurrence. Nat Med 2017;23:1319–30. 47 Liu Z, Xie Z, Zhao S, et al. Presence of allele frequency heterogeneity
23 Guo N, Lou F, Ma Y, et al. Circulating tumor DNA detection in lung defined by ctDNA profiling predicts unfavorable overall survival of
cancer patients before and after surgery. Sci Rep 2016;6:33519. NSCLC. Transl Lung Cancer Res 2019;8:1045–50.
24 Wang R, Yang Y, Ye W-W, et al. Case report: significant response to 48 Mroz EA, Rocco JW. Math, a novel measure of intratumor genetic
immune checkpoint inhibitor camrelizumab in a heavily pretreated heterogeneity, is high in poor-outcome classes of head and neck
advanced ER+/HER2− breast cancer patient with high tumor squamous cell carcinoma. Oral Oncol 2013;49:211–5.
mutational burden. Front Oncol 2021;10. 49 Mroz EA, Tward AD, Pickering CR, et al. High intratumor genetic
25 Yang X, Zhu Z. Blood-based TMB detection and dynamic monitor in heterogeneity is related to worse outcome in patients with head and
local advanced non-small cell lung cancer (NSCLC) patients. JCO neck squamous cell carcinoma. Cancer 2013;119:3034–42.
2019;37:e20039. 50 Mroz EA, Tward AD, Tward AM, Hammon RJ, et al. Intra-tumor
26 Friedlaender A, Nouspikel T, Christinat Y, et al. Tissue-plasma TMB genetic heterogeneity and mortality in head and neck cancer:
comparison and plasma TMB monitoring in patients with metastatic analysis of data from the cancer genome atlas. PLoS Med
non-small cell lung cancer receiving immune checkpoint inhibitors. 2015;12:e1001786.
Front Oncol 2020;10:142. 51 Rajput A, Bocklage T, Greenbaum A, et al. Mutant-allele tumor
27 Davis AA, Iams WT, Chan D. Early assessment of molecular heterogeneity scores correlate with risk of metastases in colon
progression and response by whole-genome circulating tumor DNA cancer. Clin Colorectal Cancer 2017;16:e165–70.
in advanced solid tumors. Mol Cancer Ther. 2019. 52 Bettoni F, Masotti C, Corrêa BR. The effects of neoadjuvant
28 Wang Z, Duan J, Cai S, et al. Assessment of blood tumor mutational chemoradiation in locally advanced rectal cancer—the impact in
burden as a potential biomarker for immunotherapy in patients with intratumoral heterogeneity. Frontiers in Oncology 2019;9.
non-small cell lung cancer with use of a next-generation sequencing 53 Oh BY, Shin H-T, Yun JW, et al. Intratumor heterogeneity inferred
cancer gene panel. JAMA Oncol 2019;5:696. from targeted deep sequencing as a prognostic indicator. Sci Rep
29 Chae YK, Davis AA, Agte S, et al. Clinical implications of circulating 2019;9:4542.
tumor DNA tumor mutational burden (ctDNA TMB) in non-small cell 54 Paschalis A, Sheehan B, Riisnaes R, et al. Prostate-specific
lung cancer. Oncologist 2019;24:820–8. membrane antigen heterogeneity and DNA repair defects in prostate
30 Wang Z, Duan J, Wang G, et al. Allele Frequency-Adjusted Blood- cancer. Eur Urol 2019;76:469–78.
Based Tumor Mutational Burden as a Predictor of Overall Survival for 55 Chung YR, Kim HJ, Kim YA, et al. Diversity index as a novel
Patients With NSCLC Treated With PD-(L)1 Inhibitors. J Thorac Oncol prognostic factor in breast cancer. Oncotarget 2017;8:97114–26.
2020;15:556–67. 56 Choi J, Nam M, Fridland S, et al. 18 New method of assessing tumor
31 FoundationOne_CDx_Label_Technical_Info. Available: https://info. heterogeneity utilizing both circulating tumor DNA and tissue DNA
foundationmedicine.com/hubfs/FMI Labels/FoundationOne_CDx_ to predict the response to immunotherapy. J Immunother Cancer
Label_Technical_Info.pdf [Accessed 08 May 2021]. 2020;8:A18.
Fridland S, et al. J Immunother Cancer 2021;9:e002551. doi:10.1136/jitc-2021-002551 9You can also read