Assessing Namibia's performance two decades after independence Part II: Sectoral analysis
←
→
Page content transcription
If your browser does not render page correctly, please read the page content below
Journal of Namibian Studies, 11 (2012): 29 – 61

       Assessing Namibia’s performance two decades after
                         independence
                   Part II: Sectoral analysis
                                        Thomas Christiansen

                                               Abstract
      This paper presents the second part of a review of Namibia's performance since
      independence in March 1990. The first part of this review served as an introduction
      to the topic, summarised the historical background and assessed Namibia's overall
      performance on the basis of the results of the Mo-Ibrahim-Index of Good Governance.
      This second part looks in more detail at three main development sectors: political and
      civil society development, economic development, and social development. Based on
      the findings of both articles, this review concludes here with a final overall evaluation
      of Namibia's performance since 1990.

Introduction
This article presents the second and final part of a study, the first part of which was
published in Vol. 10 of the Journal of Namibian Studies.1 The overall objective of the
project is a holistic review of Namibia’s development since its independence on 21
March 1990 and a fair and balanced assessment of its achievements and failures. The
first part served as an introduction to the topic and summarised the methodical
difficulties in measuring the performance of a country objectively and evaluating its
development from a historical and a regional perspective.2
Part 1 summarised Namibia’s relatively favourable point of departure in 1990 when the
country finally prevailed over the South African apartheid regime after a long and bloody
struggle for independence. The analysis showed that in comparison with other states
Namibia – despite some serious development constraints – had of a number of
advantages, both economically and politically. It also pointed out that in the aftermath of
the first free elections in 1989, the country enjoyed the “goodwill of virtually every other
country in the world”, which manifested itself in extremely generous development

1 Thomas Christiansen, “Assessing Namibia’s Performance two Decades after Independence. Part 1: Initial
position, external support, regional comparison", Journal of Namibian Studies, 10, 2011: 31-53.
2 The term ‘historical perspective’ refers to the almost 23 years since independence, while ‘regional per-

spective’ refers to a check of Namibia’s achievements against those of its neighbour countries in Southern
Africa.
funding from the international donor community.3 Finally, Part 1 analysed in detail Namibia’s overall performance, based on the results of the Mo-Ibrahim Index of Good Governance. The Namibian results were impressive. In the first ‘good governance’ ranking of all African countries in year 2000, Namibia achieved an impressive 6th place in Africa which corresponded to Rank 3 in Southern Africa. Namibia defended both ranks in all subsequent years. Hence, Part 1 concluded that Namibia has done relatively well if the country’s development is assessed from an overall perspective and checked against the ‘good governance’ achievements of its neighbouring countries. This second part of the article goes into more detail. It looks more closely at three main development sectors, namely political and civil society development, the economic development and, finally, Namibia’s social and socio-economic development. Based on a combined evaluation of the results of Parts 1 and 2, the paper concludes with a final overall appraisal of Namibia’s achievements and failures and the lessons learned for the future development of the country.4 Political and civil society development Of the three development sectors to be examined in the following, development in political and civil society is the area where the appraisal is most likely to be subjective. Economic and social / socio-economic developments can be assessed on the basis of ‘hard’ statistical data such as GDP per capita, export / import figures, unemployment and inflation rate etc. Political performance and the development of civil society are more complex and more difficult to assess, because achievements are ‘soft’ and consequently difficult to measure objectively. Moreover, a performance assessment in this field is, at least to a certain extent, bound to be biased by the evaluator's personal expectations, hopes and fears. Hence, the evaluation of the same facts may well result in quite different conclusions, depending on the evaluators perspective and expectations. Critical observers of Namibia’s development such as Henning Melber blame various shortcomings and failings on Namibian politics with good reason.5 Melber rightly points out that the ruling SWAPO party is intolerant of deviating political opinions and of other 3 Robin Sherbourne, Robin, Guide to the Namibian Economy 2010, Windhoek, Institute for Public Policy Research, 2010: 8. 4 Parts of the findings in this article have already been presented as a series of six German newspaper articles in the Allgemeine Zeitung Windhoek on the occasion of Namibia’s Independence Day in March 2012, cf. Thomas Christiansen, “Hat Namibia seine Chancen genutzt? Eine Bilanz”, Allgemeine Zeitung, 19.03.2012 (Teil 1), 28.03.2012 (Teil 2), 29.03.2012 (Teil 3), 13.04.2012 (Teil 4a), 16.04.2012 (Teil 4b), 26.04.2012 (Teil 5). 5 See Henning Melber’s recurrent critical appraisals of Namibia’s political development, for example: “The Culture of Politics", in: Henning Melber, (ed.), Namibia: A Decade of Independence 1990-2000, Windhoek, NEPRU, 2000: 165-190; “Namibia: A Trust Betrayed – Again?”, Review of African Political Economy, 38 (127), March 2011: 103-111; “Namibia’s National Assembly and Presidential Elections 2009: Did Democracy Win?”, Journal of Contemporary African Studies, 28 (2), 2010: 203-14. 30
political parties. According to Melber and other authors, SWAPO has not yet accepted
that in a democracy the governing political party has a merely temporary mandate and
that no political party can consider itself and the state/government as one and the
same, no matter what that party has done for the country in the past. SWAPO’s
somewhat pre-democratic understanding of its role in a post-colonial society is
illustrated by the following statement of Sam Nujoma, Namibia’s first president:
             As future leaders of your country, you should act [...] to always promote the
             interests of the SWAPO Party and the national interests before your own. It is
             only through that manner that the SWAPO Party will grow from strength to
             strength and continue to rule Namibia for the next ONE THOUSAND YEARS.6
Another major criticism is that the ruling SWAPO party missed the opportunity for
comprehensive national reconciliation. Its leading politicians did not show the courage to
initiate a public discourse on SWAPO’s own human right violations during the liberation
struggle.7 The Caprivi rebellion in 1999 was also handled poorly and involved further
human rights violations. Even now – almost 14 years after the uprising – dozens of
secessionists remain in custody without having been legally convicted while their trial
continues to drag on.8
Finally, there are numerous examples of the negative impact of two decades of one-
party rule. Cases of incompetence, mismanagement and corruption in public institutions
and particularly in many of the numerous parastatals regularly make headlines in the
press. Many of the roughly 60 Namibian parastatals are notorious for their lack of
organisation, poor management and appalling customer service, as well as for frequent
labour disputes, strikes, and corruption. Among the worst are NBC (Namibia Broad-
casting Corporation), Air Namibia, GIPF (Government Institutions Pension Fund), Trans-
Namib (the national railway), and NAMPA (the Namibia News Agency).9
Among the government institutions the Ministry of Home Affairs, the Ministry of Finance
and the Ministry of Education in particular are regularly accused of inefficiency and poor
customer service.10 There are, of course, exceptions to the rule. In particular the Bank of

6 Quoted from a speech of Sam Nujoma in 2010 in which he addressed the SWAPO Youth League, quoted in

Melber, “Namibia: A Trust”: 103 (capitalization by Melber).
7 See Melber, “Culture”: 171.

8 Cf. Henning Melber, “One Namibia, One Nation? The Caprivi as Contested Territory”, Journal of

Contemporary African Studies, 27 (4), 2009: 463-481; Marc Springer, “Caprivi-Aufstand erschüttert Frieden
und Stabilität”, Allgemeine Zeitung, Sonderpublikation 20 Jahre Unabhängigkeit Namibia, 19.03.2010.
9 See for example Marc Springer, “Staatsbetriebe im Zwielicht”, Allgemeine Zeitung, 01.12.2011; idem,

“NBC leistet Offenbarungseid”, Allgemeine Zeitung, 27.07.2011; Eberhard Hofmann, “Ungehörige
Freibriefe”, Allgemeine Zeitung, 01.12.2011; idem, “NBC-Saga geht weiter”, Allgemeine Zeitung,
01.12.2011; idem, “Air Namibia zahlt nicht zurück”, Allgemeine Zeitung, 25.10.2011; idem, “Fiskus zahlt
Transnamib-Löhne”, Allgemeine Zeitung, 03.12.2011; Stefan Fischer, “Wir fordern Gerechtigkeit”,
Allgemeine Zeitung, 01.12.2011; Sven Heussen, “Viele Steuergelder für Nampa”, Allgemeine Zeitung,
03.12.2011.
10 Dirk Heinrich, “Bestechlichkeit ein Problem”, Allgemeine Zeitung, 14.12.2011; Eberhard Hofmann, “Sehr

viel Geld, wenig Leistung”, Allgemeine Zeitung, 20.04.2011; idem, “Iyambo geht bis aufs Mark”, Allgemeine

                                                                                                      31
Namibia and the Polytechnic of Namibia have established excellent reputations and the same holds true for NamWater, the national water supply parastatal. However, though Namibia definitely has its deficits, there are also a number of promising developments. Firstly, the young country has enjoyed extraordinary political stability which few people would have predicted at the time of independence in 1990. The country is, of course, dominated by one political party and the lack of political alternatives may well be one of the reasons for some of the country’s problems. On the other hand, the lack of alternatives has resulted in remarkable political and economic stability for more than 20 years, a rare achievement in Africa. This de-facto one-party rule for over two decades is the result of repeated success in five democratic elections. Despite occasional alle- gations of electoral irregularities, not even SWAPO opponents seriously claim that the impressive 74% to 76% of the votes, which SWAPO received in the last four elections, are the result of vote-rigging or that the SWAPO dominance does not represent the political will of a large majority of the population.11 Secondly, the country has managed critical political transition phases very well. The first critical phase, the handover of power from white to black after independence, took place remarkably smoothly and without the feared retaliations against the white minority. Within an amazingly short time a new constitution was developed and enacted, based on a broad consensus of all parties, a constitution which is widely admired as one of the most modern constitutions worldwide.12 A second critical phase was mastered in 2005 when Samuel Nujoma, the Founding Father of the Nation, had to step down as president after three terms in office. Nujoma promoted his favourite confidant Hifikepunye Pohamba as his successor.13 When Pohamba eventually became Namibia's second president, the change in office took place in a remarkably efficient and smooth manner. Once Pohamba had taken over the presidency, he not only reconciled (at least super- ficially) the various factions within SWAPO, but also managed to step out of the long shadow of his predecessor.14 Hence, in November 2009, Pohamba was re-elected for a second term with an overwhelming 75.25 % of the votes, a greater share than the SWAPO party received in the National Assembly elections.15 The preparations for the second smooth handover of the presidency have been taking place recently. During the Zeitung, 03.12.2011; idem, “Weniger Bürokratie, mehr Leistung”, Allgemeine Zeitung, 26.07.2011; idem, “Geständnis und Ansporn”, Allgemeine Zeitung, 26.07.2011. 11 The last four elections the already high 57.3% which SWAPO achieved in the first elections in 1989 has grown. See Ian Cooper, “The Namibian Elections of 2009”, Electoral Studies, 29 (3), 2010: 529-533 (531f.); Melber, “Namibia’s National Assembly”: 207-210. 12 For a detailed discussion see Melber, “Culture”: 166-172. 13 In the run-up to the nomination, Nujoma antagonised several other potential candidates, including Hidipo Hamutenya, the former Minister of Foreign Affairs. As a consequence, Hamutenya later left SWAPO and, in 2007, founded his own political party, the RDP (Rally for Democracy and Progress). For more detailed information, cf. Henning Melber, “Ein Land – zwei Präsidenten? Das erste Jahr des Hifikepunye Pohamba”, Afrika-Süd, 2, 2006: 22-24. 14 Ibid. 15 Cooper, “Namibian Elections”. 32
SWAPO congress in early December 2012, Hage Geingob, Namibia’s former Prime
Minister from 1990 until 2002, was re-elected as SWAPO Vice-President in a trans-
parent and democratic internal election procedure. This positioned him for nomination
as SWAPO’s candidate for presidency in the 2013 elections and thus to become
Pohamba’s successor and Namibia's third president in 2014.16 The fact that Hage
Geingob, not being Ovambo himself, was nominated against two Ovambo competitors
shows substantial political maturity considering that the Ovambo account for almost half
of Namibia’s population.
Looking back at the early years after independence, there are additional achievements
which should be remembered. For example, Namibia successfully managed to assimilate
and integrate into the fledgling state the numerous Namibian repatriates, who had been
scattered all over the world during the years of the independence struggle. Another
major achievement was the peaceful integration of the former PLAN fighters into the
newly formed Namibian Defence Forces. This is a task which has caused huge problems
in many other African countries, and indeed has even led to civil war.17
The progress of Namibia’s nation-building process is another major achievement.
Despite occasional flare-ups of tribalism the majority of the population now sees
themselves as Namibians firstly and only secondly as members of their respective ethnic
group.18 From a white perspective it should also be appreciated that the young state
has been remarkably tolerant towards its colonial heritage. Colonial monuments such as
the Reiterdenkmal were not demolished, as was the case in many other countries in
similar situations and most of street names have been retained, even those commemo-
rating German military leaders during the Herero War.19 Namibia has also been
remarkably cautious on the highly sensitive question of land ownership. Despite the
extremely skewed land distribution and the enormous income inequalities, the SWAPO-
dominated governments have (with very few exceptions) refrained from populist
measures, such as expropriations of farm land or other assets.20

16  For details cf. Shinovene Immanuel and Selma Shipanga, “Moderates Prevail”, The Namibian,
03.12.2012; Stefan Fischer, “Geingob macht das Rennen”, Allgemeine Zeitung, 03.12.2012; idem, “Eine
gute Wahl”, Allgemeine Zeitung, 03.12.2012, idem, “Geingob wieder Premier”, Allgemeine Zeitung,
05.12.2012.
17 In southern Africa the post-colonial history of Angola and Mozambique are cautionary tales of such failed

political transition phases.
18 Cf. Afrobarometer, “Summary of Democracy Indicators, Namibia 1999 – 2008. Popular Attitudes toward

Democracy in Namibia: A Summary of Afrobarometer Indicators, 1999 – 2008”, AfroBarometer, 2009,
http://www.afrobarometer.org.
19 In Munich ‘von-Trotha-Straße’ was renamed in ‘Herero-Straße’, but in Klein-Windhoek a ‘Trotha-Street’

still exists. Considering that von Trotha was the German general who gave the infamous genocide order
during the Herero War, this shows a quite remarkable tolerance.
20 Until March 2010, a total of only five (!) farms were expropriated since independence although § 16 of

the Namibian constitution in principle allows for (legal) land expropriation “in the public interest”, cf.
Eberhard Hofmann, “Landreform: Entscheidungsträger müssen von der Realität ausgehen”, Allgemeine
Zeitung, 26.03.2010.

                                                                                                          33
Another achievement Namibia can be proud of is the development of an impressively multi-faceted, diverse and self-confident civil society landscape, including various trade unions, NGOs, research institutions, think tanks and political foundations. In the absence of effective government control through a functioning parliamentary opposition these institutions of civil society, together with the free press, have taken on an important check and balance function.21 While the weak and poorly organised parliamentary opposition is ineffective as a control mechanism for the executive, institutions such as the Legal Assistance Centre (LAC), the Namibian Institute for Democracy (NID), the Institute for Public Policy Research (IPPR), NamRights, political foundations, the univer- sities, and the trade unions have become the main drivers of the public political discourse.22 A powerful complement to these organisations is the remarkably free press. According to the 2011 ranking of Reporters without Borders, Namibia holds the second best ‘freedom of press’ rank in Africa and an impressive 20th rank in the world, only four places behind Germany. Namibia is ranked far above its neighbours South Africa and Botswana (both on rank 42), Zambia (86), Zimbabwe (117), and Angola (132).23 Quite untypically for a developing country is that not only the press but also high-ranking government officials regularly criticise in a very outspoken way unsatisfactory develop- ments in the country or mismanagement and poor performance in the public sector.24 In other words: In Namibia a spade can be called a spade and this freedom is used exten- sively by the press, civil society and even by high-ranking politicians of the ruling party. This openness also extends to the sensitive topic of corruption in the public sector. In the 2011 Transparency International Report, Namibia’s Corruption Perception Index (CPI) is ranked 53 out of 183 countries with a CPI score of 4.4 out of 10. While at first sight 53rd place may seem unimpressive, it should be remembered that this is the 6th best ranking in Africa, the second best in Southern Africa and is significantly better than the ranking of, for example, Italy and Greece. Namibia’s corruption index is also significantly better than those of all neighbour countries except for Botswana. 21 Eberhard Hofmann, “Land der Anforderung 2012”, Allgemeine Zeitung, 30.12.2012. In the present National Assembly SWAPO holds 60 out 78 seats. Out of these 60 SWAPO mandates, more than 40 are held by members of parliament who simultaneously work as ministers and deputy ministers, thus being part of the executive. It is evident that such a parliament cannot fulfil its constitutional role of controlling the government. 22 For more detailed information see on these organisations and their activities see the internet pages of LAC (http://www.lac.org.na/), NID (http://www.nid.org.na/), NEPRU (http://www.nepru.org.na/), IPPR (http://www.ippr.org.na/), Namrights (http://www.nshr.org.na/). 23 Reporters without Borders, “Rangliste der Pressefreiheit 2011”, http://www.reporter-ohne- grenzen.de/ranglisten/rangliste-2011/?no_cache=1 [26.12.2012]. 24 Cf. for example, Abraham Iyambo’s (former Minster of Education) fervid criticism of the education system in general and his own ministry in particular, cf. Hofmann, “Iyamob”. Also Immanuel Ngatjizeko (Ministry of Labour) cracked down on the civil servants of his own ministry, cf. Eberhard Hofmann, “Miserables Arbeitsjahr beklagt”, Allgemeine Zeitung, 14.12.2011. 34
Table 1: Transparency International Corruption Perception Index 2011

 Rank          Country                   CPI-Score        Remark

1              New Zealand              9.5
2              Denmark                   9.4
3              Finland                   9.4
14             Germany                  8.0
24             USA                       7.1
32             Botswana                 6.1               1st in Africa
41             Cape Verde               5.5               2nd in Africa
48             Mauritius                 5.1              3rd in Africa
49             Rwanda                   5.0               4th in Africa
50             Seychelles                4.8              5th in Africa
57             Czech Republic           4.4
57             Namibia                  4.4               6th rank in Africa, 2nd rank in Southern Africa
57             Saudi Arabia              4.4
64             South Africa             4.1               6th rank in Africa, 3rd rank in Southern Africa
69             Italy                    3.9
80             Greece                   3.4
91             Zambia                   3.2               11th in Africa
154            Zimbabwe                 2.2               35th in Africa
168            Angola                   2.0               42nd in Africa

Source: Own compilation, based on data extracted from Transparency International 2011.25

Moreover, Namibia is one of the few countries which have established a formal anti-
corruption authority, the so-called Anti-Corruption Commission (ACC).26 According to its
director, the ACC received information about 470 possible cases of corruption in 2011
alone. Of these, about 65% turned out to be complaints about poor services provided
by public institutions from discontented citizens, rather than incidents of real corruption

25 Transparency International, “Corruption Perception Index 2011”,
http://cpi.transparency.org/cpi2011/results/ [10.12.2011].
26 The ACC was established in early 2006. In 2011, the organisation disposed of 49 staff members and an

annual budget (2010) of N$ 36.8 million (about € 3.7 million), cf. Ellison Tjirera and Graham Hopwood,
“The ACC in Action. What Does the Track Record Say?”, Anti-Corruption Research Programme Paper 6,
Windhoek, Institute for Public Policy Research (IPPR), 2011:1.

                                                                                                            35
but this still left about 165 cases which the ACC followed up in some way.27 The ACC also conducts public-opinion polls on corruption. According to the results, corruption is still a major issue but has become less of a problem since the establishment of the ACC.28 Apart from the ACC, the press and various NGOs also keep an eye on corruption. In particular the tabloid Informante and the SMS page of the The Namibian expose cases mercilessly.29 It is not only this freedom of the press which is a sign of a free and tolerant society, but other indicators reflect this as well. According to the ‘Freedom Ranking’ of the Namibia Country Profile 2011, Namibia scores a ‘2’ in both, the ‘Political Rights’ and the ‘Civil Liberty’ categories (cf. Table 2). In Africa, only Cape Verde (PR=1/CL=1), Ghana (PR=1, CL=2), and Mauritius (PR=1, CL=2) have better values than Namibia. Table 2: Freedom Ranking (Political Rights and Civil Liberties) 2011 for selected countries Country PR-Value CL-Value Freedom Status Angola 6 5 Not Free Botswana 3 2 Free Germany 1 1 Free Namibia 2 2 Free South Africa 2 2 Free USA 1 1 Free Zambia 3 3 Partly Free Zimbabwe 6 6 Not Free Source: Own compilation, data extracted from the Freedom Ranking Table of the Country Profile Namibia [2011 Edition].30 1 = most free, 7 = least free. The freedom rating reflects overall judgement, based on survey results.31 To summarise, Namibia’s performance in political and civil society development as well as in the field of personal and political freedom is definitely better than many critics 27 Stefan Fischer, “Fast 500 Fälle für die ACC", Allgemeine Zeitung, 10.12.2011. A comprehensive review of the ACC performance is given by a recent IPPR report. For more details see Tjirera and Hopwood, “ACC in Action”. 28 Heinrich, “Bestechlichkeit”. 29 Each issue of the Namibian includes a page with unfiltered short-text messages (SMS) from its readers. Most of these SMS are used to complain about mismanagement and poor service of public sector institutions and to comment in a very outspoken manner on politics and politicians. 30 Denise Youngblood-Coleman, (ed.), Namibia Country Review, Houston, CountryWatch Incorporated, 2011: 37-43. 31 Ibid.: 37. 36
claim. From a domestic Namibian perspective, the negative impression may pre-
dominate, but looking at the country from without and comparing its development
against that of other countries in the region, the positives prevail. The impressive
freedom of the press, the diverse and active civil society and the personal freedom in
general place Namibia among the top countries in Africa in this category.

Economic development
A detailed analysis of the Namibian economy and its development over two decades is
beyond the scope of a country performance review such as this. Moreover, Robin
Sherbourne, Namibia’s leading economist, recently published a comprehensive analysis
of Namibia’s economy.32 Hence, this chapter is not designed to be a complete assess-
ment, but rather a cross-sectional economic overview, providing a big picture rather
than details.
Earlier analyses of Namibia’s economic development were carried out ten years after
independence by a NEPRU Publication Namibia a Decade of Independence, and a similar
study was compiled at about the same time by the International Institute for Applied
System Analysis (IIASA) in cooperation with the University of Namibia.33 Information on
the latest economic developments and regularly updated key indicators can be extracted
from various online databases such the CIA World Factbook and the World Bank
Development Indicators.34 Excellent country profiles on Namibia are available through
the Country Reviews of Country Watch Inc. and monthly country reports by the Economic
Intelligence Unit (EIU) of the British magazine The Economist.35 Finally, various Namibian
think tanks such as the Institute for Public Policy Research (IPPR) and the research
department of the Bank of Namibia regularly publish a wide range of economic reviews
and special purpose studies on various topics.36

Macroeconomic development
Shortly after independence, Namibia’s per capita income was very impressive (about U$
2,200 in 1994), four times higher than the average in sub-Saharan Africa. This meant

32 Sherbourne, Guide.
33 Cf. Henning Melber, (ed.), Namibia: A Decade of Independence, 1990-2000, Windhoek, NEPRU, 2000;
Ben Fuller and Isolde Prommer, (eds.), Population-Development-Environment in Namibia. Background
Readings, Laxenburg, IIASA, 2000.
34 Central Intelligence Agency (CIA), “The World Factbook: Namibia”, https://www.cia.gov/library/

publications/the-world-factbook/geos/wa.html [21.02.2012]; World Bank, “World Bank Development
Indicators”, http://data.worldbank.org/country/namibia [03.02.2012].
35 Youngblood-Coleman, Namibia Country Review ; Economist Intelligence Unit (EIU), “Country Report

Namibia July 2011”, London, EIU, 2011.
36 For details see the homepages of IPPR (http://www.ippr.org.na) and the Bank of Namibia

(https://www.bon.com.na).

                                                                                                     37
that Namibia was categorised among the “lower-middle income countries”.37 Average annual GDP growth rates over the first years were also impressive, but most of the increase was offset by population growth. The per capita income thus remained at more or less the same level for the rest of the first decade.38 Namibia’s economy was characterised by a “dualistic labour market with high unemployment”.39 Both produc- tivity and wages were higher than in the neighbouring countries but productivity declined.40 Namibia was a typical producer and provider of raw materials, with the main export products being diamonds and other minerals, fish, beef, and fruits.41 Between 1990 and 1996, the GDP composition showed some structural changes. The importance of agriculture and the mining sector declined, while the GDP-contribution of fishing, manufacturing, and finance (in particular government services) increased.42 Namibia experienced substantial growth in the tertiary sector while the primary sector’s share declined.43 However, the expansion of the tertiary sector was mainly driven by the expansion of government services (27% of GDP in 1997).44 The contribution of the secondary sector was low (18% in 1991) and decreased even further to 17.5% in 1997.45 Most of the secondary sector GDP-contribution came from the processing of meat and fish, while manufacturing of capital goods was almost non-existent.46 Namibia’s economy was (and still is) closely interlinked with South Africa’s economy. In 1993, 87.1% of the imports came from South Africa, which in turn received only 27.4% of Namibia’s exports. Apart from South Africa, Namibia’s main trade partner was Great Britain which accounted for 34.4% of Namibia’s exports in 1993.47 Hansohm concluded in his study that the “Namibian economy is essentially driven by a large non-tradable sector (government services) and an export-oriented primary sector 37 Dirk Hansohm, “Alternative Paths of Economic Development in Namibia”, in: Ben Fuller and Isolde Prommer, (eds.), Population-Development-Environment in Namibia. Background Readings, Laxenburg, IIASA, 2000: 165-183 (167). 38 Ibid.; Dirk Hansohm, “Macro-Economic Framework”, in: Henning Melber, (ed.), Namibia: A Decade of Independence, 1990 - 2000, Windhoek, NEPRU, 2000: 19-27 (19, 26). 39 Hansohm, “Framework”: 23. “Dualistic” here refers to the fact that Namibia has a formal as well as an informal labour market. 40 Ibid.: 22. 41 Ibid.: 23. 42 Hansohm, “Paths”: 168f., esp. Figure 4. 43 ‘Primary Sector’ refers to primary production, such as agriculture, fishing, forestry and mining. ‘Secon- dary Sector’ refers to manufacturing and product processing (including processing minerals and on-shore processing of fish), construction, and power generation. ‘Tertiary Sector’ includes all ‘services’ such as tourism, transport and logistics and also includes all services provided by the public service (administration, government services etc.). 44 Hansohm, “Framework”: 24. 45 Ibid.: 20f. 46 Hansohm, “Paths”: 169. 47 Ibid.: 171. 38
of fishing, agriculture and mining”.48 In 1994, diamonds (31.4%), other minerals (incl.
uranium 18.8%), and processed and unprocessed fish (27.3%) together accounted for
77.5% of Namibia’s exports. Main import products were food & beverages (24%),
vehicles and transport equipment (17.3%), mineral fuels & lubricants (12.3%),
machinery and electrical goods (11.7%), and chemicals & plastics (8.7%).49 Up until
1999, the export structure did not change much; dependence on the same few products
has intensified. In 1999, diamonds made up 26.0% of the GDP, other minerals (incl.
uranium) accounted for 13.3%, food & live animals for 12.9% and manufactured
products (including most fish exports) for 29.7%. Together these products accounted
for about 85.0% of Namibia’s export.50 Despite its low contribution to the GDP (roughly
10%) agriculture provided the largest number of jobs (around 190,000) by far,
followed by ‘services’ with about 90,000 jobs, mainly in government and civil service
institutions.51
Comparing the employment figures in the different sectors with their respective GDP-
shares, one must conclude that the bulk of the tradable GDP was produced by a small
fraction of the countries workforce.52 Hansohm’s figures and graphs show that in 1996
roughly 50% of Namibia’s GDP was produced by no more than 50,000 people. This
corresponded to a mere 12.5% of the workforce of approximately 400,000 and just
about 3% (!) of the population at that time (about 1.66 million).53 On the other hand,
the 190,000 Namibians working in the agricultural sector produced less than 10% of
the total GDP value. Foreign Direct Investments (FDI) increased considerably after
independence and Hansohm concluded that “Namibia belongs to the success stories in
sub-Saharan Africa”.54 At the end of his review paper Hansohm came to a rather
positive overall conclusion on economic development but emphasised that this positive
development is not sufficient to solve Namibia’s main problems:
               The Namibian economy has shown a growth record over its first decade that is
               impressing compared to both the previous decade and to the average of sub-
               Saharan Africa. However, it remains insufficient to make a substantive dent into
               the heritages of apartheid – poverty and inequality.55
In the same book, Melber investigated “Public Sector and Fiscal Policy” and came to a
much less positive conclusion:

48 Hansohm, “Framework”: 21.
49 Calculated from the sections ‘Principal imports and exports 1994’ of the Table ‘Economic structure:
Namibia’, in: Economist Intelligence Unit (EIU), “Country Report Namibia 1st Quarter 1996”, London, EIU,
1996: 3.
50 Calculated from Table ‘Namibia: current account of the balance of payments’, in: Economist Intelligence

Unit (EIU), “Country Report Namibia July 2000”, London, EIU, 2000: 27.
51 Cf. Hansohm, “Paths”: 168f., Figures 4 and 5.

52 Ibid.

53 World Bank, “World”.

54   Hansohm, “Framework”: 25.
55   Ibid.: 26.

                                                                                                         39
There is plenty of evidence that the new state is continuing to establish itself
everywhere. [...] the public sector is absorbing increasing proportions of
national income and establishing itself as the major employer and consumer in
the economy. [...] At present, about fifty per cent of the government’s annual
budget is spent on employees in the public service. [...] Namibia’s public
service is by all standards blown out of proportion.56
According to Melber, the number of posts in the public service increased by 50% in just
five years, going up from 42,500 in 1990 to 62,500 in October 1995.57 He concluded
that this (largely unproductive) bloating of the civil service is the main reason for the
growth of the tertiary sector and its share of the GDP. However, the most important
economic development in the first decade was the handing over of Walvis Bay by South
Africa to Namibia in 1994. Overnight Namibia had acquired a well equipped and
favourably located deep-water port.58 This not only opened up exciting new possibilities
but also changed the country’s economic centre of gravity and influenced the spatial
distribution of its economy considerably (see Map 1 and 2). Based on the rapid
expansion and upgrading of Walvis Bay harbour, the western coastal region around
Walvis Bay – Swakopmund – Arandis prospered and quickly became Namibia’s second
most important economic centre, a growth process which is still ongoing.59 Lüderitz,
formerly Namibia’s only seaport has lost out as a result of this. At a disadvantage
because of its remoteness from the country’s economic centres, the town rapidly lost its
strategic position as main port to the far more accessible Walvis Bay.
During the second decade after independence, the most important macro-economic
indicators showed further improvements. Figure 1 illustrates that – apart from a short
dip during the global economic crisis in 2009 – the country’s GDP continued to grow
impressively. The inflation-corrected average yearly GDP-growth totalled 4.1 % for the
period 1990 – 2000 and even reached 4.5% for the following decade (2001 – 2012),
resulting in an overall average (1990 – 2012) of 4.3%.60 The figures for the GDP per
capita growth are somewhat lower, but again the second decade was better than the
first: 1.4% for 1990 – 2000, 2.5% for 2001 – 2009, resulting in an overall average of
1.9%.61
56 Henning Melber, “Public Sector and Fiscal Policy”, in: Henning Melber, (ed.), Namibia : A Decade of
Independence 1990-2000, Windhoek, NEPRU, 2000: 87-108 (89).
57 Ibid.
58 Cf. Eberhard Hofmann, “Ohne Schuss gab es einen Territorialzuwachs”, Allgemeine Zeitung,
Sonderpublikation 20 Jahre Unabhängigkeit Namibia, 19.03.2010: 19.
59 See Map 2.
60 Data for 2011 and 2012 are based on estimations (2011) and projections (2012), cf. EIU, “Namibia July
2011”: 15.
61 All per capita data were calculated from estimated population figures, based on projections of the 2001
census results.
40Figure 1: Inflation-corrected yearly GDP growth 1990 – 2012 and GDP per capita growth 1990 –
2009
Source: Compiled from the World Bank Development Indicators database (years 1990 – 2009). The GDP
data for 2010 – 2012 are estimates / forecasts published by the EIU July 2011 Country Report for
Namibia.62
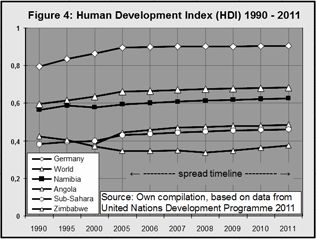
Figure 2: GDP growth 1990 – 2012 in different currencies
Source: Compiled from World Bank Development Indicators database (years 1990 – 2009). GDP data for
2010 – 2012 are estimates / forecasts published by the EIU July 2011 Country Report for Namibia.63 The
indicated Euro data for 2008 – 2012 were calculated using a fixed exchange rate (€ 1 = US$ 1.42).
As illustrated by Figure 2 and Table 3, GDP in Namibia grew from N$ 6.1 billion in 1990
(U$ 2.4 billion) to N$ 92.2 billion (US$ 12.9 billion) in 2010. Though the GDP increased
by a factor of 15 (in N$) or 5.4 (calculated in US$) between 1990 and 2010, the
Namibian economy is still tiny by international standards. The CIA World Factbook
estimated Namibia’s GDP for 2010 at 14.6 billion US$ (about € 10 billion) and ranks the
62 EIU, “Namibia July 2011”; World Bank, “World”.
63 Ibid.
41country at 138th (of 227 countries) in the world.64 To put this in perspective: This is the equivalent of the 2010 net profit of Rio Tinto, one of the largest mining companies and the main shareholder in the Rössing Mine or to the average quarterly net profit of Apple Inc.65 Table 3: GDP 1990 – 2012 (selected years) in different currencies Year 1990 1995 2000 2005 2010 2011 2012 GDP (billion current N$) 6.1 12.7 27.1 46.2 92.2 103.8 114.9 GDP (billion current US$) 2.4 3.5 3.9 7.3 12.9 14.2 14.0 GDP (billion current €) 9.1 10.0 9.9 Source: Compiled from World Bank Development Indicators database (years 1990 – 2009). GDP data for 2010 – 2012 are estimates / forecasts published by the EIU July 2011 Country Report for Namibia. The indicated Euro data for 2008 – 2012 were calculated using a fixed exchange rate (€ 1 = US$ 1.42). Low government spending reduced the inflation rate. During the first decade, the rate still hovered around 10% (average 1990 – 2000: 9.9%), but then fell to an average of 6.6% (2001 – 2012), and even fell to 2 – 3 % some years. Even more impressive is the low level of Namibia’s national debt. The combined total public debt of 14.8% of the GDP in 2009 and 20.1% in 2010 would cause envy in most countries in the world.66 By comparison: According to the CIA World Factbook, in 2011 Germany had a public debt of about 83% of its GDP, Ireland 95%, Italy 119%, Greece 143%, and Japan 200%. By contrast, the World Factbook’s ranking of country debts listed Namibia on place 109 out of 133 countries which is impressive proof of a cautious and moderate public spending practice. Within southern Africa, only Botswana enjoys a higher ranking (rank 110, 19.9% of GDP), while South Africa is ranked 85th (33.4%), Zambia 97th (26.7%), and Angola (despite its high oil revenues) 106th (21.4%). Zimbabwe is again the negative example. With public debt corresponding to 233% of its GDP, Zimbabwe heads the list of the world’s most indebted countries.67 When one considers the macroeconomic key 64 CIA, “Factbook: Namibia”. 65 For details see Rio Tinto, “Rio Tinto Homepage. Shareholders – Financial Results – Annual Results 2010: Press Release 860g”, http://www.riotinto.com/documents/Media/PR860g_Rio_Tinto_annual_results_ 2010.pdf [31.12.2011]. 66 The sharp increase of the public debts from 20% in 2010 to 27% in 2011 and 30% in 2012 is the expected impact of the employment and infrastructure development programme TIPEEG launched in 2011, for details on TIPEEG see National Planning Commission (NPC), Central Bureau of Statistics (CBS), “First Quarter Gross Domestic Product 2011”, Windhoek, NPC, 2011; Sherbourne's Guide to the Namibian Economy gives slightly different but similarly low debt figures, cf. Sherbourne, Guide : 28. 67 See Central Intelligence Agency (CIA), “The World Factbook: Country Comparison Public Debt”, https://www.cia.gov/library/publications/the-world-factbook/rankorder/2186rank.html [21.02.2012]. All figures relate to 2010 estimates. 42
indicators only, one must conclude that Namibia’s economy has seen a rather positive
development over the last 23 years. This is a result of stable political and economic
conditions and of cautious public spending.

Figure 3: Average yearly inflation rate 1991 – 2012 and total public debts (foreign and
domestic)

Source: Own compilation, based on data extracted from various EIU Country Reports for Namibia (January
1996 – July 2011), figures for 2011 and 2012 are estimations or forecasts.68

Sectoral development
As mentioned at the beginning of this chapter, a comprehensive review of the primary,
secondary and tertiary sector is beyond the scope of this paper. The following remarks
will therefore be limited to a summary of the main developments and trends. Looking
back at the general development of the Namibian economy since 1990, one can see
obvious changes but the principal structure of the economy has not changed
substantially. In the primary sector, communal and commercial agriculture still provide
the bulk of employment but contribute little to the country’s GDP. According to surveys
by the Population and Housing Census (PHC) 2001 and the Namibia Labour Force
Survey (NFLS) 2004, between 65,000 and 110,000 people worked in agriculture.69 This
accounts for between 16% and 25% of the current jobs in Namibia, about 400,000 in
total.70 However, agriculture contributes only 5 – 6% to GDP and it grew a meagre

68 Cf. for example EIU, “Namibia July 2011”.
69 Figures quoted by Sherbourne, Guide : 65f. The rather different results in these two surveys are due to
different survey years, the use of different survey standards and different definitions for ‘communal farmer’
and ‘unpaid family worker’.
70 Ibid.: 65.

                                                                                                           43
1.7% per year between 1995 and 2007.71 The development of fishing industry was also
disappointing and has not met expectations. Its contribution to GDP has varied between
4.5% and 7.8% and annual growth was negative in half of the years between 1990 and
2008.72 According to the PHC (2001) and NFLS (2004) surveys, the fishing industry
provides employment for 9,000 (PHC) or 12,600 (NFLS) people, excluding on-shore
fish processing.73
Table 4: Existing and planned uranium mines in Namibia
Name Main Owner(s) Production (Planned) Production until
Capacity (tU/yr) Production Start (estimate)
Rössing Rio Tinto Ltd. (Australia) 4000 1976 2016
Langer Heinrich Paladin Energy 3850 2006 about 2026
(Australia)
Trekkopje Areva (France) 3200 2011 (presently about 2027
put on hold)
Valencia Forsys Metal Corp. 220 2012 (behind about 2030
(Canada) schedule)
Husab Extract Resources / 5700 2014 about 2047
Kalahari Minerals /
Taurus Minerals
(Australia, China)
Marenica Marenica Energy 1350 2014 2027
Omahola (incl. two Deep Yellow (Reptile 960 2014 about 2050
mines: Inca and Uranium) (Australia)
Tumas)
Etango Bannermann Resources 2000 – 2500 2015 about 2035
Ltd. (Australia)
Source: Own compilation, based on data extracted from various uranium internet pages.74
The mining sector with its main products diamonds and uranium oxide (‘yellow cake’)
has done better. Mining was and still is the “main driver of growth in the Namibian
economy”.75 The contribution of mining to GDP varies from year to year between 8%
71 Figures extracted from CIA, “Country Comparison” and Sherbouren, Guide : 79.
72 Cf. Sherbourne, Guide : 105-107. Annual growth figures include on-shore fish processing which actually
belongs to the secondary sector.
73 Ibid.: 68.
74 Information extracted from World Information Service on Energy Uranium Project, “New Uranium Mining
Projects – Namibia”, http://www.wise-uranium.org/upna.html [15.01.2012]; World Nuclear Association,
“Uranium in Namibia”, http://www.world-nuclear.org/info/inf111.html#.Tw4UGQVAmmI.mailto [15.01.2012].
75 Ibid.: 133.
44and 20%, but mining products account (on average) for about half of Namibia’s
exports.76 The numbers employed in the mining sector are low and declined from about
14,000 in 1990 to about 7,600 in 2004.77 With the current expansion of mining
activities in Namibia, in particular uranium mining but also mining for gold, copper and
other minerals, this figure is likely to increase considerably in the near future, and
continue to stay on a high level for the next 15 to 20 years. As mentioned before,
Namibia is on the brink of an enormous uranium rush which is likely to change the face
of the west coast around Walvis Bay / Swakopmund, provided that the numerous
projects, which are currently either in implementation or in planning, are realised. In
addition to the mines ‘Rössing’ and ‘Langer Heinrich’ which are already in operation, up
to seven new uranium mines are being planned or are already under construction
(approximate mine locations see Map 3). According to various internet sources, most of
these new uranium mines will start producing in 2014 or 2015 (see Table 4). However,
the profitability of these planned mines depends directly on the highly volatile world
market price for uranium. Decreasing uranium prices may cause changes or delays to
these projects at short notice.78
In conclusion, one must say that the primary sector has bright and dark sides. While
mining continues to develop rapidly, agricultural production is stagnating and fishing
revenues have not met expectations. The secondary sector is definitely the problem
child of the Namibian economy, although, at first sight, economic indicators seem to
suggest otherwise. With N$ 10.95 billion (about € 1.01 billion) for 2010 and a
projected N$ 11.37 billion (€ 1.05 billion) for 2011, the secondary sector’s contribution
to GDP has overtaken that of the primary sector (N$ 6.47 billion respectively € 0.6
billion for 2010, N$ 6.95 or € 0.64 billion projected for 2011).79 Within the secondary
sector, manufacturing is now the biggest contributor, accounting for N$ 7.53 billion (€
0.7 billion) in 2011 and thus contributing more to GDP than the entire primary sector.
What these aggregated figures do not show is that the bulk of the manufacturing is still
based solely on food processing and beverage production. In 1990, the range of
manufactured goods produced in Namibia (apart from ‘yellow cake’) basically consisted
of beer and processed meat and fish. 23 years later, this extremely narrow range of
products has grown somewhat to include some leather processing, diamond cutting and
more recently cement production.80
76 CIA, “Factbook: Namibia”.
77 Sherbourne, Guide : 68f.
78 For example, the Valencia Mine implementation is behind its original schedule and the Trekkopje Mine,
which had started pilot production in 2011, was recently put on hold as a reaction to the drop in world
market price for uranium, see Wilhelm Leuschner, “Areva exportiert Gestein”, Allgemeine Zeitung,
01.11.2012.
79 Bank of Namibia figures quoted in a newspaper article, cf. Stefan Fischer, Fischer, Stefan, “Wachstum hält
2012 an”, Allgemeine Zeitung, 19.12.2011. A detailed breakdown of the GDP is also given by NPC/CBS,
“First Quarter”.
80 Cf. also Clemens von Alten, “Schlettwein räumt auf", Allgemeine Zeitung, 05.02.2013. In this newspaper
article, Calle Schlettwein, the recently appointed new Minister of Trade, is quoted to have stated that
45“Namibia ist eine koloniale Wirtschaft”(“Namibia is a colonial economy”), depending on “Export von Rohstoffen and Import von Konsumgütern” (“export of raw materials and import of consumer goods”). 46
However, manufacturing of more sophisticated products, such as chemical and pharma-
ceutical goods, electronic components, hard- and software, mechanical engineering

                                                                                47
items, or even shoes and textiles are still virtually non-existent.81 Developments in the building and construction industry, worth N$ 2.13 billion (€ 1.1 billion) in 2011 and the second most important contributor to the secondary sector, have not been positive either.82 The construction business has gradually been taken over by Chinese companies which, if one is to believe the newspaper reports, are awarded most of the important government contracts, often, apparently, under questionable circumstances and in violation of Namibian laws and labour standards.83 However, the greatest deficit in Namibia’s secondary sector is the total failure of its power supply policy. Namibia’s growing energy needs have been a matter of public knowledge for years. A particularly prominent and embarrassing example is the situation surrounding the additional demand to be created by the planned uranium mines, which due to an incomprehensible lack of foresight in planning by NamPower Namibia will not be in a position to meet. Indeed, the country will face severe electricity shortages in the very near future.84 Despite recurrent and insistent warnings from all sides, NamPower, until very recently, ignored entirely the global trend towards solar and wind energy, for which Namibia’s natural environment is ideal and almost unrivalled anywhere else in the world. NamPower has failed utterly to invest in or promote solar and wind energy pro- duction or to encourage energy saving measures. In a harum-scarum last-minute bid to cater for Namibia’s utterly predictable growth in demand for electricity, a large coal power plant near Arandis is now under discussion.85 As in the primary sector, there have also been positive and negative developments in the tertiary sector. Once again the macroeconomic indicators tell only part of the story. An economic review of the last ten years by the 4th National Development Plan (NDP4)86 seems to suggest that the tertiary sector as a whole has developed quite favourably. Over the past five years, the tertiary sector has seen an annual growth rate of 5.4%, which clearly exceeds the GDP growth of 3.6%.87 However, as the NDP4 authors point 81 An attempt by a Malaysian investor group to establish a big textile factory in Windhoek (Ramatex) failed miserably after about two years and ended in an economic, social and ecological disaster; cf. Eberhard Hofmann, “Ramatex im Gericht aufgelöst”, Allgemeine Zeitung, 09.05.2008. 82 Fischer, “Wachstum”. 83 See e.g. Eberhard Hofmann, “Wettbewerb unglaublich verzerrt”, Allgemeine Zeitung, 09.11.2011; idem, “Signale aus Peking”, Allgemeine Zeitung, 11.10.2011. 84 Aurecon Namibia Ltd. (Pty), “Environmental and Socio-Economic Impact Assessment for a Coal-Fired Power Station in the Erongo Region of Namibia. Final Scoping Report”, Windhoek, NamPower, 2012, 28-32, see in particular Fig. 11 and 12 on page 31. 85 For more detailed information see Thomas Christiansen, “Hat Namibia seine Chancen genutzt? Eine Bilanz. Teil 4a / 5 (Wirtschaftliche Entwicklung: Blick Zurück)”, Allgemeine Zeitung, 13.04.2012; Clemens von Alten, “Kohle: Die falsche Entscheidung?”, Allgemeine Zeitung, 09.02.2012; World Information Service on Energy Uranium Project, “Uranium”. 86 Republic of Namibia, “Namibia’s Fourth National Development Plan NDP_4. 2012/13 to 2016/17”, edited by NPD, Office of the President, Windhoek, National Planning Commission, 2012, http://www.npc.gov.na/docs/NDP4_Main_Document.pdf [03.02.2013]. 87 Ibid.: 10. 48
out, the bulk of this growth is attributed to the expansion of the government sector:88
“However, there is concern over the size of the tertiary industries accounted for by the
Government, and the focus should be on private sector contribution to GDP.”89
A country’s wealth, however, grows when production of tradable goods and services is
boosted and not when measures are introduced which merely bloat (non-tradable and
largely unproductive) government services. During the NDP3 phase (2007/8 to 2011/
12) government services expanded by 6.5% per year, almost three times as much as
planned (2.5%). During the same period, the (revenue-producing) sub-sectors ‘tourism’
and ‘transport & communication’ have clearly fallen short of the NDP3 targets.90 On the
other hand, looking beyond the last five years at the entire two decades, the sub-
sectors ‘tourism’ and ‘transport & logistics’ are probably Namibia’s greatest economic
success stories. After becoming independent in 1990, Namibia seized the opportunities
offered by the country’s breath-taking scenery and its natural, cultural and wildlife
attractions, such as Etosha, Sossusvlei, Fish River Canyon, Namib Naukluft, Skeleton
Coast, Kaokoveld, and the Caprivi to name but a few. Within a short space of time
Namibia built up a very professionally run, multifaceted tourism industry and boosted the
number of tourist visits from abroad from 255,000 in 1993 to 984,000 in 2010.91
Tourism now accounts for about 4.4% of the GDP (direct impact) and as much as
20.3% if all indirect effects are considered. This translates into 29,500 direct jobs in
tourism and 116,000 jobs if all indirect impacts of tourism activities are taken into
account. Going by these figures roughly every fourth job in Namibia now depends
directly or indirectly on the tourism sector.92
Despite the fact that it has not met growth expectations recently the transport and
logistics industry is another Namibian success story. The main momentum in this sector
comes from the expansion of Walvis Bay port which is currently being developed as a
freight hub for Namibia’s land-locked neighbours Zambia, Zimbabwe and Botswana.93
Benefitting from its strategically favourable location, which reduces transport time for
vessels to and from Europe and North America, its short turnaround times and the
excellent roads into the hinterland, Walvis Bay has developed into one the most efficient

88 Exactly the same point was stressed already 13 years ago by Hansohm’s economic analysis, cf. “Frame-
work”.
89 Republic of Namibia, “Development Plan”: 13.

90 Cf. ibid.: 12, Table 5.

91 Ministry of Environment and Tourism, “Tourist Statistical Report 2010”, edited by Directorate of Tourism,

Windhoek, 2010: 11. Please note that a considerable part of these ‘tourist arrivals’ are actually not real
tourists. For example, the 2010 figures list 338,000 ‘tourist arrivals’ from Angola and 316,000 from South
Africa. It is evident that many of the Angolans and South Africans are not tourists in the strict sense of the
word, but come for other reasons, such as business, shopping or trade.
92 Figures extracted from World Travel and Tourism Council, “Travel & Tourism. Economic Impact 2012.

Namibia”, London 2012. For additional information see also Christiansen, “Teil 4a / 5”.
93 Cf. Map 1 and 2.

                                                                                                           49
and fastest growing ports in Africa.94 Between 2002 and 2008 the cargo volume grew from 2.3 to 3.95 million tons / year. This corresponds to an average increase of about 11.6% per year and a total increase of 71.7% in six years. At the end of 2011, the port handled about five million tons of cargo per year and still has capacity for an additional two to three million tons.95 Geographical distribution of Namibia’s economy From a geographical perspective Namibian economic development has been relatively evenly spread. While in many developing countries the capital is the dominant (and often only) economic centre, in Namibia three major economic growth poles, complemented by various smaller economic nuclei (see Map 1, 2 and 3) have developed.96 With a cur- rent population of about 350,000 Windhoek is and will remain the country’s most important economic centre, but the most dynamic growth pole is the west coast uranium triangle between Walvis Bay / Swakopmund, Henties Bay, and Arandis. The planned new uranium mines, the off-shore phosphate and potential off-shore oil resources and the plans for a huge chemical plant near Swakopmund and a large coal power plant near Arandis mean that this area is set to become Namibia’s boom region for at least two decades, provided, of course, that all these projects actually become reality. However, it remains to be seen if this hasty and poorly coordinated rush of economic development will (in the long run) be for the better of this region or if it will spoil the regional ecology and tourism industry irreversibly.97 A third, smaller economic growth pole is developing in the so-called Otavi-Triangle between Otavi – Tsumeb – Grootfontein. The main drivers of the economy in this area are the (relatively) favourable conditions for agriculture, mineral processing facilities in Tsumeb, the army base in Grootfontein and the recently opened Ohorongo Cement Plant. Discussions are ongoing on the establishment of a Micro Steel Plant which would further strengthen the economic weight of this region. Conclusion: Economic development Vision 2030, a national, long-term, strategic framework for the country’s future development was approved about ten years ago.98 Vision 2030 defined not only 94 12 to 15 hours for container vessels and 24 to 48 hours for bulk vessels, cf. National Port Authority of Namibia (Namport), Homepage, http://www.namport.com.na [13.01.2012]. 95 All figures extracted from the Namport Homepage, see ibid. and the internet pages of the Walvis Bay Corridor Group (http://www.wbcg.com.na). 96 The three maps are slightly revised and updated versions of the maps presented in Part 1 of this study, see Christiansen, “Assessing”. 97 For more information on this topic see Christiansen, “Teil 4b / 5”; Republic of Namibia, “Strategic Environmental Assessment for the Central Namib Uranium Rush. Main Report”, edited by Ministry of Mines and Energy, Windhoek, Ministry of Mines and Energy in Cooperation with the Federal Institute for Geosciences and Natural Resources (BGR), 2011. 98 Government of Namibia (GoN), Namibia Vision 2030. Policy Document for Long-Term National Develop- ment. Main Document, Windhoek, GoN, Office of the President, 2004. 50
You can also read