Aspen Group - February 2022 - Investor Update - First Half FY22 - Maylands, WA - AFR

Page created by Ron Juarez
 
CONTINUE READING
Aspen Group - February 2022 - Investor Update - First Half FY22 - Maylands, WA - AFR
Aspen Group
Investor Update – First Half FY22

February 2022
                                    Maylands, WA
                                              1
Aspen Group - February 2022 - Investor Update - First Half FY22 - Maylands, WA - AFR
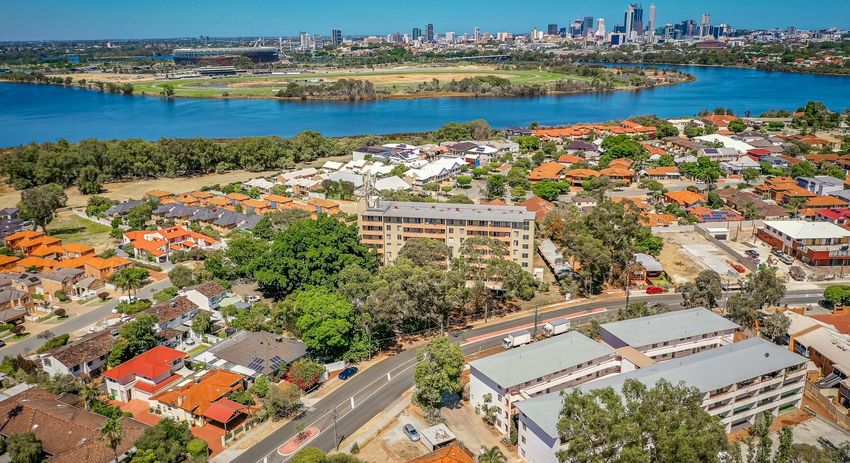
Residents at Four Lanterns Estate, NSW

Contents

    1   1H FY22 Highlights

    2   Operations

    3   Development & Trading

    4   Outlook

    5   Appendices

                                Sweet Water Grove – marketing campaign, NSW
Aspen Group - February 2022 - Investor Update - First Half FY22 - Maylands, WA - AFR
Meadowbrooke Lifestyle Estate, Boyanup, WA – acquired Dec 2021
                                                                  1
                                                                 Highlights
                                                                  1H FY22

                                                                              3
Aspen Group - February 2022 - Investor Update - First Half FY22 - Maylands, WA - AFR
Aspen Highlights

The demand for more affordable accommodation is greater than ever in Australia’s $9.3 trillion residential property market…

   Fully integrated platform - owner, operator, developer
   • Experienced management team with a material stake in the company                                                                    Aspen provides quality
   • Over 140 employees
                                                                                                                                        accommodation on truly
   Generating attractive returns for securityholders                                                                                affordable terms to a variety of
   • NAV per security $1.51 - up 26% past 12 months
   • Underlying EPS - up 2% on 1H FY21 despite short term dilution of Perth Apartment Portfolio acquisition and COVID impacts            Australian households
   • Distribution Yield 4.4%1

   Rapidly building scale at attractive entry prices aligned with our affordable strategy
   • 3,605 dwellings/sites - up 53% past 12 months
   • Portfolio book value: WACR 6.8%; $87k per dwelling/site; $33k per approved development site
   • Acquisitions performing above initial guidance

   Creating significant value through refurbishment and development
   • 25% of portfolio under refurbishment/development (c. 900 dwellings/sites)
   • Creation of quality rental streams

   Expected growth drivers over the near term
   •   Rents and values underpinned by inflation (particularly land and building cost inflation)
   •   Completion and leasing of Burleigh Heads, Cooks Hill and Perth Apartment refurbishment projects over next 6-18 months
   •   Increased development of new dwellings/sites at Retirement Communities – generating development profits and rental streams
   •   Increased business activity in Karratha and occupancy at AKV – Woodside has recently greenlighted major projects
   •   Less disruptions relating to COVID – reservations at Park communities to 30 June 22 are 35% ahead of pcp
   •   Acquisitions – proposal to acquire Coorong Quays SA announced today: 9% accretive to EPS (calendar 2021 pro forma)

   Strong ESG credentials

  1. Total distributions last 12 months divided by current NAV
                                                                                                                                                                       4
Aspen Group - February 2022 - Investor Update - First Half FY22 - Maylands, WA - AFR
1H FY22 Performance – Underlying Earnings & Distributions
 Profitability maintained in a challenging environment while portfolio is positioned for growth...

                                                Development
               Property NOI                      & Trading                      Operating Profit                   EPS                                    DPS
                     (8%)                          Profits                            +16%                         +2%                              maintained
                   $6.49m                           +196%                           $6.12m                    4.64 cents                            3.10 cents
                                                    $2.88m
                                                                                                                                                                           (compared to 1H FY21)

 • Rents increasing across our properties and demand is very strong for our competitively priced                              Underlying EPS and DPS (cents)
   accommodation (especially c.$300pw dwelling rentals in metro locations)
                                                                                                      9.00
 • Development pipeline, activity and profits continue to ramp up quickly                             8.00
                                                                                                      7.00
 • Increased proportion of portfolio under refurbishment / future development – diluting short
                                                                                                      6.00
   term earnings in return for expected NAV uplift and higher earnings growth over the medium
                                                                                                      5.00
   term
                                                                                                      4.00
 • Main COVID impacts in the half:                                                                    3.00
                                                                                                                                                           1H
                                                                                                      2.00
          - lower occupancy due to reduced demand from tourists (particularly at our NSW parks                                                                      1H
            prior to Christmas), corporates (particularly at our SA and WA (AKV) parks) and foreign   1.00
            students (Upper Mount Gravatt Co-living)                                                  0.00
                                                                                                             Full Year FY19        Full Year FY20         Full Year FY21           1st Half FY22
          - generally 15+ week delays and c.10-15% building cost increase for development
            projects: drag on near term development profits, but positive for rents and values of                                        Underlying EPS    DPS
            Aspen’s established properties

                                                                                                                                                                                                   5
Aspen Group - February 2022 - Investor Update - First Half FY22 - Maylands, WA - AFR
1H FY22 Performance - Capital
Aspen has continued to grow its business, portfolio and value while managing risks...

                                                                                      Proportion of              Portfolio WACR
                                                  Total Approved                     dwellings/sites                  6.8%                          NAV
                  Total Assets                    Dwellings / Sites                       under                  Average Value                      +15%
                     +46%                                                            refurbishment/
                                                        +31%                                                          per                         $1.51 per
                    $359m                                                             development                Dwelling/Site
                                                       3,605                                                                                       security
                                                                                         c. 25%                      $87k
                                                                                                                                                                (compared to 30 June 2021)

                                                                                                                            Net Asset Value per Security
 ▪ Business and portfolio continues to scale up – acquired Wodonga Gardens Retirement Estate, Perth
   Apartment Portfolio and Meadowbrooke Lifestyle Estate in the half                                     $1.70                                                      +15%

 ▪ Good balance of dwellings/sites that are currently operating and producing income (c. 75%) and        $1.50
                                                                                                                                                    +14%
   under refurbishment & development (c. 25%)
                                                                                                         $1.30
 ▪ Recycled some capital from our Perth House Portfolio into other areas where we can provide more
   affordable accommodation to our customer base and generate higher returns
                                                                                                         $1.10
 ▪ NAV up another 15% to $1.51 due to an increase in NOI, tightening in cap rates and value-add in our
   refurbishment & development projects                                                                  $0.90

 ▪ Portfolio still attractively valued at WACR of 6.8% and average value of $87k per dwelling/site       $0.70

 ▪ Gearing of 32% - bottom end of our long term target range of 30-40%
                                                                                                         $0.50
                                                                                                                 30 June 2019     30 June 2020   30 June 2021    31 Dec 2021

                                                                                                                                                                                         6
Aspen Group - February 2022 - Investor Update - First Half FY22 - Maylands, WA - AFR
Material Value Creation Within Portfolio
      Aspen creates value for securityholders by enhancing the value of its properties through refurbishment and development,
      driving growth in rents, net income and asset value...

                   Value Creation: Change in NAV plus Distribution Yield1                              Average Cap Rates (weighted by asset value)                                Average Value per Dwelling / Site
       25.0%                                                                                10.00%                                                               $140,000
                                                                                             9.00%
       20.0%                                                                                                                                                     $120,000
                                                                                             8.00%
                                                                                             7.00%                                                               $100,000
       15.0%
                                                                                             6.00%                                                                $80,000
       10.0%                                                                                 5.00%
                                                                                             4.00%                                                                $60,000
        5.0%                                                                                 3.00%                                                                $40,000
                                                                                             2.00%
        0.0%                                                                                                                                                      $20,000
                     Full Year FY20           Full Year FY21            1st Half FY22        1.00%
                                                                                             0.00%                                                                    $0
                              Change in NAV           Distribution Yield                             Residential   Retirement        Parks           Portfolio              Residential   Retirement        Parks     Portfolio

         ▪ Portfolio weighted average cap rate (WACR) of 6.8% - attractive compared to recent industry transactions, other real estate sectors and other asset classes
         ▪ Relatively low acquisition prices and book values enables Aspen to offer accommodation on competitive terms to our customers while generating attractive returns for securityholders –
           average book values:
               -    $87k per dwelling/site
               -    $33k per development site – the final value of developed land sites that we lease is above total production cost, adding to NAV (not reflected in Underlying Earnings)
         ▪ Expected valuation uplift upon completion and leasing of Burleigh Heads and Cooks Hill “refurbish-to-rent” projects only partially reflected at 31 December 2021
         ▪ Recent acquisitions carried at cost excluding transaction costs – Perth Apartment Portfolio, Wodonga Gardens, Meadowbrooke

1. Distribution Yield is distribution per security for the period divided by starting NAV
                                                                                                                                                                                                                                  7
Aspen Group - February 2022 - Investor Update - First Half FY22 - Maylands, WA - AFR
2
                              Operations

The Ridge, Mount Barker, SA

                                           8
Aspen Group - February 2022 - Investor Update - First Half FY22 - Maylands, WA - AFR
Residential Communities (41% of portfolio value)
                                           Residential - Total                              Residential - Operating Properties                         Residential - Properties Under Development
                             1HFY22            1HFY21             Change             1HFY22              1HFY21                    Change              1HFY22                     1HFY21         Change
Revenue - $m                  $2.79             $1.05              167%               $2.16                 $0.90                   141%                   $0.63                  $0.15          326%
NOI - $m                      $1.06             $0.64               66%               $1.11                 $0.58                   93%                ($0.05)                    $0.06          (189%)
Margin                         38%               61%               -23 pps             52%                  64%                    -12 pps
No. of dwellings / sites      1,103              297               271%                418                  126                     232%                   685                     171           301%

 Aspen owns 1,000 residential dwellings in metro locations                                                                         Residential - Operating Properties
 Operating Properties:                                                                               $450                                                                                            100%
 • Average occupancy of 81%, weighed down by UMG Co-living which was only 72%                                                                                                                        90%
   occupied in the half due to international border closures and lack of foreign students            $400
                                                                                                                                                                                                     80%
   during the COVID pandemic – other properties full / low vacancy
                                                                                                     $350                                                                                            70%
 • Opportunities for rental growth:
                                                                                                                                                                                                     60%
                                                                                                     $300
           - Lindfield Pacific Highway: average rent currently dragged down by the 64% of                                                                                                            50%
             units occupied by Retirement tenants who are paying about 1/3rd of                      $250
                                                                                                                                                                                                     40%
             Residential market rent – this will change over time
                                                                                                     $200                                                                                            30%
           - Expect another increase in residential rents in WA upon the border reopening
                                                                                                                                                                                                     20%
             and renewed population growth while new supply is constrained                           $150
                                                                                                                                                                                                     10%
           - UMG Co-living: occupancy and rents are increasing while the international
                                                                                                     $100                                                                                            0%
             borders are reopening and the new Uni year commences
                                                                                                               Lindfield Treatts       Lindfield Pac HWY           Perth Houses            UMG
           - Cost inflation and delays in the building industry likely to put upward pressure
             on rents and values                                                                                                      Average Weekly Rent        Occupancy (rhs)

 • No lease incentives across the portfolio                                                                                            Average Weekly Rent at Acquisition

                                                                                                                                                                                                            9
Aspen Group - February 2022 - Investor Update - First Half FY22 - Maylands, WA - AFR
Residential Properties Under Refurbishment / Development
Expected to add $5m NOI post completion and leasing - more than tripling current Residential segment NOI...
                                                                                              Residential - Properties Under Development

                                                    Perth Apartment Portfolio   Burleigh Heads                Cooks Hill                     Total                 Mount Barker

 Project Type                                            Refurbishment          Refurbishment               Refurbishment               Refurbishment            Land Development

  NOI 1HFY22 - $m                                            $0.06                 ($0.05)                     ($0.03)                      ($0.02)                     ($0.03)
  Expected Annual NOI –
                                                             $4.00                  $0.50                       $0.50                        $5.00              Development Profits
  Stabilised Post Completion - $m
  Expected Development Completion Date                Dec 2021 - June 2023        June 2022               June - August 2022                                    June 2022 - June 2025

   Perth Apartment Portfolio acquired in
   September 2021
   •   Proactive removal / relocation of many
       tenants for more efficient refurbishment
       (reducing NOI in short term)
   •   Tracking well – refer next page
   Burleigh Heads and Cooks Hill
   •   Delays of 15+ weeks and cost increases –
       more than offset by market price and rent
       increases
   Mount Barker
   •   Likely to produce residential land product
       only (no retirement component) due to
                                                     Driveway upgrade at Burleigh Heads                                  Extension of existing building at Cooks Hill
       superior return prospects

                                                                                                                                                                                        10
Perth Apartment Portfolio
   Refurbishment program on schedule, costs are under control, and rents are tracking above budget...

                                     Total Apartments:           514
                          Initial Guidance – Post Refurbishment Program
                                 Average Total Cost per Apartment: $156k

                         (purchase cost of $107k plus refurbishment cost of $49k)

                                         Average weekly rent: $275

                              Gross Rental Yield: 9% / Net Rental Yield: 5%
                                                                                                                                                       Source: Core Logic

                  Occupied Apartments – Not          Refurbished and Occupied/For Lease                    Refurbishment in Progress
                         Refurbished                                                                                                            132 Guildford Road
                                                                                                         Expected Completion 2H FY22

                          143                                           88                                         163
                                                                                                                                             Emptied for Refurbishment
                                                                                                                                             Expected Completion FY23

               About 2/3rds would benefit from
           refurbishment over next couple of years
                                                            Typical refurb cost: c.$45k

                                                          Typical starting rent: $285pw
                                                                                                          Typical refurb cost (e): c.$45k           120
                                                       (impacted by building works still in progress –                                       Planning Stage – On Track
                                                                                                         Typical starting rent (e): $285pw
                   Average weekly rent: $254         contracted rent bump to $310-320 after 6 months)

                                                                                                                                                                            Perth, WA

As at 24 February 2022
                                                                                                                                                                                   11
Solid Progress on Perth Apartment Portfolio Refurbishment
Customised roll out across portfolio – refurbished apartments are well presented, comfortable, and affordable...

        23 Kathleen Avenue, Maylands           126 Peninsular Road, Maylands        291 Harborne Street, Glendalough

                                                                                                                       12
Retirement Communities (20% of portfolio value)
                                                                                                                                                      Retirement Communities
  Aspen owns 940 Retirement dwellings/sites in metropolitan and lifestyle locations
                                                                                                                                         1HFY22              1HFY21            Change
                                                                                                            Revenue - $m                  $2.24               $1.74             29%
  Residential Land Leases:
                                                                                                            NOI - $m                      $1.32               $1.07             23%
  - Aspen develops and sells houses and leases the underlying land sites
                                                                                                            Margin                        59%                  62%             -3 pps
  - Average land rent across the Retirement portfolio is only $170 per week:
                                                                                                            No. of dwellings / sites       940                 504              87%
             • Commonwealth Rent Assistance (CRA) currently covers 75% of the weekly rent from $103 to a
               cap of $193 – maximum CRA payment of $67 per week (per couple)
             • Aspen’s land rents are comfortably below CRA’s maximum rent cap of $193 – therefore when
               we increase rents, the Government funds part of the increase (customers have to fund 100%               Retirement Community Sites - Leased and Pipeline
               of an increase in rent above $193)                                                           1,000
  - We are also growing the number of land leases in the portfolio through acquisition and development:       900
             • # of leased land sites increased by 31 or 7% in the half (55% acquired / 45% developed)        800

             • Organic growth is expected to pick up because we have been methodically growing our            700
               pipeline of development sites at an attractive cost
                                                                                                              600

                                                                                                              500
  Retirement Village Leases (DMF):                                                                            400
  - Aspen owns the dwelling and land, and leases them under Retirement Village Acts - profit generated        300
    through collecting Deferred Management Fees (DMF) on re-leasing                                                    30 June 19        30 June 20          30 June 21    31 Dec 21

  - Total of only 77 leases - Lewis Fields and Wodonga Gardens acquired with intention to convert vacant                               Leased     Development Pipeline
    land for Land Lease development purposes
  - DMFs are conservatively valued in our opinion – external valuation at time of acquisition assumed 16-
    17% discount rate, 2-3% price growth and ALOS of 12 years

* ALOS: Average Length of Stay of existing residents
                                                                                                                                                                                        13
Park Communities (39% of portfolio value)
                                           Park Communities                              Park Communities - All Except AKV                                 Park Communities - AKV
                             1HFY22            1HFY21            Change             1HFY22           1HFY21              Change             1HFY22                  1HFY21                 Change
 Revenue - $m                 $10.93           $12.09             (10%)              $9.80            $8.00               23%                $1.13                   $4.09                 (72%)
 NOI - $m                     $4.12             $5.34             (23%)              $4.11            $3.40               21%                $0.01                   $1.93                 (100%)
 Margin                        38%              44%                                   42%              43%                                       0%                   47%
 No. of dwellings / sites     1,562             1,562               0%               1,382            1,382                0%                    180                  180                   0%

                                                                                                                                          NOI by Park ($m)
  Aspen owns 1,562 dwellings/sites within Park Communities in
  attractive lifestyle locations                                                                      $2.00
                                                                                                      $1.80
                                                                                                      $1.60
  COVID impacted tourism and business trade during the half and pcp – also no JobKeeper               $1.40
  support in FY22
                                                                                                      $1.20
  Highway 1 and Barlings Beach have a large proportion of long term dwelling leases and               $1.00
  casual and long term land leases which has helped maintain profitability despite the                $0.80
  disruptive lockdowns
                                                                                                      $0.60
  Darwin Freespirit Resort performed well in its peak trading season and NOI was up 75%               $0.40
  versus pcp - mainly due to increased short stay tourism, improved entertainment offering            $0.20
  and good cost controls (margin improved from 31% to 37%)
                                                                                                      $0.00
  Aspen Karratha Village - NOI essentially $nil post expiry of Woodside lease in January 2021 –               Barlings   Koala Shores   Tween          Adelaide   Highway One Darwin FSR       AKV
  occupancy slowly building, but volatile and seasonal and dependent on Woodside starting                      Beach                    Waters

  work on its major projects (and WA border opening)                                                                                        1HFY21         1HFY22

                                                                                                                                                                                                     14
3
                                         Development &
                                            Trading

Wodonga Gardens Retirement Estate, Vic

                                                         15
Development & Trading
                                                                                                                                              Settlements Since 31 December 2021 and Current
                                                                                                          Settled - 1H FY22
                                                                                                                                                             Contracts/Deposits
Solid momentum in development and trading activity has                                                        Amount $m           Per                             Amount $m            Per
                                                                                          # Dwellings/Sites                                   # Dwellings/Sites
continued in FY22                                                                                              (exc GST)      Dwelling/Site                        (exc GST)       Dwelling/Site

Development Profit: total sales/contracts/deposits for           Development & Trading
new dwellings and land sites of 53 so far compared to 23          Total Revenue                  28             $10.05           $359k               39             $11.5             $295k
settled sales for all of FY21:                                    Total Cost                                    -$7.17          ($256k)
                                                                  Profit                                         $2.88           $103k
- Number of communities under development has
                                                                  Margin                                          29%
  increased from 2 to 5 over the past 18 months
- 14 sales settled in the half v. 11 in the pcp – held back by      Development
                                                                    Total Revenue                14              $3.97           $284k               39             $11.5             $295k
  delays in house construction during COVID lockdowns
                                                                    Total Costs                                 -$2.57          ($184k)
- Average profit margin increased in the half to 35%, but           Profit                                      $1.40            $100k
  building costs have generally increased 10-15% and we             Margin                                        35%                                      Expected Margin c.30%
  expect margin to revert back to around 30% in future
                                                                    Trading
- Additional value created through the uplift of newly              Total Revenue                14              $6.08           $434k               0              $0.00               $0
  leased site values v. total production cost (adds to NAV)         Total Costs                                 -$4.60          ($329k)
Trading Profits: sale of 14 existing dwellings in the half          Profit                                      $1.48            $106k
from the Perth House portfolio for a total profit of $1.48m         Margin                                        24%
relative to cost:
- Some of this profit was taken up in NAV at 30 June 2021
- The remaining 68 houses are fully occupied with a good
  quality tenant base and rents have been increasing
- Currently none for sale – we expect good growth in
  population and residential rents and prices once the WA
  border reopens

                                                                  Preparatory site works for the next stage of houses at Wodonga Gardens

                                                                                                                                                                                                   16
Development & Trading Activity
For our Retirement Community land lease developments we expect to create value two ways:
1. A profit margin from selling the dwelling (sales price less selling costs less total production cost of the dwelling and landscaping) – this profit is reflected in Underlying Earnings
2. An uplift on the value of the leased land site compared to total production cost – this profit is reflected in Net Asset Value
Land Lease Communities:
Four Lanterns - gained approval for another 3 new sites (net). Sweetwater Grove – demand and prices increasing. Lewis Fields – converted spare land to LLC and first stage of 4 houses
already sold out at up to $399k. Wodonga Gardens – 11 of next 12 houses under deposit. Meadowbrooke – ordering first batch of houses, sites already fully serviced
Mount Barker - started producing and pre-selling new Residential lots:
Stage 1 was approved for 29 lots at the time of acquisition – we have reconfigured and gained development approval for 35 lots (20% more for this stage)
Expected profit margin of over $100k / 45%, which is expected to be more profitable than developing a retirement land lease community on the site

                    Evolution of Aspen's Land Development Pipeline                                                                  Development & Trading Profits ($m)
                  Total Approved Sites and Current Book Value per Site
                                                                                                          $4.00                                                                                      30
600
                                                                                                          $3.50
                                                                                                                                                                                                     25
500                                                                                                       $3.00
                                                                                  Meadowbrooke
                                                                                  ($18k)                                                                                                             20
                                                                                                          $2.50
400                                                                               Wodonga

                                                                                                                                                                                       Trading
                                                                                  Gardens ($27k)          $2.00                                                                                      15
                                                                                  Lewis Fields
300                                                                               ($24k)                  $1.50
                                                                                                                                                                                                     10
                                                                                  Mount Barker

                                                                                                                                                                                       Development
                                                                                  ($44k)                  $1.00
200
                                                                                  Sweetwater                                                                                                         5
                                                                                                          $0.50
                                                                                  Grove ($65k)
100                                                                               Four Lanterns           $0.00                                                                                      0
                                                                                  ($100k)                                FY19                FY20                  FY21             1HFY22

  0                                                                                                                                         D&T Profits   # of Sales (rhs)
        2H FY19       1H FY20    2H FY20     1H FY21     2H FY21      1H FY22

                                                                                                                                                                                                          17
4
Outlook

          18
Outlook
Aspen is well positioned to grow Net Asset Value and/or Underlying Earnings per security by at least 10% per annum over the medium term...
▪ Residential:
   -   Aspen’s residential properties are currently valued at less than replacement cost -
                                                                                             ▪ Development & Trading:
       building costs and land prices have increased materially over the past 12-18 months
                                                                                                -   Development of new houses: already deposited/contracted/sold 53 in FY22
   -   Completion of refurbishment / redevelopment programs at Burleigh Heads, Cooks
                                                                                                    compared to 23 settled sales in all of FY21
       Hill and Perth Apartment Portfolio expected to add about $5m in NOI when leased
                                                                                                -   Trading existing houses: we don’t intend to sell any more houses in FY22 as we now
   -   Expect increased occupancy at UMG Co-living with international students now able
                                                                                                    have a good quality tenant base, and we expect good growth in rents and prices as
       to enter Australia – scope to increase occupancy materially from only 72% and rent
                                                                                                    the borders reopen, population growth picks up, and building (replacement) costs
       from only $218 per week
                                                                                                    stay elevated
   -   WA economy is relatively strong and once the border re-opens, we expect a pickup
       in population growth, and rents to take another leg up across our Perth properties
                                                                                             ▪ New Acquisition:
                                                                                                -   Today we announced a proposal to acquire the Marina Hindmarsh Island Fund
▪ Retirement Communities:
                                                                                                    (MHIF), owner of Coorong Quays, SA (CQ)
   -   Expect continued land rent growth of 3-4% per annum (increase subsidised by CRA)
                                                                                                -   The implied price for CQ equates to about $25m: expected yield of 8.5% on the
   -   Increased creation of new land leases with 6 communities now under development               operating component and c.$41k per lot for the Retirement (Land Lease) and
                                                                                                    Residential land development components
▪ Park Communities:                                                                             -   Pro forma financial impact (calendar 2021): equity base up 11%, gearing reduced to
                                                                                                    30%, NAV neutral, EPS up 9% (assuming MHIF holders elect all scrip - up to $4m /
   -   Forward bookings to June up more than 35% versus same time last year
                                                                                                    16% of the consideration could be debt funded)
   -   Hopefully, COVID will dissipate which would reduce volatility and should increase
                                                                                                -   Acquisition conditional on Aspen securityholder approval and MHIF shareholders
       profitability, particularly at Adelaide Caravan Park, Tween Waters and Koala Shores
                                                                                                    entering into agreements
   -   We remain positive about Karratha’s growth prospects - AKV occupancy has been
                                                                                                -   Refer Proposed Acquisition of Coorong Quays presentation released to ASX today
       slowly building but had a seasonal decline over summer (cyclone season), occupancy
       is volatile, and the WA border needs to be open
   -   Plenty of opportunities to improve our accommodation offering and profits through
       refurbishment / repositioning / redevelopment

                                                                                                                                                                                         19
Aspen’s Credentials

 ✓Customer-centric provider of quality accommodation on competitive terms
 ✓Highly experienced and disciplined management team with substantial shareholdings in the company
 ✓Integrated ownership, operating and development platform that is scalable
 ✓Over 3,600 approved dwellings/sites generating diversified and reliable revenue streams
 ✓Ample organic growth opportunities within the portfolio through refurbishment/repositioning/redevelopment
 ✓Acquisitions constantly under review - addressable market worth over $1 trillion and growing
 ✓Opportunities to recycle capital to fund profitable growth
 ✓Strong ESG credentials – taking care of households that need more affordable accommodation, the
    environment, employees, suppliers and shareholders

                                                                                                              20
Appendix A

Koala Shores Holiday Park, NSW

                                 Aspen’s Business and
                                  Property Portfolio

                                                        21
Aspen’s Business Model

                                                                                Aspen Provides Quality Accommodation to
                                                                               Australian Households on Competitive Terms
        Sustainable Ecological Footprint                                     Customer-centric business model servicing households that can                              Governance
                                                                             afford no more than $400 weekly rent or $400k purchase price
    Aspen’s efficient dwellings use significantly less                        We provide a range of products demanded by our customers in
    resources to manufacture and operate than the                                     residential, retirement and park communities                    Aspen Group comprises Aspen Group Limited and
          average Australian home – we also
                                                                                                                                                          Aspen Property Trust with two separate
              recycle/refurbish dwellings                                      We foster a safe, social, diverse, and inclusive culture in our
                                                                                                                                                                   independent Boards
                                                                            communities by providing on-site management, customer services,
     With solar installed, our dwellings can produce
                                                                            and community facilities which gives our residents a sense of home         Aspen provides equal employment opportunities
      more renewable energy than they consume
                                                                                    and meaningful connections to the community                       regardless of gender, gender-identity, age, culture,
     We install energy and water saving devices and                                                                                                           race, religion and lifestyle choices
            metering to reduce resource use                                Total value of real estate in Aspen’s addressable market >$1 trillion
                                                                                                                                                        We continuously strive for the highest WH&S
  Our communities share resources such as common                                                                                                          standards at our properties to keep our
   areas, recreation facilities, gardens and transport                                                                                                   employees, suppliers and customers safe
                                                                               Average                Average Land              Average New
     Our parks are highly vegetated, and our land                                                                                                      Our Joint CEOs own a combined stake of 8.2% in
    management programs reduce degradation and                              Dwelling Rent             Lease Rent of             Dwelling Sales           Aspen Group and 50% of their remuneration
                 environmental risks                                         of c.$260pw               c. $170pw               Price of c.$350k        package is deferred for up to 3 years and subject
                                                                                                                                                        to performance hurdles and vesting conditions
    Aspen’s carbon emission reduction target for the
     assets that it controls is in accordance with the
                  2015 Paris Agreement                                        Some of our properties are located in past and present Indigenous
                                                                           communities, and we actively seek to help these communities and conserve
                                                                                                         heritage items

Additional information on Aspen’s ESG program is contained in Appendix C
                                                                                                                                                                                                             22
Current Portfolio Composition
Aspen owns, operates and develops residential, retirement and park communities in metropolitan and lifestyle
locations where our customers lease dwellings and land sites...

         Portfolio Value by Property Type                  Location by Value        Total Dwellings/Sites - Operating v. Development

                                                                                                              Leased Land
                                                                         Regional                                Sites
                                          Park                                                                   28%
           Residential                                                     33%
                                       Communities
              41%                                                                                Leased
                                          39%
                                                                                                Dwellings
                                                     Metropolitan                                 48%
                                                                                                                  Land Site
                                                        67%
                                                                                                                Development
                                                                                                                   Pipeline
                          Retirement                                                                     Dwellings 14%
                         Communities                                                                       Under
                             20%                                                                       Refurbishment
                                                                                                           10%

                                                                                                                                       23
Current Portfolio Summary
     Current Portfolio Aggregates1

                                                                                        ▪ Aspen currently has 21 properties/portfolios valued at approximately $316m:
      Properties/Portfolios                                                  21
                                                                                           o Average value of approximately $87k per approved dwelling/site
      Land Area                                                          101 hectares
      Approved Sites                                                        3,605          o Only $3.1m per hectare of land (including the value of dwellings)
      Dwellings owned by Aspen                                              1,715          o WACR of 6.8%
                                                                                        ▪ General traits that Aspen seeks in properties it acquires:
      Density:
                                                                                           o Desirable locations – particularly metropolitan
        - sites per hectare                                                  36
                                                                                           o Large land parcels that are under-utilised

      Portfolio Value:                                                     $316m
                                                                                           o Existing dwellings priced at below replacement cost with alternative uses and can be refurbished / repurposed
        - per hectare                                                       $3.1m          o Land and development cost at the low end of (or below) local competition
        - per approved dwelling/site                                         $87k          o Competitive operating costs (e.g. tax incentives / subsidies)
                                                                                           o Flexibility / optionality
      Valuation WACR                                                        6.8%           o Strong potential for higher value use over time

                            Increasing Property Value – providing our customers attractive lifestyles options at competitive prices and rents

                          Camping / Sites                                    Cabins                   Manufactured Homes                  Residential Homes               Apartments / Co-Living

1. Excludes proposed acquisition of Coorong Quays which is conditional                                                                                                                                       24
Aspen’s Portfolio Composition & Growth
         Portfolio Composition1,2 and Acquisition History                                                                                           ▪ Aspen’s portfolio composition and income streams have improved
                                                                                                                                                      materially over the past few years.
                                                                                                                  + Meadowbrooke Lifestyle Estate
                                                                                                                    + Perth Apartments Portfolio       o Increased weighting to:
                                                                                                                        + Wodonga Gardens
                                                                                                                                                          -   Metropolitan locations
                                                                                                            + Mount Barker
                                                                                                            + Burleigh Heads                              -   More stable, less seasonal rental income
       $m
                                                                                                               + Cooks Hill
                                                                                                                                  $316                    -   Capital growth v. income profile
                                                                                                                 + UMG
       $320
                                                                                                              + Lewis Fields                              -   More liquid properties - individual houses and apartment
                                                                                                                                                              buildings in metropolitan locations are usually easier and quicker
                                                                                       + Lindfield Apartments
                                                                                                                                                              to rent and sell
       $270                                                                              + Perth Residential
                                                                                                                 $251
                                                                                               Portfolio                                               o Continued pivoting between short stay and long stay offer when
                                                                                                                                                         conditions change to maximise profits
                                                                             + Highway 1
       $220                                                                                      $210
                                                           + Koala Shores                                                                              o AKV weighting has reduced considerably – Aspen is in a strong
                                                            + Darwin FSR                                                                                 position to be able to optimise risks/rewards of this asset
                                                                                $173
                       AKV             + Tween Waters
       $170       Four Lanterns        + Barlings Beach         $143
                    Mandurah
                   Sweetwater
       $120            ACP                 $108

                       $79

         $70

         $20

                       2016                2017                 2018            2019             2020            2021             2022
        -$30

                                                                Parks    Retirement    Residential

1. Based on property carrying values at 1H FY22.
2. Excludes proposed acquisition of Coorong Quays which is conditional
                                                                                                                                                                                                                                   25
FY22 YTD Acquisitions – building significant scale at prices which align with our affordability strategy

                                       Perth Apartment Portfolio                             Meadowbrooke Lifestyle Estate, WA

Status:                                Settled September 2021                                       Settled December 2021

Purchase Price:                               $52.0m                                                        $3.3m

Dwellings/Sites:                           514 apartments                 184 comprising 17 leased sites, 3 villas, and 164 approved development sites

Land Area:                                  4.7 hectares                                                  9.1 hectares

Value Metric:                           $101k per apartment                                              $18k per site

                                                                                                                                                         26
FY22 YTD Acquisitions – building significant scale at prices that align with our affordability strategy

                                       Wodonga Gardens Retirement Estate, Vic                                                      Coorong Quays, SA

Status:                                           Settled August 2021                                                               Merger Proposal

Purchase Price:                                          $6.0m                                                                          $25.0m

Dwellings/Sites:        172 comprising 51 leased houses (DMF) and 121 approved development sites      c.3,000 including residential, retirement, cabin-van park, marina, commercial

Land Area:                                            8.8 hectares                                                                    330 hectares

Value Metric:                                         $35k per site                                8.5% cap rate and $41k per development site - refer to separate presentation on ASX

                                                                                                                                                                                         27
Aspen’s portfolio is geographically diversified…
                                                                                                                                                    Land Area
                                                                                                             NT                                     (Hectares)
                                                                                                                                                                      Dwellings/Sites
                                                 Land Area
     WA                                          (Hectares)
                                                                     Dwellings/Sites
                                                                                                             18              Darwin FreeSpirit           10.8              461
     13    Mandurah                                  6.8                  158
     14    AKV                                       2.9                  180
                                                                                                        18
     15    Perth House Portfolio                     2.5                   68                                                                                                                                                           Land Area       Dwellings/
                                                                                                                                                                                                     Queensland                         (Hectares)        Sites
     16    Perth Apartment Portfolio                 4.7                  514
     17    Meadowbrooke Lifestyle Estate             9.1                  181                                                                                                                        19      Burleigh Heads                0.9                18
                                                                                                                                                                                                     20      UMG Co-living                 1.2             308

                                                                                                                  7%
                                                                14

                                                                                                                                                                9%
                                                                                                                                                                                                                                                      Land Area
                                                                                                  Portfolio         Value1:         ~$316m                                                                       NSW                                  (Hectares)
                                                                                                                                                                                                                                                                     Dwellings/Sites

                                                                                35%                                                                                                            20                1     Four Lanterns                      3.9             131
                                                                                                                                                                                               19
                                                                                                                                                                                                                 2     Sweetwater Grove                   6.0             214

                                                                                                                     16%                                                                                         3     Lindfield Kiah                    0.19              20

                                                                                                                                                                                                                 4     Lindfield Kalinda                 0.16              22
                                                     16
                                                         15                                                                                                                                                      5     Koala Shores                       5.1             144
                                                       13                                                                                                        31%
                                                          17                                                                           10 i                                            5 2
                                                                                                                                                                                            8                    6     Barlings Beach                     8.8             260
                                                                                                                                                                                      1 3/4
                                                                                                                                      9 11
                                                                                                                                               12                                                                7     Tween Waters                       1.9              98
                                                                                                                                          ii
                                                                                                                                                                                  6                              8     Cooks Hill                        0.19              55
                                                                                              Land Area                                                          21              7
                                                           SA                                                     Dwellings/Sites
                                                                                              (Hectares)                                            2%
                                                           9          Adelaide CP                 1.5                   97
                                                           10         Highway One                 9.9                  322
                                                           11         Mount Barker               11.5                   97                                                                                                     Land Area             Dwellings/
                                                                                                                                                                                          Victoria                             (Hectares)              Sites
                                                           12         Lewis Fields                3.7                   80
                                                           i          CREST 1                     22                    98                                                                21         Wodonga Gardens                8.8                 172

                                                                                       1
                                                           ii         Coorong Quays              330                  c.3,000

1.    CREST and Coorong Quays are owned by Funds managed by Aspen Group. Today Aspen announced a proposal to acquire Coorong Quays.
                                                                                                                                                                                                                                                                                       28
Aspen Group: Portfolio Summary
                                                                                                                Residential

Segment                                                WA                                        NSW                                              QLD                           SA

                                     Perth Apartment        Perth House
                                                                          Lindfield Kiah   Lindfield Kalinda      Cooks Hill       Uniresort             Burleigh Heads    Mount Barker     Total Residential
                                         Portfolio           Portfolio

Region                                 Perth Metro          Perth Metro   Sydney Metro      Sydney Metro       Newcastle Metro   Brisbane Metro         Gold Coast Metro   Adelaide Hills

Land Ownership                          Freehold             Freehold       Freehold           Freehold           Freehold          Freehold                Freehold         Freehold

Resident Tenure                          Rental               Rental         Rental             Rental             Rental            Rental                  Rental            N/A

Total Land Area (HA) 1                     4.7                  2.5           0.19               0.16               0.19              1.2                     0.94             11.5               21.5

Operational Sites                         231                   68             20                 22                  0               308                      0                 0                649

Pipeline - Refurbishment Dwellings        283                   0               0                 0                  50                0                      18                 0                351

Pipeline - Undeveloped Sites               0                    0               0                 0                   0                0                       0                103               103

Total Approved Sites 2                    514                   68             20                 22                 50               308                     18                103              1,103

 - per Ha                                 108                   27             104               140                 263              256                     19                 9                 51

Owned Dwelling Inventory 3                514                   68             20                 22                 50               308                     18                 0               1,000

 - per Approved Site                      100%                 100%           100%              100%                100%             100%                    100%               0%                91%

Book Value 4 ($m)                        $54.99               $22.69          $8.90             $4.90               $6.90           $20.08                   $7.45             $4.72            $130.62

Valuation Cap Rate 5                     5.00%                3.75%          3.24%              3.22%              4.18%             5.75%                   3.85%             N/A               4.59%

Value Per HA ($m)                        $11.60                $8.91         $46.14             $31.25             $36.30           $16.66                   $7.92             $0.41             $6.07

Value Per Approved Site                 $106,982             $333,704       $445,000          $222,727            $137,928          $65,181                $413,763          $45,811           $118,422

                                                                                                                                                                                                                29
Aspen Group: Portfolio Summary
                                                                                                   Retirement Communities

Segment                                             NSW                                            WA                              VIC                 SA

                                         Four                Sweetwater
                                                                                Mandurah Gardens        Meadowbrooke        Wodonga Gardens       Lewis Fields     Total Retirement
                                       Lanterns                Grove
Region                               Sydney Metro         Newcastle Region         South Coast           South Coast        Albury-Wodonga          Fleurieu

Land Ownership                         Freehold                Freehold             Freehold              Freehold              Freehold            Freehold

Resident Tenure                       Land Lease          Land Lease / Rental      Land Lease            Land Lease         Retirement Village   RV / Land Lease

Total Land Area (HA) 1                   3.9                     6.0                   6.8                   9.1                  9.29                 3.7               38.7

Operational Sites                        127                     140                  158                    20                    51                  26                522

Pipeline - Refurbishment Dwellings        0                       0                    0                     0                      0                  0                  0

Pipeline - Undeveloped Sites              4                       75                   0                    164                    121                 54                418

Total Approved Sites 2                   131                     215                  158                   184                    172                 80                940

 - per Ha                                33                       36                   23                    20                    19                  22                24

Owned Dwelling Inventory 3                0                       37                   0                     3                     51                  26                117

 - per Approved Site                     0%                      17%                   0%                    2%                   30%                 33%                12%

Book Value 4 ($m)                       $19.25                  $16.30               $14.48                 $3.27                 $6.16              $2.44             $61.89

Valuation Cap Rate 5                    4.75%                   7.50%                6.75%                  N/A                   N/A                 N/A               8.22%

Value Per HA ($m)                       $4.90                   $2.72                $2.14                  $0.36                 $0.66              $0.66              $1.60

Value Per Approved Site                $146,947                $75,814              $91,633                $17,778               $35,792            $30,463            $65,843

                                                                                                                                                                                      30
Aspen Group: Portfolio Summary
                                                                                                                      Park Communities                                                                                                  Portfolio Total
Segment                                                                 NSW                                                     SA                               NT                   WA                                                    Australia
                                                 Barlings               Koala                Tween                Highway              Adelaide               Darwin
                                                                                                                                                                                      AKV              Total Parks
                                                  Beach                Shores                Waters                 One                  CP                    FSR
Region                                         South Coast          Central Coast         South Coast         Adelaide Metro         Adelaide Metro       Darwin Metro              Pilbara
Land Ownership                                   Freehold          Free/Leasehold           Freehold              Freehold              Freehold             Freehold              Freehold
                                           Land Lease / Short                                                Short Stay / Land
Resident Tenure                                                       Short Stay           Short Stay                                  Short Stay       Short Stay / Rental       Short Stay
                                                  Stay                                                             Lease
Total Land Area (HA) 1                              8.8                   5.1                  1.9                   9.9                   1.5                  10.8                  2.9                  40.9                                 101

Operational Sites                                  260                   144                    98                   322                   97                   461                   180                  1,562                               2,733
Pipeline - Refurbishment Dwellings                   0                     0                    0                     0                     0                     0                    0                     0                                  351
Pipeline - Undeveloped Sites                         0                     0                    0                     0                     0                     0                    0                     0                                  521
                          2
Total Approved Sites                               260                   144                    98                   322                   97                   461                   180                  1,562                               3,605
 - per Ha                                           30                    28                    50                   33                    65                    43                    62                   38                                   36
                               3
Owned Dwelling Inventory                            33                    40                    33                   115                   47                   150                   180                   598                                1,715
 - per Approved Site                               13%                   28%                   34%                  36%                   48%                   33%                  100%                  38%                                  48%

Book Value 4 ($m)                                 $19.69               $11.50                 $8.85                $30.37                $13.16               $23.50                $16.00               $123.07                              $316
                      5
Valuation Cap Rate                                7.25%                 8.00%                 8.50%                8.25%                 8.00%                 8.50%                17.00%                6.20%                               6.8%
Value Per HA ($m)                                 $2.25                 $2.26                 $4.54                 $3.08                $8.77                 $2.17                 $5.47                 $3.01                              $3.12
Value Per Approved Site                          $75,733               $79,861              $90,291               $94,309              $135,674               $50,976              $88,889               $78,788                             $87,539
1.   Sweetwater Grove land area excludes "Environmental Conservation" land that is not currently approved for development
2.   Approved Sites is the total number of underlying units or land sites currently permitted on the property under title, licence or other conditions
3.   Owned Dwelling Inventory are houses, apartments, cabins, vans, commercial/retail space etc. that Aspen owns that can be sold or leased on short to long term basis to customers
4.   Property values are a mixture of Directors’ and external valuations. Note for Wodonga Gardens and Lewis Fields - some leases at these properties are regulated under Retirement Village Acts and residents are obligated to pay Deferred Management Fees
     (DMF) under contracts. The book values in this table reflect the fair value of the estimated DMF revenue stream plus the fair value of spare land (ie. excludes gross up for resident loans included in the financial statements)
5.   Valuation cap rate that has been applied by external valuers in the most recent external valuations. Perth apartment portfolio is current estimate of stabilised yield on cost

                                                                                                                                                                                                                                                                31
Appendix B

                                  Financial
                                  Accounts

Sweetwater Grove, Tomago, NSW

                                              32
Operating Profit – 1H FY22
                                                            1H FY22        1H FY21
     Key Metrics                                                                           Change
                                                              $m             $m
                                                                                                              Statutory Profit up 207% - includes revaluation gains
     Statutory Profit                                        29.27            9.54          207%

     Total Revenue                                           26.00           17.77           46%              Operating Profit up 16%
     Operating & Development Net Income                       9.37            8.02           17%
     Margin                                                                                                   Rental and ancillary services revenue up 7%, but Net Operating Income down 8% at a margin of 41%:
        - Rental & ancillary services revenue                15.95           14.88            7%              - Operating Revenue increased at all Residential and Retirement communities but was very mixed at the
        - Direct property expenses                           (9.46)          (7.83)                             Parks with COVID impacting trade differently across the corresponding halves (eg. ACP up 82%, Darwin
        Net Operating Income                                  6.49            7.05           (8%)               up 51%, Koala Shores down 37%) and due to the expiry of Woodside’s lease at AKV (down 72%)
        Operating Margin                                      41%             47%                             - JobKeeper was not available this half
        - Development & trading revenue                      10.05            2.89          247%              Net Development & Trading Income doubled through the sale of 28 new and existing houses at an
        - Cost of sales                                      (7.17)          (1.92)                           average margin of $103k / 29%
        Net Development & Trading Income                      2.88            0.97          196%              Management Expense Ratio (MER) improved again to 1.4% (annualised) - competitive for a fully
        Development & Trading Margin                          29%             34%                             integrated operating and development platform
      Net Corporate Overheads                                (2.43)          (2.05)          19%              Net finance expense up 21% - higher debt and interest rates
        MER    (annualised)2                                  1.4%           1.7%                             Nil tax – Aspen has a material amount of historic tax losses that currently shelters taxable profits
     Operating EBITDA                                         6.94            5.97           16%              EPS up 2% - acquisition of the Perth Apartment Portfolio partly funded with the equity raising is currently
      Net finance expense                                    (0.81)          (0.67)          21%              dilutionary during the refurbishment program
      Tax                                                        -              -             0%              DPS maintained
     Operating Profit1                                        6.12            5.29           16%
     Securities (weighted)                                   131.82         116.36           13%
     Operating EPS (cents)                                    4.64            4.55            2%
     DPS (cents)                                              3.10            3.10            0%

1.   Non-IFRS measure used by management to assess the underlying performance of Aspen - excludes depreciation and amortisation, revaluations, and one-off and non-operating items. Refer to definition in financial statements.
                                                                                                                                                                                                                                   33
2.   MER is Management Expense Ratio (net corporate overheads divided by ending gross assets)
Summary Balance Sheet and Capital Management

                                                                                                                                                                             Drawn
                                                                                                                                              Expiry          Limit                         Available
                                                    31 Dec 21            30 June 21                         $m                                                            31 Dec 2021
        Key Metrics                                                                             Change
                                                       $m                    $m
                                                                                                            Debt Facilities                 April 2024      $156.00         $112.70            $43.30
         Property Assets                               338.8                228.7                     48%   Total Margin (above BBSW)        2.000%

         Total Assets                                  358.7                246.5                     46%   Swaps - Floating to Fixed       April 2024                       $70.00
                                                                                                            Fixed Rate                       0.498%
         Net Debt                                      104.9                 66.4                     58%

                                                                                                             NAV up 15% over the half and 26% over the year
           - Cash                                        7.8                  8.3

           - Gross Debt                                112.7                 74.7                            Property Assets up 48% - driven mainly by the acquisition of Perth Apartment Portfolio
                                                                                                             (PAP), Wodonga Gardens and Meadowbrooke, and revaluation gains
         Net Asset Value (NAV)                         210.3                152.6
                                                                                                             Drawn debt of $112.7m and gearing of 32% - bottom end of long term target range of 30-
         Securities (period end)                      139.6m               116.4m                            40%

         NAV per Security                              $1.51                $1.31                     15%
                                                                                                             Interest Rate Hedging - $70m of BBSW exposure fixed at 49.8bps until April 2024
         Gearing1                                       32%                  28%

1. Net Debt divided by Total Assets less Cash less RV Resident Obligations (target range of 30-40%)
                                                                                                                                                                                                        34
Reconciliation of Statutory Profit to Operating Profit

                                                         1H FY22   1H FY21
                                                                             % Change   Asset revaluations
                                                           $m        $m
                                                                                        ▪ In the half Darwin Freespirit Resort, Four Lanterns, Sweetwater Grove, Koala
  Statutory Net Profit after Tax                          29.27     9.54      207%
                                                                                          Shores and the Lindfield Apartments we revalued by external valuers. All
                                                                                          other properties were subject to Director reviews
  Adjustments:
                                                                                        ▪ Total revaluation gains for the externally valued properties was approximately
   Depreciation of PPE                                    0.47      0.35                  $17m above carrying value at 30 June 2021 (after adjusting for subsequent
                                                                                          capital expenditure). The increase in valuation above the previous external
   Asset revaluations                                    (20.73)    (4.83)                valuations can be attributed to an increase in adopted net income of 25% and
                                                                                          reduction in average capitalisation rate (weighted by net income) of about
                                                                                          95bps.
   Reversal of previous impairment on PPE                 (2.88)      -
                                                                                        ▪ Director appraisals resulted in c. $10m increase in carrying values for the rest
   Fair vale loss on retirement village resident loans    0.13        -                   of the portfolio
                                                                                        ▪ Recent acquisitions were carried at cost excluding transaction costs – Perth
   Asset transaction costs & other                        0.61      0.24                  Apartment Portfolio, Wodonga Gardens, Lewis Fields, Meadowbrooke
                                                                                                 -    Interest capitalised to projects in the half: $0.40m
   Deferred tax benefit recognised                        (0.75)      -

  Operating Profit                                        6.12      5.29       16%      Depreciation / R&M / SIBC
                                                                                        ▪ Aspen spent $0.71m during the half maintaining its properties:
   Net finance expense                                    0.81      0.67
                                                                                                 -    R&M totalled $0.42m - expensed at the property level, therefore
  EBITDA                                                  6.94      5.97       16%                    already deducted from NOI
                                                                                                 -    SIBC totalled $0.29m - initially capitalised to the balance sheet and
   Net corporate overheads and other                      2.43      2.05       19%                    captured in asset revaluations / written off

  Operating and Development Net Income                    9.37      8.02       17%

                                                                                                                                                                              35
Statutory Accounts Extract: Statement of Profit and Loss
                                                                                                                       ^

                                                                                                         ^

                 ^The above should be read in conjunction with the accompanying notes contained in the financial statements   36
Statutory Accounts Extract: Balance Sheet
                                     ^
                                         ^
                                 ^

                                                                                                                                                          37
                                             ^The above should be read in conjunction with the accompanying notes contained in the financial statements
Statutory Accounts Extract: Cash Flow Statement

                                                  38
Statutory Accounts Extract: Segment Information

                                                  39
Appendix C

                                                                                                                  ESG

Highway 1 Caravan and Tourist Park, Bolivar South, SA – installed Xodboxes which are highly energy efficient

                                                                                                                            40
Environmental, Social and Corporate Governance Program
Social

•   Aspen improves society and reduces inequality by providing quality accommodation on affordable terms to a wide variety of Australian households in residential, retirement and park communities. We typically
    rent dwellings for under $400 per week and land sites for under $200 per week and sell new houses at our land lease communities for under $400,000.

•   We support our customers in a variety of ways so that they can live happier and healthier lives. For instance, we foster a social, diverse and inclusive culture in our communities by providing on-site
    management, customer services and community spaces and facilities. This gives our customers a sense of home and meaningful connections to the community.

•   Some of our properties are located in past and present Indigenous communities and we actively seek to help these communities and conserve heritage items. For instance, to help protect the Barlings Beach
    Aboriginal Place, we recently completed an archaeological dig within our Barlings Beach park community with the assistance of the Mogo Local Aboriginal Land Council. Another example is the protection and
    proposed public display of an Aboriginal Scar Tree within our Mount Barker property.

•   As a part of Aspen’s desire to provide access to quality accommodation to those in need ‘‘Aspen Social’’ has been launched. Aspen recognises the shortage of affordable housing is most acute at the social end
    in every state and territory in Australia. This initiative aims to assist the providers of social housing by donating a proportion of our residential dwellings net rent free.

Environmental

•   Looking after the environment, today and for future generations is essential. We recognise the need to continually reduce environmental impacts, work towards sustainable resource use and ensure emissions
    are at or below levels that can be reabsorbed without harm.

•   Aspen has a carbon emission reduction target for the assets that it controls that is in accordance with the 2015 Paris Agreement.

•   In reviewing our environmental performance and objectives we consider not only the impact of our own operations but the performance of the dwellings within our communities that are owned by our
    customers. We continually embrace new technologies to deliver innovative products and services to our customers whilst minimising costs and our ecological footprint.

•   Reduced resource use, energy intensity and CO2 emissions are inherent in Aspen’s business model because we provide accommodation with some or all the following attributes:
    o Communal living – more efficient sharing of resources such as living, dining, entertaining and recreational spaces, and transport (community bus)
    o Dwelling size less than half the Australian average for new homes – about 40% of household energy use is for temperature control (heating and cooling) and this is proportional to floorspace
    o New homes and community facilities with improved building techniques, designs and materials that must meet current regulated building standards including energy efficiency (eg. replacing obsolete
      vans/annexes with highly insulated Xodboxes that require significantly less energy to operate)
    o Renewable energy installations such as rooftop solar, solar-boosted gas/electric water heaters and solar street lighting - we intend to install batteries at our properties if they become economic for our
      customer base
    o Water saving devices and recycling - clean water requires energy to produce and distribute
    o Community gardens - local food production reduces transport requirements and absorbs CO2

                                                                                                                                                                                                                      41
Environmental, Social and Corporate Governance Program
Environmental (continued)
    o   Recycling and composting facilities - composting food reduces CO2 emissions relative to burying food
    o   Relatively high levels of vegetation that absorbs CO2
    o   Replacing our vehicles with more efficient or electric/hybrid versions when appropriate
    o   Metering – making customers more aware of their electricity, gas and water use and charging directly for it to influence behaviour

Governance

•   Aspen Group comprises the stapled head entities Aspen Group Limited (AGL) and Aspen Property Trust. AGL is a company with a Board of Directors. Aspen Property Trust is a trust governed by a Responsible
    Entity, Evolution Trustees Limited which is independent from AGL and has its own Board. Between the two entities’ Boards, there are currently 6 members of which 4 are considered independent. The only
    member of AGL’s Board who is considered non-independent is the Joint Chief Executive Officer by virtue of his executive role and substantial shareholding in Aspen Group.

•   Aspen's governance framework is led by the AGL Board and the senior executives. They currently focus on the following from a sustainability perspective:

    o The health and safety of employees, contractors, customers and visitors

    o Legal and regulatory requirements

    o Environmental impacts

    o Stakeholder engagement

•   The Board has ultimate responsibility for ensuring that Aspen’s sustainability strategies are robust and that systems are in place for managing Aspen's key areas of sustainability risk and opportunity.

•   Our senior executives ensure that the organisation continues to perform in a way that demonstrates integrity on our environmental position, our commitment to the communities in which we operate and
    the opportunities we provide for our people and business partners to contribute to current and future generations.

•   Our current Key Management Personnel are the Joint Chief Executive Officers. They are aligned to the long-term performance of Aspen Group through their substantial personal shareholdings and the
    structure of their remuneration packages where 50% of total remuneration is deferred for up to 3 years and subject to vesting conditions including qualitative and quantitative performance measures.

Further information on Aspen’s ESG program including our approach to sustainable procurement, employees, and OH&S is available on our company website.

                                                                                                                                                                                                                42
Appendix D

                                 Distribution & Tax
                                       History

Tween Waters Holiday Park, NSW

                                                      43
Distribution & Tax History
                                                                                                             Aspen Group Ltd     Aspen Property Trust1
                                                                                                                                                                  Total Amount Paid
 Period / Quarter Ended                     Payment Date                            Distribution Type
                                                                                                                                             Tax Deferred / Non          CPS
                                                                                                                  CPS          CPS
                                                                                                                                             assessable income

             Dec-17                           28/02/2017                                  Ordinary                  -          2.10                      -              2.10

             Jun-17                           29/08/2017                                  Ordinary                  -          2.50                      -              2.50

             Oct-17                           20/10/2017                              Special Capital               -          5.00                100.0%               5.00

             Dec-17                           27/02/2018                                  Ordinary                  -          2.10                31.4%                2.10

             Jun-18                           30/08/2018                                  Ordinary                  -          2.10                30.5%                2.10

             Dec-18                           26/02/2019                                  Ordinary                  -          2.30                45.7%                2.30

             Jun-19                           30/08/2019                                  Ordinary                  -          2.70                43.3%                2.70

             Dec-19                           28/02/2020                                  Ordinary                  -          2.75                56.5%                2.75

             Jun-20                           28/08/2020                                  Ordinary                  -          3.25                69.8%                3.25

             Dec-20                           25/02/2021                                  Ordinary                  -          3.10                70.7%                3.10

             Jun-21                           20/08/2021                                  Ordinary                  -          3.50                82.0%                3.50

             Dec-21                           25/02/2022                                  Ordinary                  -          3.10                85.0%                3.10

                                                 Aspen Group Ltd                      Aspen Property Trust
          30 June 2021
                                                     Gross ($m)                                Gross ($m)
  Revenue tax losses                                      69.3                                     -
  Capital tax losses                                      39.5                                     -
1. APT has elected to adopt the Attribution Managed Investment Trust regime from 1 July 2016
                                                                                                                                                                                      44
Disclaimer

This presentation has been prepared by Aspen Group Limited on behalf
of Aspen Group Limited and Aspen Property Trust (“Aspen”) and should
not be considered in any way to be an offer, invitation, solicitation or
recommendation with respect to the subscription for, purchase or sale of
any security, and neither this document nor anything in it shall form the
basis of any contract or commitment. Prospective investors should
make their own independent evaluation of an investment in Aspen.
Nothing in this presentation constitutes investment, legal, tax or other
advice. The information in this presentation does not take into account
your investment objectives, financial situation or particular needs. The
information does not purport to constitute all of the information that a
potential investor may require in making an investment decision.
Aspen has prepared this presentation based on information available to
it. No representation or warranty, express or implied, is made as to the
fairness, accuracy, completeness or correctness of the information,
opinions and conclusions contained in this presentation. To the
maximum extent permitted by law, none of Aspen, its directors,
employees or agents, nor any other person accepts any liability,
including, without limitation, any liability arising from fault or negligence
on the part of any of them or any other person, for any loss arising from
the use of this presentation or its contents or otherwise arising in
connection with it.
This presentation contains forward looking information. Indications of,
and guidance on, future earnings, distributions and financial position and
performance are forward looking statements.               Forward looking
statements are based on Aspen’s current intentions, plans,
expectations, assumptions, and beliefs about future events and are
subject to risks, uncertainties and other factors which could cause actual
results to differ materially. Aspen and its related bodies corporate and
their respective directors, officers, employees, agents, and advisers do
not give any assurance or guarantee that the occurrence of any forward-
looking information, view or intention referred to in this presentation will
actually occur as contemplated. All references to dollar amounts are in
Australian currency.
You can also read