ART in Europe, 2014: results generated from European registries by ESHRE
←
→
Page content transcription
If your browser does not render page correctly, please read the page content below
Human Reproduction, Vol.33, No.9 pp. 1586–1601, 2018
Advanced Access publication on July 19, 2018 doi:10.1093/humrep/dey242

                                    ESHRE PAGES

                                    ART in Europe, 2014: results generated
                                                                       †
                                    from European registries by ESHRE
                                    The European IVF-monitoring Consortium (EIM)‡ for the European Society of
                                    Human Reproduction and Embryology (ESHRE)

                                                                                                                                                                                           Downloaded from https://academic.oup.com/humrep/article/33/9/1586/5055580 by guest on 08 February 2022
                                    Ch. De Geyter1,2,*, C. Calhaz-Jorge3, M.S. Kupka4, C. Wyns5,
                                    E. Mocanu6, T. Motrenko7, G. Scaravelli8, J. Smeenk9, S. Vidakovic10,
                                    and V. Goossens2
                                    1
                                      Institute of Reproductive Medicine and Gynecological Endocrinology (RME), Vogesenstrasse 134, CH-4031 Basel, Switzerland 2ESHRE
                                    Central Office, Meerstraat 60, Grimbergen 1852, Belgium 3CNPMA, assembleia da Republica, Palacio de Sao Bento, Lisboa 1249-068,
                                    Portugal 4Gynaekologicum Hamburg, Gynaecology and Obstetrics, Altonaer Strasse 59, Hamburg 20357, Germany 5Cliniques Universitaires
                                    Saint Luc, Université Catholique de Louvain, Av. Hippocrate, 10, Brussels 1200, Belgium 6Human Assisted Reproduction Ireland Rotunda
                                    Hospital, HARI Unit, Master’s House, Parnell Square, 1 Dublin, Ireland 7Medical Centre Cetinje, Human Reproduction Department, Vuka
                                    Micunovica 4, Cetinje 81310, Montenegro 8Istituto Superiore di Sanità, Registro Nazionale della Procreazione Medicalmente Assistita,
                                    CNESPS, Viale Regina Elena, 299, Roma 00161, Italy 9Department of Obstetrics and Gynaecology, St Elisabeth Hospital Tilburg, Hilv, The
                                    Netherlands 10Institute for Obstetrics and Gynecology, Clinical Center Serbia ‘GAK’, Visegradska 26, Belgrade 11000, Serbia

                                    *Correspondence address. Institute of Reproductive Medicine and Gynecological Endocrinology (RME), Vogesenstrasse 134, CH-4031 Basel,
                                    Switzerland. Tel: +41-61-265-9315; E-mail: c.degeyter@unibas.ch

                                    Submitted on May 4, 2018; accepted on June 18, 2018

    STUDY QUESTION: What are the European trends and developments in ART and IUI in 2014 as compared to previous years?
    SUMMARY ANSWER: The 18th ESHRE report on ART shows a continuing expansion of both treatment numbers in Europe and more
    variability in treatment modalities resulting in a rising contribution to the birth rates in most participating countries.
    WHAT IS KNOWN ALREADY: Since 1997, ART data generated by national registries have been collected, analysed by the European
    IVF-monitoring (EIM) Consortium and reported in 17 manuscripts published in Human Reproduction.
    STUDY DESIGN, SIZE, DURATION: Continuous collection of European data by the EIM for ESHRE. The data for treatments per-
    formed in 2014 between 1 January and 31 December in 39 European countries were provided by national registries or on a voluntary basis
    by clinics or professional societies.
    PARTICIPANTS/MATERIALS, SETTING, METHODS: From 39 countries and 1279 institutions offering ART services, a total of
    776 556 treatment cycles, involving 146 148 with IVF, 362 285 with ICSI, 192 027 with frozen embryo replacement (FER), 15 894 with PGT,
    56 516 with egg donation (ED), 292 with IVM and 3404 with frozen oocyte replacement (FOR) were reported. European data on IUI using
    husband/partner’s semen (IUI-H) and donor semen (IUI-D) were reported from 1364 institutions offering IUI in 26 countries and 21 coun-
    tries, respectively. A total of 120 789 treatments with IUI-H and 49 163 treatments with IUI-D were included.
    MAIN RESULTS AND THE ROLE OF CHANCE: In 14 countries (17 in 2013), where all institutions contributed to their respective
    national registers, a total of 291 235 treatment cycles were performed in a population of ~208 million inhabitants, corresponding to 1925
    cycles per million inhabitants (range: 423–2978 per million inhabitants). After treatment with IVF the clinical pregnancy rates (PR) per aspir-
    ation and per transfer were marginally higher in 2014 than in 2013, at 29.9 and 35.8% versus 29.6 and 34.5%, respectively. After treatment
    with ICSI the PR per aspiration and per transfer were also higher than those achieved in 2013 (28.4 and 35.0% versus 27.8 and 32.9%,
    respectively). After FER with own embryos the PR continued to rise, from 27.0% in 2013 to 27.6% in 2014. After ED a similar trend was
    observed with PR reaching 50.3% per fresh transfer (49.8% in 2013) and 48.7% for FOR (46.4% in 2013). The delivery rates (DR) after IUI

†
 ESHRE Pages content is not externally peer reviewed. This article has been approved by the Executive Committee of ESHRE.
‡
 EIM Committee 2017–2019: chairman: C.D.; chairman elect: C.W.; past chairman: C.C.-J. members: M.K., E.M., T.M., G.S., J.S. and S.V., V.G. is a science manager at ESHRE Central Office,
Brussels. See also Appendix for contributing centres and contact persons representing the data collection programmes in the participating European countries.
   The main results of this report were presented at the annual ESHRE congress in Geneva, July 2017.

© The Author(s) 2018. Published by Oxford University Press on behalf of the European Society of Human Reproduction and Embryology. All rights reserved.
For Permissions, please e-mail: journals.permissions@oup.com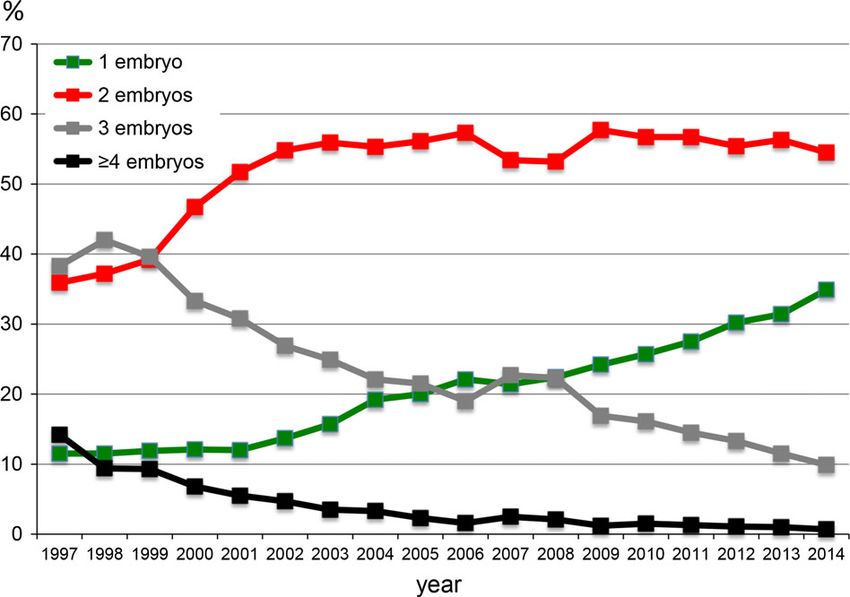
ART in Europe, 2014                                                                                                                                            1587

   remained stable at 8.5% after IUI-H (8.6% in 2013) and at 11.6% after IUI-D (11.1% in 2013). In IVF and ICSI together, 1, 2, 3 and ≥4 embryos
   were transferred in 34.9, 54.5, 9.9 and in 0.7% of all treatments, respectively (corresponding to 31.4%, 56.3, 11.5% and 1% in 2013). This
   evolution in embryo transfer strategy in both IVF and ICSI resulted in a singleton, twin and triplet DR of 82.5, 17.0 and 0.5%, respectively
   (compared to 82.0, 17.5 and 0.5%, respectively, in 2013). Treatments with FER in 2014 resulted in a twin and triplet DR of 12.4 and 0.3%,
   respectively (versus 12.5 and 0.3% in 2013). Twin and triplet DR after IUI were 9.5 and 0.3%, respectively, after IUI-H (in 2013:9.5 and 0.6%)
   and 7.7 and 0.3% after IUI-D (in 2013: 7.5 and 0.3%).
   LIMITATION, REASONS FOR CAUTION: The method of data collection and reporting varies among European countries. The EIM
   receives aggregated data from various countries with variable levels of completeness. Registries from a number of countries have failed to
   provide adequate data about the number of initiated cycles and deliveries. As long as incomplete data are provided, the results should be
   interpreted with caution.
   WIDER IMPLICATIONS OF THE FINDINGS: The 18th ESHRE report on ART shows a continuing expansion of treatment numbers in

                                                                                                                                                                         Downloaded from https://academic.oup.com/humrep/article/33/9/1586/5055580 by guest on 08 February 2022
   Europe. The number of treatments reported, the variability in treatment modalities and the rising contribution to the birth rates in most par-
   ticipating countries point towards the increasing impact of ART on reproduction in Europe. Being the largest data collection on ART, the
   report gives detailed information about ongoing developments in the field.
   STUDY FUNDING/COMPETING INTEREST(S): The study has no external funding and all costs are covered by ESHRE. There are no
   competing interests.

   Key words: IVF / ICSI / IUI using partner’s semen / IUI using donor semen / egg donation / frozen embryo replacement / insemination /
   surveillance / vigilance / registry

                                                                                          The data were assembled similarly as in the previous reports making the
Introduction                                                                           results comparable. As usual, footnotes to the tables provide additional infor-
This is the 18th annual report of the European IVF-monitoring Consortium               mation on diverging results reported by individual countres, when applicable.
(EIM) under the umbrella of ESHRE containing the data on ART reported                     The terminology used was based on the glossary of The International
by 39 participating European countries in 2014 (Supplementary Data).                   Committee for Monitoring Assisted Reproductive Technology (ICMART)
                                                                                       (Zegers-Hochschild et al., 2017).
   Seventeen previous reports, all published in ‘Human Reproduction’
(https://www.eshre.eu/Data-collection-and-research/Consortia/EIM/
Publications.aspx), covered treatment cycles from 1997 to 2013. As in                  Results
previous reports, the printed version contains the five most relevant
tables. Nineteen additional Supplementary tables are available online.                 Participation and data completeness
The settings of the data are consistent with those published in the previ-
                                                                                       In Table I the number of institutions or clinics offering ART services
ous reports, allowing good comparison with earlier trends.
                                                                                       and those performing IUI are listed together with all available treat-
                                                                                       ment modalities. In comparison to the 2013 data (Calhaz-Jorge et al.,
                                                                                       2017) not only the numbers of reporting clinics has increased (1169 in
Materials and Methods                                                                  2013 to 1279 in 2014, +9.5%), but also the overall number of
Aggregated data on various forms of ART were provided by 39 European                   reported treatments (686 271 in 2013 to 776 556 in 2014, +13.1%).
countries, covering the following treatment modalities: IVF, ICSI, frozen              Among the 51 European countries, nine are not members of the EIM
embryo replacement (FER), egg donation (ED), IVM, and pooled data on pre-              Consortium (Supplementary Table SI), most being very small countries
implantation genetic testing (PGT) and frozen oocyte replacement (FOR). In             not offering ART services. Bosnia-Herzegovina resumed their partici-
addition, data on IUI using either husband’s/partner’s semen (IUI-H) or                pation. Armenia became a member of the EIM Consortium but has
donor semen (IUI-D) were included. The report includes treatments started              not yet provided any data to the Consortium, and neither did Turkey
between 1 January and 31 December in 2014. Data on pregnancies and deliv-
                                                                                       and Slovakia. Among the 42 members, 39 have sent in their data
eries are derived from follow-up of the treatments performed in 2014. Each
                                                                                       (92.9%) and in 14 countries (35.8%) all ART centres have reported
national register is informed about the need to obtain signed informed con-
sent prior to the initiation of infertility treatment from each infertile individual   complete data sets. Currently, 1280 clinics report their data (87.6% of
for whom data have to be reported to the national registry.                            all known clinics in Europe, 85.4% in 2013). The European countries
   For the collection of the data, the national representatives of 41 coun-            with the largest treatment numbers in 2014 are Spain (109 275 treat-
tries were asked to fill out questionnaires and data were transmitted                   ments), Russia (94 985), France (90 434) and Germany (81 177).
through a software package, specially designed for the requirements of this
data collection (Dynamic Solutions, Barcelona, Spain). The same sets of                Reporting methods and size of the clinics
data as in 2013, consisting of six different modules, were requested as in
2014. The software performs all calculations automatically and evaluates               Among the countries with complete coverage of data reporting there
the plausibility of all results. If inconsistencies are detected, the administra-      is a clear preponderance of registries to which reporting is compulsory
tor of the ESHRE central office (V.G.) contacts the national representative             (13 out off 15), although among those countries with incomplete data
for clarifications.                                                                     sets six require compulsory data reporting by the local national health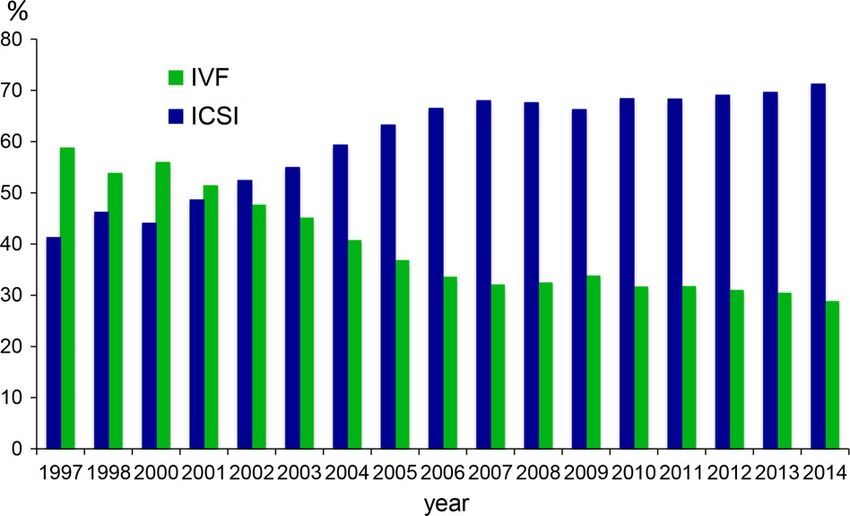
1588 De Geyter et al.
authorities (Supplementary Table SIII). Mainly in countries with incom- with incomplete coverage) (Supplementary Table SIII). Individual
plete coverage, personal initiatives continue to play a major role (seven cycle reporting is being carried out in seven countries with full
countries), as do medical organizations (in 13 countries). data coverage and in nine countries with incomplete coverage of
Aggregate data submission by single ART institutions to the the reported cycles.
respective national registries is still the most commonly used There is a large variability in the size of reporting institutions, as
method (8 in 17 countries with full coverage, 16 in 25 countries defined by the number of treatment cycles (Supplementary Table SII).
Table I Treatment frequencies after ART in European countries in 2014.
IVF clinics in the country Cycles/million*
..................................................................................................................................... ...............................
Country IVF Included IUI Included IVF ICSI FER PGD ED IVM FOR All Women Population
Downloaded from https://academic.oup.com/humrep/article/33/9/1586/5055580 by guest on 08 February 2022
clinics IVF labs IUI labs 15-45
clinics
.............................................................................................................................................................................................
Albania 8 1 8 1 0 96 44 0 11 0 2 153
Austria 30 28 897 4773 1656 7326
Belarus 5 4 8 4 1512 1064 130 25 8 0 0 2739
Belgium 18 18 34 29 3220 13 457 10 677 581 853 57 28 845 13 568 2510
Bosnia- 0 531 67 0 0 0 0 598
Herzegovina
Bulgaria 32 4 0 388 4199 1230 37 460 0 6314
Croatia 13 7 15 13 897 865 311 0 0 0 42 2115
Cyprus 7 6 212 933 316 28 250 1739
Czech Republic 42 42 13 280 9059 1552 4868 28 759 13 919 2694
Denmark 21 21 58 55 6542 5322 3898 126 256 0 23 16 167 15 449 2884
Estonia 5 5 5 5 636 1183 887 0 178 0 0 2884 12 828 2304
Finland 19 19 24 24 2484 2066 3384 21 687 0 8642 8831 1566
France 101 100 191 188 20 638 40 295 27 214 1039 1047 201 90 434
Germany 133 129 13 672 45 612 21 893 81 177
Greece 44 44 44 44 3359 12 404 3216 481 4622 4 34 24 120 12 162 2240
Hungary 13 11 1184 3866 437 20 119 5626
Iceland 1 1 1 1 189 166 241 0 110 0 0 706 10 344 2978
Ireland 7 3 7 3 623 505 385 0 0 1513
Italy 200 200 362 362 7695 48 010 9501 1895 156 1639 68 896 6173 1109
Kazakhstan 23 6 23 6 1013 1286 974 179 484 0 1 3937
Latvia 5 3 5 3 462 480 301 3 144 1390
Lithuania 6 4 7 4 200 152 29 381
Macedonia 9 5 9 5 388 1457 117 25 1987
Malta 2 2 2 0 0 135 0 0 0 0 41 176 2218 423
Moldova 4 3 7 3 250 501 86 0 6 0 0 843
Montenegro 5 4 5 4 425 17 442
Norway 10 10 9 9 3167 2959 4799 0 0 10 925 10 662 2054
Poland 37 29 30 899 13 735 7775 325 756 24 80 23 594
Portugal 25 25 26 26 2228 3433 1556 69 493 1 6 7786 3844 718
Romania 19 13 19 13 1201 1218 843 93 2 3357
Russia 167 133 133 29 136 38 334 19 524 2013 5619 45 314 94 985
Serbia 18 1 18 1 126 147 5 0 0 0 0 278
Slovenia 3 3 3 3 936 2441 1288 8 8 1 2 4684 12 959 2375
Spain 245 225 349 272 5491 46 100 21 007 5242 30 576 14 845 109 275
Sweden 17 16 0 5938 5894 5771 263 347 18 213
Switzerland 29 27 930 4519 4473 9922
The Nederlands 13 13 6537 7578 10 505 521 25 141 8098 1472
ContinuedART in Europe, 2014 1589
Table I Continued
IVF clinics in the country Cycles/million*
..................................................................................................................................... ...............................
Country IVF Included IUI Included IVF ICSI FER PGD ED IVM FOR All Women Population
clinics IVF labs IUI labs 15-45
clinics
.............................................................................................................................................................................................
Ukraine 38 32 18 18 1886 8629 4806 496 1144 22 16 983
UK 82 82 107 107 21 212 24 235 13 595 970 3196 2 294 63 504 5278 980
All 1456 1279 1364 1366 146 148 36 2285 192 017 15 894 56 516 292 3404 776 556 7623 1927
Bosnia Herzegovina consists of two parts: the Federation part and the Republic of Srpska.
Treatment cycles in IVF and ICSI refer to initiated cycles.
Downloaded from https://academic.oup.com/humrep/article/33/9/1586/5055580 by guest on 08 February 2022
For Albania, Austria, Belgium, Czech Republic, France, Germany, Iceland, Latvia, Lithuania, Macedonia and Montenegro treatment cycles refer to aspirations. For Austria, Belgium
and France the total number of initiated cycles was only available for IVF and ICSI together, being 5993, 19 570 and 68 202, respectively.
For the Czech Republic, no distinction between IVF and ICSI is made. All cycles are counted as ICSI. For Belgium there are 766 aspiration cycles for which it is not known whether IVF
or ICSI was performed.
Treatment cycles in FER refer to thawings.
For Czech Republic, Finland, Hungary, Romania, Sweden and The Netherlands treatment cycles refer to transfers.
Treatment cycles in PGD contain both fresh and frozen cycles and refer to initiated cycles in the fresh cycles (except for Finland and Hungary where it refers to aspirations) and thaw-
ings in the frozen cycles (except for The Netherlands where it refers to transfers).
Treatment cycles in ED refer to donation cycles and contain fresh and frozen cycles.
ED fresh: For France, Iceland and Latvia treatment cycles refer to aspirations, for Italy it refers to transfers. ED FOR: For France and Italy treatment cycles refer to transfers. ED FER:
For Finland, France, Italy, Romania and Sweden treatment cycles refer to transfers.
Treatment cycles in IVM refer to aspirations.
Treatment cycles in FOR refer to thawings.
Women of reproductive age and population were found at the following link: http://www.census.gov/population/international/data/idb/region.php
Clinics with cycle numbers between 200 and 499 are the most com-
Table II Number of institutions offering ART services,
mon (29.6%). When compared to previous EIM reports, there is an
treatment cycles and infants born after ART in Europe,
ongoing trend towards more large institutions (≥1000 cycles, 18.3% in
1997–2014.
2014 versus 17.8% in 2013 and 16.9% in 2012).
Seventeen countries (Austria, Belgium, Croatia, Denmark, Finland, Year Countries Clinics Cycles Cycle Infants
France, Germany, Italy, Kazakhstan, Macedonia, Norway, Poland, increase (%) born
Portugal, Spain, Sweden, Switzerland and UK) reported some kind of ........................................................................................
1997 18 482 203 225 35 314
data validation process.
1998 18 521 232 225 +14.3 21 433
Public access to individual clinic data was available only in nine coun-
tries: Albania, Estonia, Ireland, Macedonia, Romania, Slovenia, Spain, 1999 21 537 249 624 +7.5 26 212
Sweden and the UK. Pharmaceutical industries or professional societies 2000 22 569 275 187 +10.2 17 887
provided additional financial support for the national registration in 26 2001 23 579 289 690 +5.3 24 963
countries. In five countries the centres covered part of the expenses, 2002 25 631 324 238 +11.9 24 283
while in five countries (Albania, Federation of Bosnia and Herzegovina, 2003 28 725 365 103 +12.6 68 931
Poland, Switzerland, The Netherlands) all the expenses were covered 2004 29 785 367 056 +0.5 67 973
by the centres alone. This information is missing in eight countries. 2005 30 923 419 037 +14.2 72 184
2006 32 998 458 759 +9.5 87 705
Number of treatment cycles per technique 2007 33 1029 493 420 +7.7 96 690
and availability 2008 36 1051 532 260 +7.9 107 383
In 2014 a total number of 776 556 treatment cycles were reported 2009 34 1005 537 463 +1.0 109 239
to EIM (90 285 more than in 2013, +13.1%) (Table I). Since the 2010 31 991 550 296 +2.4 120 676
beginning of its activities EIM has now recorded a total of more than 2011 33 1314 550 296 +11.3 134 106
8 million treatments with ART leading to the birth of nearly 1.5 mil- 2012 34 1354 609 973 +4.9 143 844
lion infants (Table II). The most common technique is ICSI (362 285
2013 38 1169 686 271 +7.2 149 466
cycles, 46.6%) followed by FER (192 017, 24.7%) and IVF (146 148,
2014 39 1279 776 556 +13.1 170 163
18.8%). Compared to 2013, all treatment modalities numbers have
Total 8 010 527 1 478 452
increased, except frozen oocyte replacement (FOR). The steepest
increase in treatment numbers since 2013 is observed in PGT
(+62.3%) and ED (+40.4%). A number of countries reported fewer
treatment cycles (Croatia, Cyprus, Estonia, Germany, Hungary, fewer clinics participating. Two countries reported a large increment
Iceland, Ireland, Kazakhstan, Moldova, Montenegro, Slovenia, in treatment numbers (Russia and Spain), both with many more ART
Sweden and the UK). Croatia, Germany, Hungary and Modova had institutions participating in the data collection.1590 De Geyter et al.
Downloaded from https://academic.oup.com/humrep/article/33/9/1586/5055580 by guest on 08 February 2022
Figure 1 Proportion of IVF versus ICSI in Europe, 1997–2014.
Among the total of 508 433 fresh treatments (ICSI+IVF), 71.3% Taking all data together (Table II), the PR per aspiration were similar
were performed with ICSI, showing a rise of +1.66% compared with in both IVF and ICSI, 29.3 and 27.2%, respectively, as were the DR,
2013. The preponderance of ICSI over conventional IVF has become 22.3 and 20.1%, respectively. The PR and DR after thawing of embryos
more pronounced in recent years (Fig. 1). were 27.6 and 19.3%, respectively. The total number of ART infants
As in previous years, with 192 017 treatments, FER is rapidly gaining born in 2014 after all techniques amounted to 170 163, a marked
ground (+24.1%) but the relative proportion to fresh treatments was increase of 13.8% (total number of children born in 2013: 149 466).
stable (37.8% in 2014 and 38.3% in 2013), Switzerland being the coun- For the first time, information about ‘freeze all’ cycles was collected
try with the highest proportion of FER (82.1%) and Serbia with the (Supplementary Table SV). Freeze all was carried out at the oocyte
lowest (1.8%). level in eight countries (20.5%), and at the embryonic level in 18 coun-
Availability of ART in any particular country is calculated by dividing tries (46.1%). The registered data demonstrate that freeze all was the
the number of treatment cycles by the number of women of repro- decision in 3080 (0.6%) of all IVF+ICSI cycles (at the oocyte level) and
ductive age (15–45 years) (Supplementary Table SIV). Availability can in 23 567 (4.8%) at the embryonic level.
only be calculated in the 14 countries with full coverage. In those 14 Detailed accounts of cycle numbers, aspirations, transfers, pregnan-
countries a huge variability in availabilty was observed, ART being cies, and deliveries in IVF, ICSI and FER (after both IVF and ICSI) are
most available in Denmark, and least available in Malta. As a result the given in the Supplementary Tables SV–SVII.
proportion of newborns resulting from ART born in Denmark was ED data are given by 22 of 39 participating countries (55%)
6.4% of all newborns in that country and 0.9% in Malta. (Supplementary Table SVIII). In most of the other countries this technol-
ogy is not being performed for legal reasons. Most donation cycles were
Pregnancies and deliveries after treatment carried out in Spain, Russia and the Czech Republic, with 12 632, 3672
and 4924 cycles, respectively. Some of 29 965 ED cycles were carried
Table III lists pregnancy rates (PR) and delivery rates (DR) after IVF or
out with freshly collected oocytes (22, 100%), some with frozen oocytes
ICSI and after FER (regardless of the technique). As in previous
(FOR). PR were only available per embryo transfer (ET), but were con-
reports, data on the number of initiated cycles were incomplete. For
siderably higher with freshly donated oocytes (50.3%) than after thawing
that reason we calculated outcome data per aspiration. All 39 partici-
of oocytes (37.7%). The differences among countries were consider-
pating countries were able to provide pregnancy and delivery data
able, ranging between 15.1 and 66.7%. A total of 17 259 deliveries were
after aspiration, but seven countries failed to provide those after FER
counted, which considerably exceeds the 11 861 deliveries counted in
(completeness rate: 82.5%). Complete coverage data on both preg-
2013 (+45.5%). This increment is due to higher numbers of reported
nancies and deliveries were provided by 14 countries (Supplementary
deliveries in Spain (+45.1%) and Russia (+47.4%).
Table SIV). As shown in Table II, the number of infants born after any
method was not provided in five countries (completeness rate:
87.5%). As in earlier reports, the PR and DR (all treatment modalities Age distribution
included) varied significantly from one country to another, PR ranging As in previous reports, the age distribution of women treated with IVF
from 17.1 to 53.1%, DR ranging from 7.9 to 37.8% (except Hungary, and ICSI varied among different countries (Supplementary Tables SIX
reporting no deliveries per aspiration for ART). After FER the DR var- and SX). Not all countries were able to provide data on the age distri-
ied between 5.1 and 41.2%. bution in ICSI and in IVF, some because no IVF treatments wereART in Europe, 2014
Table III Results after ART in 2014.
IVF ICSI FER
............................................................................. .......................................................... .......................................................
Country Initiated Aspirations Pregnancies per Deliveries per Aspirations Pregnancies per Deliveries per Thawings Pregnancies Deliveries per ART ART infants per
cycles IVF + aspiration (%) aspiration (%) aspiration (%) aspiration (%) FER per thawing thawing (%) infants national births (%)
ICSI (%)
Downloaded from https://academic.oup.com/humrep/article/33/9/1586/5055580 by guest on 08 February 2022
..........................................................................................................................................................................................................................................................
Albania 96 96 39.6 35.4 44 38.6 31.8 62
Austria 897 32.8 28.1 4773 31.5 27.4 1656 34.0 29.5 4634 5.7
Belarus 2576 1451 37.2 30.5 1059 40.4 37.8 130 32.3 18.5 1093 0.9
Belgium 3220 26.6 19.4 13 457 25.6 18.5 10 677 23.4 16.5 5763 4.6
Bosnia- 531 520 30.2 21.9 67 29.8 17.8 166
Herzegovina
Bulgaria 4587 225 24.4 18.2 3940 20.8 15.3 1230 33.8 26.7 1246 1.8
Croatia 1762 1314 18.7 14.1 1658 22.4 16.4 311 26.7 17.4 569
Cyprus 1145 203 36.0 22.2 897 37.2 25.1 316 37.7 30.1
Czech 13 280 12 864 27.5 18.0 6234 5.7
Republic
Denmark 11 864 6233 22.5 19.5 5319 26.5 23.5 3898 22.1 19.0 3613 6.4
Estonia 1819 625 26.9 20.6 1175 24.9 19.4 887 13.8 8.2 548 4.0
Finland 4550 2327 29.2 22.0 1999 23.9 18.7 1807 3.1
France 20 638 23.8 18.9 40 295 25.0 20.2 27 214 21.3 15.7 19 113 2.3
Germany 59 284 13 672 28.8 20.6 45 612 28.1 20.6 21 893 23.6 16.2 14 976 2.1
Greece 15 763 2799 31.2 17.1 11 945 29.8 16.2 3216 33.0 17.4 5409 5.9
Hungary 5050 1179 28.8 0.0 3857 25.0 0.0
Iceland 189 30.2 23.8 166 27.1 22.9 241 27.8 18.3 163 3.7
Ireland 1128 507 43.8 34.9 460 40.9 33.5 385 31.9 20.8 469 0.7
Italy 55 705 6898 23.2 16.2 43 896 21.0 14.0 9501 25.8 18.4 11 272 2.2
Kazakhstan 2299 916 36.0 23.6 1105 41.0 25.0 974 39.9 26.9 864
Latvia 462 25.8 18.2 480 19.8 7.9 301 23.3 15.0 163
Lithuania 200 35.5 31.0 152 31.6 27.6 29 24.1 20.7 133 0.4
Macedonia 388 53.1 14.4 1457 41.2 23.3 117 18.8 5.1 483
Malta 135 125 28.8 27.2 41 0.9
Moldova 751 246 40.7 31.7 492 43.5 31.7 86 32.6 26.7
Montenegro 425 422 25.6 21.6 17 47.1 41.2 118 1.6
Norway 6126 3125 30.0 24.6 2909 28.3 23.8 4799 13.9 10.4
Poland 14 634 884 30.9 26.9 13 615 30.5 20.9 7775 29.1 17.7 5203 1.4
Portugal 5661 2146 32.0 23.7 3303 27.7 21.3 1556 32.2 23.0 2155 2.6
Romania 2419 1163 39.0 27.8 1184 36.3 28.3 1147 0.6
Russia 67 470 28 297 32.2 23.4 37 301 27.5 19.6 19 524 36.2 23.4 25 034 1.3
Serbia 273 116 30.2 27.6 144 37.5 29.9 5 80.0 80.0 103 0.2
Slovenia 3377 895 36.2 28.6 2378 25.1 19.4 1288 29.8 23.1 1124 5.4
Spain 51 591 4935 28.8 19.7 41 417 26.9 18.6 21 007 32.0 20.0 27 320 6.4
1591
Continued1592 De Geyter et al.
carried out. The highest percentage of women aged 40 years and older
..........................................................................................................................................................................................................................................................
For IVF and ICSI there were for Belarus, Croatia, Czech Republic, Finland, Germany, Greece, Latvia, Lithuania, Macedonia, Poland, Portugal, Romania, Russia and Spain respectively 75, 3, 6, 886, 10, 22, 8, 49, 38, 15, 6, 62, 1019 and 2 deliveries with unknown outcome. These were
For FER there were for Austria, Czech Republic, Finland, France, Greece, Latvia, Lithuania, Macedonia, Poland, Romania and Russia, respectively, 488, 7, 694, 5, 8, 45, 2, 3, 28, 21 and 283 deliveries with unknown outcome. These were accepted as singletons to calculate the ART
undergoing aspiration for IVF was found in Greece (as in 2013),
national births (%)
ART infants per whereas the highest percentage of women agedART in Europe, 2014 1593
Table IV Number of embryos transferred after ART and deliveries in 2014.
IVF + ICSI FER
...............................................................................................................................
Country Transfers 1 embryo 2 embryos 3 embryos 4+ embryos Deliveries Twin Triplet Deliveries Twin Triplet
(%) (%) (%) (%) (%) (%) (%) (%)
.............................................................................................................................................................................................
Albania 92 4.3 76.1 19.6 0.0 34 20.6 0.0 14 21.4 0.0
Austria 6616 57.3 42.1 0.5 0.0 4092 13.0 0.1 0
Belarus 2389 11.1 61.1 27.9 0.0 843 22.1 1.3 24 16.7 4.2
Belgium 14 196 56.6 36.0 6.5 0.9 3112 10.0 0.2 1765 8.7 0.2
Bosnia- 510 13.7 45.5 39.8 1.0 114 27.2 2.6 12 25.0 0.0
Herzegovina
Downloaded from https://academic.oup.com/humrep/article/33/9/1586/5055580 by guest on 08 February 2022
Bulgaria 2669 29.2 49.5 18.2 3.0 644 11.3 0.0 329 12.2 0.0
Croatia 2383 48.4 48.9 2.7 0.0 439 11.9 0.2 68 11.8 0.0
Cyprus 0 0
Czech Republic 10 542 61.3 36.9 1.8 0.0 2311 11.1 0.2 1808 9.9 0.1
Denmark 9556 54.6 41.6 3.8 0.0 2467 10.5 0.4 740 8.8 0.0
Estonia 1613 32.5 58.5 8.9 0.0 357 15.4 0.3 73 13.7 0.0
Finland 3735 79.8 20.2 0.0 0.0 886 694
France 47 761 40.1 54.1 5.5 0.3 12 030 15.7 0.2 4285 9.2 0.2
Germany 51 769 18.6 70.5 10.9 0.0 12 203 21.4 0.6 3538 14.3 0.7
Greece 11 515 16.5 41.7 34.4 7.4 2413 23.7 1.2 558 20.0 1.5
Hungary 4584 19.1 57.4 20.3 3.2 0 0
Iceland 303 56.1 43.9 0.0 0.0 83 4.8 0.0 44 11.4 0.0
Ireland 854 41.0 57.8 1.2 0.0 331 14.8 0.3 80 8.8 0.0
Italy 39 768 25.8 46.6 25.2 2.3 7277 19.8 1.2 1747 9.8 0.3
Kazakhstan 273 17.9 0.7 250 16.0 0.0
Latvia 774 34.6 63.2 2.1 0.0 122 20.2 0.0 45
Lithuania 344 14.2 42.7 43.0 0.0 104 18.2 1.8 6 0.0 0.0
Macedonia 369 26.0 0.6 12 11.1 0.0
Malta 114 34 20.6 0.0 0
Moldova 0 0
Montenegro 384 20.3 40.6 37.8 1.3 91 20.9 0.0 7 14.3 0.0
Norway 0 0
Poland 12 372 54.0 44.9 1.1 0.0 3090 11.7 0.2 1378 6.7 0.1
Portugal 4269 24.6 72.5 2.9 0.0 1210 20.5 0.2 358 15.4 0.6
Romania 2105 12.6 55.8 28.3 3.4 658 24.8 1.5 214 21.2 2.6
Russia 53 655 28.6 63.3 7.6 0.4 13 921 21.5 0.6 4575 16.6 0.2
Serbia 225 20.4 37.8 41.8 0.0 75 29.3 1.3 4 0.0 0.0
Slovenia 2758 42.4 56.4 1.2 0.0 718 10.6 0.3 297 8.4 0.0
Spain 34 342 25.4 68.2 6.4 0.0 8676 19.4 0.3 4193 15.5 0.2
Sweden 9294 79.9 20.1 0.0 0.0 2585 4.2 0.1 1444 3.0 0.1
Switzerland 3977 27.5 60.2 12.3 0.0 842 17.3 0.6 600 14.3 0.3
The 2913 4.2 0.1 1559 3.0 0.0
Netherlands
Ukraine 8207 21.0 57.4 21.2 0.4 2791 25.5 0.4 1520 2.03 0.0
UK 38 842 45.6 50.5 3.9 0.0 12 357 14.3 0.2 3730 13.9 0.3
All* 382 517 34.9 54.5 9.9 0.7 100 465 17.0 0.5 35 971 12.4 0.3
Bosnia Herzegovina consists of two parts: the Federation part and the Republic of Srpska.
*Totals refer only to these countries where data on number of transferred embryos and on multiplicity were reported.1594 De Geyter et al. pregnancies (2.9% in 2013) and 7.9% in triplet pregnancies (8.3% in this item the premature DR (
ART in Europe, 2014                                                                                                                          1595

of ART (incidence rate: 0.3% of all reported cycles). Other complica-      Sum of fresh and FER (‘cumulative’) DR
tions were much rarer, such as haemorrhage (0.1% of all treatment
                                                                           Supplementary Table SXIX provides us with an estimate (not a true
cycles), infections (0.01%) and maternal death (3 per 700 000 treat-
                                                                           rate, as the data set presented here is cross-sectional) of a cumulative
ment cycles). Two cases of maternal death occurred in the context of
                                                                           DR, calculated from the fresh embryo transfers and those carried out
pregnancy and delivery (aortic dissection in a pregnant Turner syn-
                                                                           after thawing. The data are presented based on the sum of the fresh
drome patient, amniotic fluid embolism). Another patient died of sud-
                                                                           and FER deliveries and the number of aspirations of the same year as
den heart failure 1 day before oocyte collection.
                                                                           the denominator. As no data on deliveries were available from
   Foetal reductions were reported from 16 countries and were per-
                                                                           Hungary, we were able to calculate cumulative DR from the data of 38
formed in 0.07% of all treatment cycles. Most foetal reductions were
                                                                           countries (35 countries in 2013). Whereas in all data taken together
reported in the UK, Spain and Russia.
                                                                           the DR after the fresh cycle amounted to 20.5%, the cumulative DR
                                                                           was 28.1% (a rise of 1.2% compared to 2013). The countries with the
PGT/PGT-A                                                                  highest benefit resulting from FER were Finland (+16.0%), Ukraine

                                                                                                                                                       Downloaded from https://academic.oup.com/humrep/article/33/9/1586/5055580 by guest on 08 February 2022
                                                                           (+15.2%), Albania (+14.6%), the Czech Republic (+14.0%),
PGT (PGT for monogenic disorders or structural rearrangements) and
                                                                           Kazakhstan (+13%) and Sweden (+13.0%). The countries with the
PGT-A (PGT for aneuploidy) activities were reported from 22 coun-
                                                                           lowest benefit resulting from FER were Malta (+0%) and Macedonia
tries (20 in 2013, 19 in 2012). The number of treatment cycles was
                                                                           (+0.3%).
15 894 (2.05% of all ART treatments, Table I), which compared to
2013 represents a drastic rise in treatment numbers (+6103). These
involved 13 460 fresh cycles and 2434 thawings, resulting in 6269 fresh
                                                                           Cross-border reproductive care
and 2021 frozen embryo transfers. In total, 2538 pregnancies (42.5%        Fifteen countries reported data on cross-border patients: Albania,
per transfer) and 2024 deliveries (32.3% per transfer) resulted from       Belarus, Croatia, Denmark, Finland, Greece, Iceland, Macedonia,
fresh cycles. Corresponding figures for FER were 801 (41.8% per             Malta, Poland, Portugal, Serbia, Slovenia, Spain and Switzerland. A total
transfer) and 619 (30.8% per transfer). The main contributor was           of 17 160 cycles were reported, 36.4% of which involved IVF/ICSI
Spain with 5242 cycles. A more detailed survey of PGT/PGT-A activ-         with the couple’s own gametes, while 45.6% were ED and 17.4% were
ities can be found in the annual reports of the ESHRE PGT consortium       IVF or ICSI with semen donation. Additionally, 8021 IUI with sperm
(De Rycke et al., 2017).                                                   donation were registered. Information regarding the countries of origin
                                                                           was very incomplete and not reliable enough to obtain any conclusive
                                                                           information. The main reasons reported by patients were to have
IVM                                                                        access to a technique not legally available in their home countries
A total of 292 treatments with IVM were reported from eight coun-          (53.2%) or to seek a higher quality treatment (17.0%).
tries (247 in 2013, 421 in 2012) (Table I). Most IVM cycles were
recorded in France and Russia. A total of 124 transfers resulted in 28
pregnancies and 17 deliveries. France accounted for 68.8% of imma-
                                                                           Discussion
ture oocyte aspirations, but reported only 53 transfers (26.4%) and 10     This is the 18th annual report of the combined activities of the
deliveries after IVM.                                                      European national registries collecting data on ART. The EIM
                                                                           Consortium, from 1997 to 2014, has reported on more than 8 million
                                                                           treatments (8 010 527) leading to the birth of nearly 1.5 million infants
FOR                                                                        (1 478 452). A comprehensive review of the first 15 years of EIM
FOR was reported by 16 countries (12 in 2013) and this accounted for       (from 1997 to 2011) was recently published (Ferraretti et al., 2017).
3404 thawing cycles (6611 in 2013) (Table I), 2655 transfers, 790 preg-       The present collected data summarizes the totality of the data col-
nancies and 548 deliveries. The vast majority was carried out in Italy     lections provided by 39 European countries (38 in 2013), as Bosnia-
(1639 treatments) and in Spain (845 treatments).                           Herzegovina joined the consortium. Data are still not available from
                                                                           Azerbaijan, Georgia and Kosovo. Slovakia and Turkey are members of
                                                                           the EIM Consortium, but were not able to participate. Another group
IUI                                                                        of small European countries never participated in the Consortium,
Data on IUI with husband semen (IUI-H, Supplementary Table SXVII)          such as Andorra, Armenia, Liechtenstein, Luxemburg, Monaco, San
and using donated semen (IUI-D, Supplementary Table SXVIII) were           Marino and The Vatican, most of them not offering independent ART
collected by 1364 institutions in 25 and 21 countries, respectively.       services. The level of completeness at the national level has risen to
Spain was the most active country in both treatment modalities. All        92.9%, and at the level of the reporting clinics to 87.5%, both a sub-
together, 120 789 treatments with IUI-H resulted in 9533 deliveries        stantial increase as compared to previous years.
(7.92%), whereas 49 163 treatments with IUI-D in 5061 deliveries              Fourteen countries were able to provide data sets for all registered
(10.3%), similar to results reported in 2013. In all three age groups      clinics (Supplementary Table SIV), but the quality of data sets varies
most pregnancies led to singleton deliveries (90.3% in IUI-H, 92.2% in     much from one country to another. A good example are discrepancies
IUI-D). The twin and triplet DR were generally low (Table V), depend-      on the definition of a treatment: initiated treatment or collection of
ing on the age of the treated patient and were similar to those            oocytes. Whereas data on aspirations were available from 34 coun-
reported in previous years (twin deliveries: 8.8 and 7.3%, respectively;   tries (87.2%), those on initiated cycles were from 33 (or 32) countries
triplet deliveries: 0.4 and 0.3%, respectively).                           (84.6 or 82.0%), both not necessarily the same countries. Only in 27
1596 De Geyter et al.
Table V IUI with husband (IUI-H) or donor (IUI-D) semen in 2014.
IUI-H IUI-D
.................................................................................. ...................................................................................
Country Cycles Deliveries Deliveries Singleton Twin Triplet Cycles Deliveries Deliveries Singleton Twin Triplet
(%) (%) (%) (%) (%) (%) (%) (%)
.............................................................................................................................................................................................
Albania 54 5 9.3 80.0 20.0 0.0
Austria
Belarus 409 69 16.9 96.9 3.1 0.0 5 3 60.0 100.0 0.0 0.0
Belgium 12 933 753 5.8 95.1 4.9 0.0 8281 615 7.4 95.8 4.1 0.2
Bosnia- 184 13 7.1 92.3 7.7 0.0
Herzegovina
Downloaded from https://academic.oup.com/humrep/article/33/9/1586/5055580 by guest on 08 February 2022
Bulgaria 1018 105 10.3 97.1 2.9 0.0 241 31 12.9 96.8 3.2 0.0
Croatia 1224 51 4.2 100.0 0.0 0.0
Cyprus
Czech
Republic
Denmark 10 016 1211 12.1 89.3 9.5 1.2 10 141 781 7.7 93.2 6.4 0.4
Estonia 150 10 6.7 100.0 0.0 0.0 145 7 4.8 100.0 0.0 0.0
Finland 3226 278 8.6 93.5 6.5 0.0 1176 150 12.8 94.7 5.3 0.0
France 52 731 5343 10.1 89.4 10.3 0.3 3618 660 18.2 88.5 10.9 0.6
Germany
Greece 4924 363 7.4 93.1 6.6 0.3 605 58 9.6 91.2 7.0 1.8
Hungary
Iceland
Ireland 631 51 8.1 86.3 13.7 0.0 166 26 15.7 92.3 7.7 0.0
Italy 23 866 1529 6.4 90.1 9.5 0.3 37 1 2.7 100.0 0.0 0.0
Kazakhstan 620 9 1.5 100.0 0.0 0.0 94 3 3.2 100.0 0.0 0.0
Latvia 149 8 5.4 100.0 0.0 0.0 143 5 3.5 100.0 0.0 0.0
Lithuania 450 30 6.7 72.2 27.8 0.0
Macedonia 1144 41 3.6 2 0
Malta
Moldova
Montenegro 128 15 11.7 100.0 0.0 0.0
Norway 238 30 12.6 93.3 6.7 0.0 530 81 15.3 95.1 4.9 0.0
Poland 9738 656 6.7 93.3 6.6 0.2 1699 172 10.1 95.2 4.8 0.0
Portugal 2089 212 10.1 89.1 10.9 0.0 199 33 16.6 75.0 25.0 0.0
Romania 1817 139 7.6 91.4 8.6 0.0 481 43 8.9 81.4 18.6 0.0
Russia 10 178 1107 10.9 93.4 6.6 0.0 3793 597 15.7 95.1 4.5 0.3
Serbia 349
Slovenia 662 59 8.9 84.7 15.3 0.0 1 0
Spain 28 204 2705 9.6 87.9 11.5 0.6 11 973 1640 13.7 89.1 10.6 0.3
Sweden 870 122 14.0 94.3 5.7 0.0
Switzerland
The
Netherlands
Ukraine 1764 184 10.4 91.8 8.2 0.0 321 50 15.6 94.0 6.0 0.0
UK 6430 4681 643 13.7 93.6 5.9 0.5
All* 175 326 14 976 8.5 90.0 9.5 0.3 49 202 5721 11.6 92.0 7.7 0.3
Bosnia Herzegovina consists of two parts: the Federation part and the Republic of Srpska.
*Total refers to these countries where data were reported and mean percentage were computed on countries with complete information.
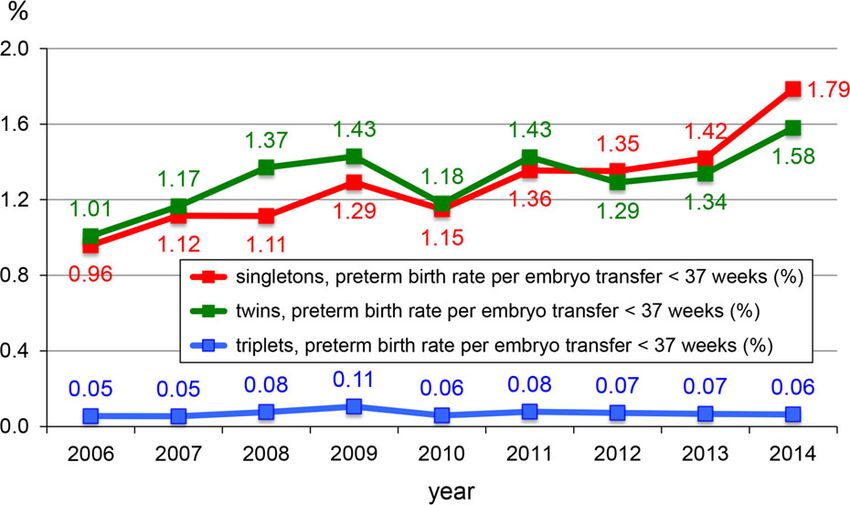
Poland: For IUI-H and IUI-D there were respectively 282 and 63 pregnancies with unknown outcome.ART in Europe, 2014 1597 countries (69.2%) were we able to obtain information about both the constantly, despite the current lack of prospective randomized clinical number of initiated cycles and the number of oocyte collections. trials substantiating the benefits and specific indications for this Other countries have failed to report treatment endpoints, most not- technology (Sermon et al., 2016; Harper et al., 2018). ably delivery outcome data were availabe only in 39 countries after Another trend visible from the annual EIM reports is the lower num- fresh cycles and after FER (97.4%). Underreporting of treatment num- bers of embryos transferred per treatment cycle resulting in fewer bers may lead to overestimation of the efficacy outcome of the offered multiple deliveries. The number of embryo transfers with only one treatments. Improvements in the quality of the retrieved data sets may embryo continues to rise (Fig. 2) and, in parallel, the numbers of twin still be achieved. This may possibly be achieved through the organiza- and triplet deliveries decline. Interestingly, whereas the proportion of tion of external audits both in the offices of the national registries and premature deliveries of twins and triplets remains similar to previous in the local IVF clinics, as exemplified by Switzerland (Van den Bergh years, the proportion of premature deliveries (
1598                                                                                                                               De Geyter et al.

treated with ART per year (ESHRE Capri Group, 2001). Even among             European political bodies have a duty to realize that such therapies
the 14 countries with complete coverage five countries did not fulfil         require appropriate logistic and financial support in order to set up
that requirement in 2014 (35.7%) and these countries might be               compulsory national reporting electronic databases, ideally a pan-
thought to belong to the more advanced ones. Transparency in data           European centralized data collection, to monitor both the efficiency
both at the national level but also, for comparison purposes, at the        and safety of therapy and also the long-term health of children born
international level may be particularly helpful in convincing politicians   after treatment. The creation of a unique individual patient European
and health care authorities to undertake measures in improving access       coding system will ensure all aspects of an ever increasing spectrum of
to treatment.                                                               ART care can be measured and analysed thus ensuring full surveillance
   Until today the data collection handled by the EIM Consortium has        and vigilance. The time is now. The concept of evolving the current
been cross-sectional and based on annual data reporting. Cumulative         cross-sectional register towards prospective surveillance and vigilance
data analysis has only been possible within the frame of 1 year. The EIM    of care in ART will take years to become real and will require top
Consortium has come far to push the completeness of the European            down support from national and supranational health care authorities.

                                                                                                                                                      Downloaded from https://academic.oup.com/humrep/article/33/9/1586/5055580 by guest on 08 February 2022
data collection beyond 90%, as first demonstrated in the 2014 data sets,     Such a concept can only be supported by all stakeholders of ART,
described here. Increasingly, infertility treatments are being fragmented   including the patients, and should be motivated to provide care with
into small treatment units that may easily cross the time frame of cross-   excellence.
sectional data collections, which points to the need for developing new
surveillance tools. A concept for prospective follow-up of infertility
treatment has therefore been elaborated earlier (De Geyter et al.,
                                                                            Supplementary data
2016).                                                                      Supplementary data are available at Human Reproduction online.
   So far the annual reports published by the EIM consortium, including
the present 18th report, have been limited to being purely descriptive.
The organization of the data collection, as carried out by the EIM
                                                                            Authors’ roles
Consortium, may be further developed towards medical surveillance           V.G. performed the calculations. CDG wrote the article. All other co-
and vigilance. Surveillance is defined by the continuous and systematic      authors reviewed the final article and made appropriate corrections
collection of health data (here related to ART and its outcome)             and suggestions to improve it. In all, this document represents a fully
needed for the analysis and interpretation of trends in medical care        collaborative work.
with a special focus on safety. Surveillance in medical care goes far
beyond considering the results of prospective randomized trials, in
which very selected cohorts of patients are recruited and treated
                                                                            Funding
under well-controlled conditions. Register-based data have their value      The study did not receive any external funding. All costs were covered
by being less biased by predefined selection criteria. They reflect to a      by ESHRE.
much larger extent real-life conditions and for that reason have the
capacity to give a more realistic picture of the outcome results.
However, real surveillance can only be achieved with more or less
                                                                            Conflict of interest
complete data sets, in which underreporting is avoided. That goal can       There are no competing interests.
best be achieved if data submission to the national registries is made
compulsory.
   Medical surveillance may also be used for the establishment of vigi-
                                                                            Appendix
lance. Vigilance aims at detecting serious or less serious adverse events   Contact persons who are collaborators and represent the data collec-
resulting from medical activities. Through the increasing trend towards     tion programmes in participating European countries, 2014.
replacing fewer embryos per treatment cycle, present-day ART has
                                                                            Albania
been successful in reducing the incidence of multiple delivery and the
                                                                            Prof. Orion Gliozheni, University Hospital for Obst&Gynecology,
EIM annual reports have been able to make this trend visible and this
                                                                            Departement of Obstetrics & Gynecology, Bul.B.Curri, Tirana,
increases the awareness on the usefulness of such practice. In addition,
                                                                            Albania. Tel: +355-4-222-3632; Fax: +355-4-225-7688; Mobile:
a more novel development is the adoption of the principle of ‘freeze
                                                                            +355-682029313. E-mail: glorion@abcom.al
all’ and the delayed thawing and transfer of frozen embryos, which has
already resulted in an upsurge of the number of FER cycles. All these       Austria
trends are expected to lower the incidence of other common compli-          Prof. Dr Heinz Strohmer, Dr Obruca and Dr Strohmer Partnerschaft
cations, such as OHSS and foetal reduction. Other adverse events            Goldenes Kreuz-Kinderwunschzentrum, Lazarettgasse 16-18, 1090
may still occur and need to be registered, because vigilance does not       Wien, Austria. Tel: +43-40-111-1400; Fax: +43-40-111-1401. E-mail:
only consist of merely recording adverse events, but also the assess-       heinz.strohmer@kinderwunschzentrum.at
ment of underlying causes and proper understanding of the mechan-
                                                                            Belarus
isms leading to the adverse events, which ultimately may lead to the
                                                                            Dr Elena Petrovskaya, ART centre ‘Embryo’, Filimonova 53, 220053
formulation of preventive measures as part of an ongoing quality man-
                                                                            Minsk, Belarus. E-mail: elena_embryo@rambler.ru
agement development.
   As shown here, one in 50 children born in Europe are the result of       Dr Oleg Tishkevich, Centre For Assisted Reproduction ‘Embryo’
ART treatments. Practitioners, professional bodies, and national and        Belivpul, Filimonova Str. 53, 220114 Minsk, Belarus. Tel: +375-29-
ART in Europe, 2014 1599
622-2722; Fax: +375-17-237-6404; Mobile: +375-296222722; E-mail: Finland
tishol@tut.by Prof. Mika Gissler, THL National Institute for Health and Welfare, PO
Box 30, 00271 Helsinki, Finland. Tel: +385-29-524-7279; E-mail: mika.
Belgium
gissler@thl.fi
Prof. Christine Wyns, Cliniques Universitaires Saint Luc, Université
Catholique de Louvain, Av. Hippocrate, 10, 1200 Brussels, Belgium. Dr Aila Tiitinen, Helsinki University Central Hospital, Dept. of Ob/
Tel. +32-27-64-6576; Fax: +32-27-64-9050; E-mail: christine.wyns@ Gyn, Haartmaninkatu, 2, PO Box 140, 00029 HUS—Helsinki, Finland.
uclouvain.be Tel: + 358-50-427-1217; E-mail: aila.tiitinen@hus.fi
Prof. Kris Bogaerts, I-Biostat, Kapucijnenvoer 35 bus 7001, 3000 France
Leuven, Belgium. Tel: +32-016-33-6890; Fax: +32-016-33-7015. Prof. Dominique Royere, Agence de la Biomédecine, 1 Av du stade
E-mail: Kris.Bogaerts@med.kuleuven.be de France, 93212 Saint-Denis La Plaine Cedex, France.Tel.: +33-15-
593-6555; Fax: +33-15-593-6561; E-mail: dominique.royere@
Bosnia
Downloaded from https://academic.oup.com/humrep/article/33/9/1586/5055580 by guest on 08 February 2022
biomedecine.fr
Prof. Dr Devleta Balic, Zavod za humanu reprodukciju ‘Dr Balic’,
Kojsino 25, 75000 Tuzla, Bosnia—Herzegovina. Tel: +387-35-26- Germany
0650; Mobile: +387-61140222; E-mail: drbalic@bih.net.ba Dr Andreas Tandler—Schneider; Fertility Centre Berlin; Spandauer
damm 130; 14050 Berlin; Germany. Tel: +49-30-23-320-8110; Fax:
Prof. Dr Sanja Sibincic, Health Centre Medico-S, Jevrejska 58/A,
+49-30-23-320-8119; E-mail: tandler-schneider@fertilitycenter-berlin.de
78000 Banja Luka, Bosnia—Herzegovina. Tel: +387-51-232-100;
Mobile: +387-65515942; E-mail: sanjasibincic@gmail.com Dr Markus Kimmel, D.I.R. Geschäftsstelle, Torstrasse 140, D-10119
Berlin, Germany. Tel: +49-303-980-0743; E-mail: d.i.r.
Bulgaria
geschaeftsstelle@mru-consulting.de
Irena Antonova, ESHRE certified clinical embryologist (2011), Ob/Gyn
Hospital Dr Shechterev, 25-31, Hristo Blagoev Strasse, 1330 Sofia, Greece
Bulgaria. Tel: +359-88-712-7651; E-mail: irendreaming@gmail.com Prof. Aris J. Antsaklis; Professor of Obstetrics and Gynecology,
University of Athens, President Hellenic Authority of Assisted
Croatia
Human Reproduction. Tel: +30-694-429-9699; E-mail: arisants@
Prof. Dr Hrvoje Vrcic, Zagreb University Medical School, Obstetrics
otenet.gr
and Gynecology, Petrova 13, 10000 Zagreb, Croatia. Tel: +385-14-
60-4646; Fax: +385-14-63-3512; E-mail: Hrvoje.vrcic@hilarus.hr Dr Dimitris Loutradis, Athens Medical School, 1st Department of OB/
GYN, 62, Sirinon Street, 17561 P. Faliro, Athens, Greece. Tel: +30-
Dr Dejan Ljiljak, Clinical Hospital Centre ‘Sestre milosrd’, Department
19-83-3576; Fax: +30-19-88-3834; Mobile: +30-693-242-1747;
for Biology of Human Reproduction, Ob/Gyn Clinic, Vinogradska c.
E-mail: loutradi@otenet.gr
29, 10000 Zagreb, Croatia. Tel: +385-378-7597; Fax: +385-13-76-
8272; Mobile: +385-378-7125; E-mail: dejan.ljiljak@kbcsm.hr Hungary
Prof. Janos Urbancsek, Semmelweis University, 1st Dept. of Ob/Gyn,
Cyprus
Baross utca 27, 1088 Budapest, Hungary. Tel: +36-12-66-0115; Fax:
Dr Michael Pelekanos, Fertility Centre Aceso, 1, Pavlou Nirvana str.,
+36-12-66-0115; E-mail: urbjan@noi1.sote.hu
3021 Limassol, Cyprus. Tel: +357-99-64-5333; Fax: +357-25-82-
4477; Mobile +30-6944248433; E-mail: Pelekanos@akeso.com Prof. G. Kosztolanyi, University of Pecs, Dept. of Medical Genetics
and Child Development, Jozsef A.u.7., 7623 Pecs, Hungary. Tel:
Czech Republic
+36-72-53-5977; Fax: +36-72-53-5972; E-mail: gyorgy.kosztolanyi@
Dr Karel Rezabek, Medical Faculty, University Hopsital, CAR-Assisited
aok.pte.hu
Reproduction Centre, Gyn/Ob departement, Apolinarska 18, 12000
Prague, Czech Republic. Tel: +420-22-496-7479; Fax: +420-22-492- Iceland
2545; Mobile: +420-724685276; E-mail: krezabek@vfn.cz Mr Hilmar Bjorgvinsson, Art Medica, Baejarlind 12, 201 Kopavogur,
Iceland. Tel: +354-515-8100; Fax: +354-515-8103; E-mail: Hilmar@
Mgr. Jitka Markova, Institute of Health Information and Statistics of the
artmedica.is
Czech Republic, Palackeho namesti 4, 12801 Prague, Czech Republic.
Tel: +420-22-497-2832; Mobile: +420-72-182-7532; E-mail: Ireland
markova@uzis.cz Dr Edgar Mocanu, Human Assisted Reproduction Ireland Rotunda
Hospital, HARI Unit, Master’s House, Parnell Square, 1 Dublin,
Denmark
Ireland. Tel: +353-18-07-2732; Mobile: +353-86-81-8839; Fax: +353-
Dr Josephine Lemmen, Copenhagen University Hospital,
18-72-7831; E-mail: emocanu@rcsi.ie
Rigshospitalet, Blegdamsvej 9, 2100 Copenhagen, Denmark. Tel: +45-
35-450-934; Fax: +45-35-454-945; Mobile: +45-30285712; E-mail: Italy
jglemmen@gmail.com Dr Giulia Scaravelli, Istituto Superiore di Sanità, Registro Nazionale
della Procreazione Medicalmente Assistita, CNESPS, Viale Regina
Estonia
Elena, 299, 00161 Roma. Tel: +39-49-90-4050; Fax: +39-49-90-4324;
Dr Deniss Sõritsa, Tartu University Hospital and Elitre Clinic, Tartu, Estonia.
E-mail: giulia.scaravelli@iss.it
Tel: +372-740-9930; Fax: +372-740-9931; E-mail: soritsa@hotmail.com1600 De Geyter et al.
Dr Roberto de Luca, Istituto Superiore di Sanità, Registro Nazionale Norway
della Procreazione Medicalmente Assistita, CNESPS, Viale Regina Dr Liv Bente Romundstad, St. Olavs Hospital, Postboks 3250 Sluppen,
Elena, 299, 00161 Roma. Tel: +39-064-990-4320; E-mail: roberto. Olav Kyrres gt.17, 7006 Trondheim, Norway. Tel: +47-73-86-8000;
deluca@iss.it Fax: +47-73-86-7602; Mobile: +47-90-55-0207; E-mail: liv.
bromundstad@ntnu.no, liv.bente.romundstad@stolav.no
Kazachtstan
Prof. Dr Vyacheslav Lokshin, The Urban Centre of Human Poland
Reproduction, Tole Be Street 99, 50012 Almaty, Kazakhstan. Tel: +7- Dr Anna Janicka, VitroLive, Kasprzaka 2 A, 71-074 Szczecin, Poland.
727-234-3434; Fax: +7-727-264-6615; Mobile: +7-7017558209; Tel: +48-69-167-6305; E-mail: anna.janicka@vitrolive.pl
E-mail: vyacheslav.lokshin@ipsen.kz
Portugal
Dr Valiyev Ravil, The Scientific Centre for Obstetrics, Gynecology and Prof. Dr Carlos Calhaz-Jorge, CNPMA, assembleia da Republica,
Perinatology, Dostyk street 125, 050020 Almaty, Kazakhstan. Tel: +7- Palacio de Sao Bento, 1249-068 Lisboa, Portugal. Tel: +351-21-391-
Downloaded from https://academic.oup.com/humrep/article/33/9/1586/5055580 by guest on 08 February 2022
727-300-4530; Fax: +7-727-300-4529; Mobile: +7-7772258189; 9303; Fax: +351-21-391-7502; E-mail: calhazjorgec@gmail.com
E-mail: rvaliev@mail333.com
Ms Ana Rita Laranjeira, CNPMA, Assembleia da Republica, Palaio de
Latvia Sao Bento 1249-068 Lisboa, Portugal. Tel: +351-21-391-9303; Fax:
Dr Valeria Magomedova, Jusu Arsti Private Clinic, Apuzes 14, 1046 +351-21-391-7502; E-mail: cnpma.correio@ar.parlamento.pt
Riga, Latvia. Tel: +371-67-87-0029; E-mail: valerija.magomedova@
Romania
gmail.com
Mrs Ioana Rugescu, Gen Secretary of AER Embryologist association
Lithuania and Representative for Human Reproduction Romanian Society. Tel:
Dr Zivile Gudleviciene, Baltic American Clinic, IVF Laboratory, +40-74-450-0267; E-mail: irugescu@rdsmail.ro
Nemencines rd 54 A, 10103 Vilnius, Lithuania. Tel: + 370-52-34-2020;
Dr Bogdan Doroftei; Univ. of Medicine and Pharmacy Iasi; Teaching
Mobile: +370-68682417; E-mail: embriologija@gmail.com
Hospital Obgyn ‘Cuza Voda’; Cuza Voda Str. 34; 700038 Iasi;
Dr Giedre Belo lopes, Northway Medical Centre, S. Žukausko g. 19, Romania. Tel: + 40-23-221-3000/int. 176; Mobile: +40-744515297;
Vilnius 08234, Lithuania. Tel: + 370-529-8290; E-mail: giedre.lopes@ E-mail: bogdandoroftei@gmail.com; bogdan.doroftei@umfiasi.ro
gmail.com
Russia
Macedonia Dr Vladislav Korsak, International Centre for Reproductive Medicine,
Prof. Zoranco Petanovski, Re-medika Hospital; Jane dandaniski 87/1/ General Director, Liniya 11, Building 18B, Vasilievsky Island, 199034
4, 1000 Skopje, Macedonia. Tel: +389-23-07-3335; Mobile: +389- St-Petersburg, Russia C.I.S. Tel: +7-812-328-2251; Fax: +7-812-327-
72443114; E-mail: zpetanovski@yahoo.com 1950; Mobile: +7-921-965-1977; E-mail: korsak@mcrm.ru
Malta Serbia
Dr Jean Calleja-Agius, University of Malta, 12, Mon Nid, Gianni Faure Prof. Nebosja Radunovic, Institute for Obstetrics and Gynecology,
Street, TXN2421 Tarxien, Malta. Tel: +356-21-69-3041; Mobile: Visegradska 26, 11000 Belgrade, Serbia. Tel: +38-111-361-5592; Fax:
+356-99-55-3653; E-mail: jean.calleja-agius@um.edu.mt +38-111-361-5603; Mobile: +381-63200204; E-mail: radunn01@
gmail.com
Ms Josephine Xuereb, Mater Dei Hospital Malta, Apt 1 Hampton
Place, BKR 104 B’Kara, Malta. Tel: +356-99-99-2382; E-mail: jojo75. Dr Sci. Nada Tabs, Klinika za ginekologiju i akuserstvo, Klinicki centar
jx@gmail.com Vojvodine, Branimira Cosica 37, 21000 Novi Sad, Serbia. Mobile:
+381-63508185; E-mail: nada.tabs@yahoo.com
Moldova
Prof. Dr Veaceslav Moshin, Medical Director at Repromed Moldova, Slovenia
Centre of Mother @ Child protection, State Medical and Dr Irma Virant-Klun, University Medical Centre Ljubljana,
Pharmaceutical University ‘N.Testemitanu’, Bd. Cuza Voda 29/1, Departement of Obstetrics and Gynecology, Slajmerjeva 3, 1000
Chisinau, Republic of Moldova. Tel: +373-22-26-3855; Mobile: +373- Ljubljana, Slovenia. Tel: +386-1-522-6013; Fax: +386-1-431-4355;
69724433; E-mail: mosin@repromed.md Mobile:+386-31625774; E-mail: irma.virant@kclj.si
Montenegro Spain
Dr Tatjana Motrenko Simic, Medical Centre Cetinje, Human Mrs Irene Cuevas Saiz, Hospital General de Alicante, Infertility Dept., Av
Reproduction Departement, Vuka Micunovica 4, 81310 Cetinje, Pintor Baeza, 12, 03010 Valencia, Spain;. Tel: +34-96-197-2000; Fax:
Montenegro. Tel: +382-41-23-2690; Fax: +382-41-23-1212; Mobile: +34-91-799-4407; Mobile +34-677245650; E-mail: cuevas_ire@gva.es
+382-69-05-2331; E-mail: motrenko@t-com.me
Dr Fernando Prados Mondéjar, Hospital de Madrid-Montepríncipe,
Dragana Vukicevic, Hospital ‘Danilo I’, Humana reprodukcija, Vuka HM Fertility Centre Monteprincipe, C/Montepríncipe 25, 28660
Micunovica bb, 86000 Cetinje, Montenegro. Tel: +382-67-55-1371; Boadilla del Monte, Spain. Tel: +34-91-708-9931; Mobile +34-
E-mail: vukicevic.dragana@yahoo.com 646737237; E-mail: fernandojprados@gmail.comYou can also read