ARGENTINA G20 CLIMATE RISK ATLAS - Impacts, policy, economics - CMCC Foundation
←
→
Page content transcription
If your browser does not render page correctly, please read the page content below
G20 CLIMATE RISK ATLAS
Impacts, policy, economics

ARGENTINA                                                                                                                         With the scientific
                                                                                                                                   contribution of
                                                                                                                                   Enel Foundation

How to read the Atlas: graphs, colours and scenarios.
The maps used in this Atlas are taken from The World Bank Official Boundaries -
(accessed on May 28, 2021). For the section Energy, the maps are based on Panoply Data Viewer
Each sector of this Atlas contains data and information on various climate scenarios.
When reported in graphs, the colour black indicates data and information referring to the current state, the past or the baseline.
When the authors refer to RCP (Representative Concentration Pathways), the 3 colours used across the factsheet refer to 3 scenarios, which are 3
different development options with different levels of greenhouse gas emissions, respectively low emissions (green), medium emissions (orange), and
high emissions (red). The same colour code is used when RCPs are associated with Shared Socioeconomic Pathways (SSP).
In some cases, the authors refer to global warming scenarios. In these cases, the 3 colours used refer to a temperature rise of 1.5°C (green), 2°C (dark
green), and 4°C (red).
When the authors refer exclusively to Shared Socioeconomic Pathways - SSPs (Population affected by river floods in the section: “Water"), data related to
SSP3 - that encompasses, among other things, slow economic growth, material-intensive consumption, and persisting or worsening inequalities – are
reported in a lighter shade; SSP5 – which refers to social and economic development that is coupled with an energy-intensive lifestyle and the abundant
exploitation of fossil fuel resources – is shown using a middle shade of the colour, whereas data related to the present conditions are represented in a
dark shade.
Further details on scenarios, methodologies, and the full list of references are available at: www.g20climaterisks.org
                                                                                                                      Concept and graphic design by element6.eu
ARGENTINA

CLIMATE
OVERVIEW                                                              TEMPERATURE PROJECTIONS
Argentina’s climate ranges from tropical to polar. This               Under a low emissions scenario projected temperature variations will
variability is mainly due to the size, heterogeneity and              remain contained at around +1°C, both by 2050 and 2100.
                                                                      Under a high emissions scenario, with no reduction in GHG emissions,
orography of the country, which makes for extreme                     much greater temperature anomalies are expected by both 2050 and
weather conditions and often leads to natural disa-                   2100.
sters. The country’s climate features and seasonality
are influenced by the presence of the Los Andes moun-
tains, which extend along the west of the country, as                                                                              +4.3°C
well as the El Niño-Southern Oscillation and the Indian                       TEMPERATURE                                          +2.0°C
Dipole.                                                                       ANOMALY                                              +1.0°C

TEMPERATURE                                                                                                     +1.5°C
The temperature regime of Argentina is quite heterogeneous with                                                 +1.1°C
average values increasing from west to east. Lower temperatures are                                             +0.8°C
found along the Los Andes mountain range which runs down the west
of the country.
                                                                                          +0.4°C

MEAN                         -7                                25
                                                                       -0.3°C
TEMPERATURE                        Celsius degrees / Over 1991-2020

                                                                       1985               2014                  2050                  2100

                                                                      Historical Period

                                                                      EXPECTED VARIATION
                                                                      FOR TEMPERATURE AT 2050
                                                                      The indicators show variations in selected temperature characteristi-
                                                                      cs for a thirty-year period centred on 2050 (2036-2065) with respect
                                                                      to the reference period 1985-2014.

TEMPERATURE TREND                                                                 +1.6°C                  +2.1°C                     +1.6°C
Temperature anomalies over the last 60                        max
years with respect to the annual mean of                    0.8 °C                  +1.2°C                  +1.6°C                        +1.1°C
15°C in Argentina during the 1961-1990
period                                                                            +1.0°C                  +1.2°C                     +0.9°C
 1961                                                                 Annual Mean            Max Temperature           Min Temperature
                                                                      Temperature            of warmest month          of coldest month

                                                             2020
 -0.9 °C
 min
PRECIPITATION                                                                  PRECIPITATION PROJECTIONS
Argentina's precipitation regime is highly variable. It ranges from very       Precipitation trends are complex and reveal large
humid to arid areas, also showing relevant inter-annual and inter-de-          variabilities based on the scenario and period
cadal variations. Precipitation patterns over the Los Andes mountain           considered. For example, the anomalies seen over the
range are also highly variable due to the effect of factors such as the        historical period can be explained by the complexity                       -7.0%
interaction of mountains with humid air masses coming from the                 of the precipitation regime and                                            -3.8%
Pacific Ocean. In the south and central areas annual precipitation is           dynamics requiring detailed                                                -1.0%
generally lower. June to September is the season with least rainfall.          spatial and temporal analysis.

                                                                                       PRECIPITATION                             -2.2%
                                                                                       ANOMALY                                   +0.6%

MEAN                         81                                  5,562
                                                                                                                                 -1.1%
PRECIPITATION                              mm/year / Over 1991-2020
                                                                                                       -1.5%
                                                                                +1.0%

                                                                                1985                   2014                      2050                      2100

                                                                              Historical Period

                                                                               EXPECTED VARIATION
                                                                               FOR PRECIPITATION AT 2050
                                                                               The indicators show variations in selected precipitation characteristi-
PRECIPITATION TREND                                                            cs for a thirty-year period centred on 2050 (2036-2065) with respect
Precipiation anomalies over the last 60                                        to the reference period 1985-2014.
years with respect to the annual mean of                              max
773 mm/year in Argentina during the                               +29%
1961-1990 period                                                                               -3.2%                          -0.1%                       -7.6%
 1961                                                                                            -2.4%                           -0.3%                     -5.7%

                                                                                               -2.1%                          -0.3%                       -5.4%
                                                                                Annual total                  Precipitation of             Precipitation of
                                                                                precipitation                  wettest month               warmest quarter

 -32%                                                             2020
 min
                                                                 +30%                           +34%                          +6,247%                     +50%

                                                                  +15%                           +20%                            +1,032%                      +36%
VARIATION OF SPECIFIC                                            +12%                           +14%                          +379%                       +23%
CLIMATE INDICATORS                             Agricultural drought         Hydrological drought                 Heatwave                      Runoff
                                                proportion of time           proportion of time                  duration                     increase
Climate indicators variation showing                % of time                     % of time                      % of time                    % of area
impacts of climate change on sectors such
as agriculture, health and water. Analysis                       +62%                           +13%                          +92%                        +12%
considers 3 threshold average temperatu-
re increase: +1.5°C, +2°C, +4°C.                                  +33%                           +12%                            +60%                         +4%

                                                                 +23%                           +12%                          +37%                        +2%

                                                   Agricultural                Hydrological                      Heatwave                      Runoff
                                                drought frequency            drought frequency                   frequency                    decrease
                                                   % of change                   % of change                    % of change                   % of area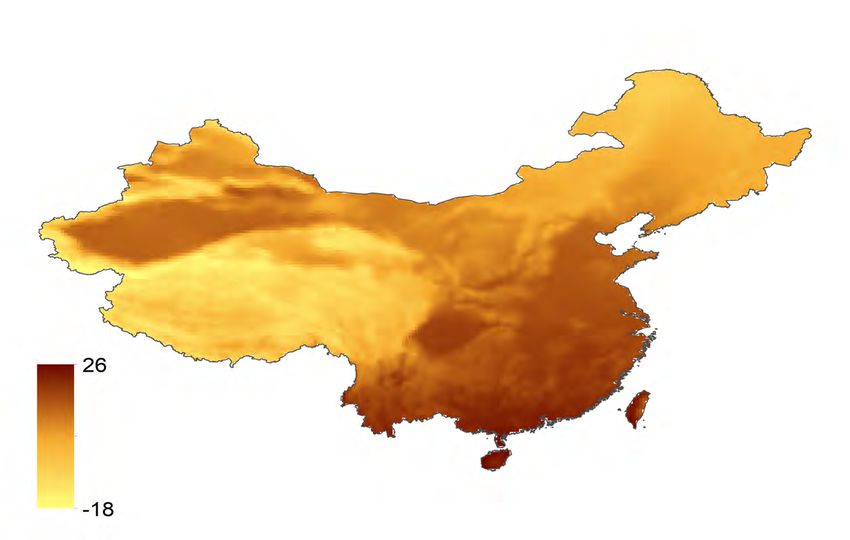
ARGENTINA
OCEAN
OCEAN IN ARGENTINA FUTURE PROJECTIONS
Argentina’s marine exclusive economic zone (EEZ) Projected annual changes within the marine EEZ for the two most
includes a wide range of habitats, from the southern significant marine indicators of climate change: sea surface water
polar pelagic ecosystems to the temperate ones temperatures and pH.
hosting nursery grounds for several species. The Atlan-
tic coastal systems can be divided in two parts, namely
the northern and southern marine regions. Seawater temperature changes are in line +3 °C
with the definitions of each scenario, with +1.5 °C
maximum values in 2100 up to +3°C under a +0.8 °C
CURRENT CLIMATE CONDITIONS high emissions scenario.
Mean sea surface temperatures reflects the different climate regimes,
from the cold waters of southern Patagonia to the temperate regime of SEA SURFACE +1 °C
the northern coasts. TEMPERATURE +0.9 °C
ANOMALY
+0.7 °C
0.1 °C
-0.3 °C
3 18 MEAN 1950 2014 2050 2100
SEA SURFACE TEMPERATURE
Celsius degrees / Over 1991-2020
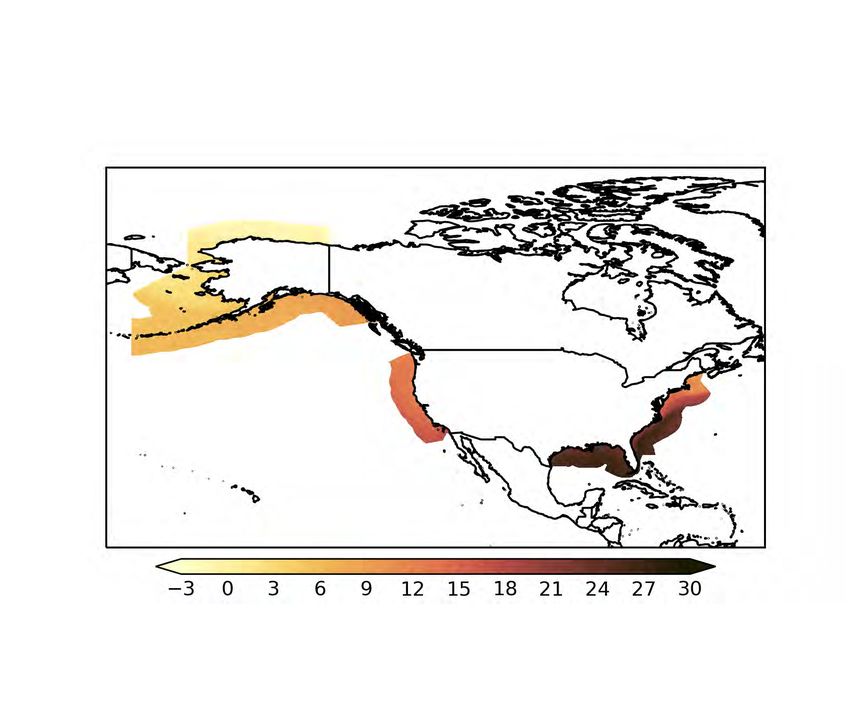
0 0.7 TREND
0.05
-0.01
-0.09
SEA SURFACE
pH ANOMALY -0.12
-0.16
Seawater surface pH becomes more acidic in -0.08
all scenarios, closely reflecting rising -0.18
atmospheric CO₂ concentrations, and only a
-0.4
Surface temperature trends indicate a general warming of 0.2°C per low emissions scenario leads to a stable
decade in all marine areas, with increased gains in the northernmost condition by 2100.
regions.
ECOSYSTEM INDICATORS AT 2050
Regional changes in key marine ecosystem indicators
under projected future scenarios by mid-century
(2036-2065) with respect to present climate condi-
tions (1985-2014).                                                                           North                         South

                                                                                                        +0.98 °C                    +1.04 °C
Temperature regulates the metabolism of marine
organisms determining which habitats remain                                                  12.95°C     +0.98 °C        6.40°C      +0.78 °C
suitable. Excessive warming will likely push ecosy-
                                                                                                        +0.67 °C                    +0.77 °C
stems beyond tolerance thresholds.

                                                                                                        -0.16                       -0.16
pH represents the acid/base status of marine waters,
where a decreasing pH reflects the acidification of                                              8.09      -0.12             8.08      -0.12
the ocean due to increased absorption of atmosphe-
                                                                                                        -0.09                       -0.09
ric CO₂.

                                                                                                        -2.55 %                     -1.72 %
Oxygen is fundamental to sustain marine life and its
reduction can have a large impact on coastal ecosy-                                          275.35
                                                                                             mmol/m3
                                                                                                         -2.04 %         306.27
                                                                                                                         mmol/m3
                                                                                                                                     -0.84 %
stem services including fisheries and aquaculture.
                                                                                                        -1.84 %                     -0.58 %

                                                                                                        +2.52 %                     +3 %
Chlorophyll is an indicator of the biomass available
at the base of the marine food web supporting all                                              0.6
                                                                                              mg/m3
                                                                                                         +14.77 %          0.63
                                                                                                                          mg/m3
                                                                                                                                     +3.79 %
ecosystem productivity.
                                                                                                        +1.17 %                     +2.37 %

FISH CATCH POTENTIAL                                                         ANALYSIS DETAILS
Fish catch potential is an estimate of the maximum fish catch achie-          All datasets were analysed using only data from within the
vable given the marine resources available over a sustained period. It       marine EEZ and therefore excluding overseas territories,
is linked to the concept of maximum sustainable yield, meaning the           detached islands and any disputed or joint territories with
maximum amount of fish that can be extracted from a system without            other nations. In the assessment of current climate conditions,
causing a collapse in fish populations.                                       seawater surface tempererature data was obtained using
                                                                             satellite observations distributed in the framework of ESA
It is a characteristic of the natural system, which is substantially         Climate Change Initiative.
different from realized catch, and a direct result of the fishery policy in
place.                                                                       Future projections of marine indicators are represented by the
                                                                             combined analysis of results from 15 different Earth System
                                                                             models participating in the Coupled Model Intercomparison
                                                               -3.3%         Project Phase 6 (CMIP6). These models include new and better
Fish catch                     2050                                          representations of physical and biogeochemical processes,
percentage                                                                   compared to previous IPCC assessment reports.
change                                                                       Fish catch potential data was obtained using the FAO's techni-
                                                               -1.3%         cal report and refers to the best and worst case climate scena-
                                                                             rios from the Fifth IPCC Assessment Report. These mean
                                                                             estimates are subject to substantial uncertainties as discussed
                                                                             in the original work.
ARGENTINA

COASTS
OVERVIEW
Argentina's coastline faces the Southern Atlantic Ocean
and extends for 8,397 kilometres. The main coastal
cities are Buenos Aires, Mar del Plata and Bahia Blanca.                         Shoreline                             8,397 km
Three main regions can be distinguished running north                            Length
to south: the fluvial region, with the estuaries of the
Paraná and Uruguay rivers; the Plata River region, with
the capital Buenos Aires which is the most densely
populated, urbanized, and industrialized area; and the                           Sandy
southern coastline, including the more pristine Pampe-
an and the Patagonian regions.                                                   Coast Retreat                                            -92.7 m
                                                                                 at 2050

CLIMATE CHANGE HAZARDS
Coastal hazards such as erosion, storm tide inundation and permanent            shores of Argentina are generally on high ground with cliffs or steep
flooding, can have strong adverse impacts on coastal regions, with               terrain near the shore. For this reason, significant loss of land with
loss of sandy shores, damage to settlements, infrastructure and ecosy-          high impacts on populated areas is not expected. However, some tidal
stems. Climate change can exacerbate these impacts due to rising sea            islands south of the city of Bahia Blanca, in the extreme south of the
levels and increasing impacts of waves and storms. The populated                Province of Buenos Aires, are the exception and may be affected.

SEA LEVEL RISE                                                                  EXTREME SEA LEVEL
Relative sea level rise has been observed over the past century around          Extreme sea levels are expected to increase in line with sea level rise,
the coast of Argentina, with a yearly average increase of 1.42 millime-         increasing the frequency of damaging high water level conditions. On
tres per year since the 1990s. The latest IPCC projections indicate that,       average, one in 100 year extreme sea level events in Argentina are
by 2050, global sea levels may rise between 0.18 metres, under a low            expected to rise from 3.60 metres at present day to 3.81 metres by
emissions scenario, and 0.23 metres, under a high emissions scenario.           2050, under a medium emissions scenario.

                                                                  0.23 m                                                                           3.88 m
Observed and                                                                    Current and
projected sea                          1.42                                     projected extreme                    3.6 m                          3.81 m
level rise at 2050              mm/year                                         sea level at 2050
                                                                  0.18 m

  OBSERVED                                                                         FUTURE
 STORMS            Argentina is mainly influenced by the South Atlantic
                   wave climate, with most waves and wave energy coming
                                                                                 STORMS           A southward migration of tropical cyclones from the
                                                                                                  tropics due to warming water surfaces can be expected,
                   from the south and south-east quadrants. Analysis of                           with increasing exposure of Argentina’s coast to tropical
                   trends from the last few decades reveal an increment in                        storms. Rising sea levels will also increase the frequency
                   the frequency, height and duration of the storm surges, in                     of extreme sea level events, such as the one in 100 year
                   particular in the Río de la Plata region, with increasing                      water level.
                   erosion. The Río de la Plata estuary is also affected by
                   significant storm surges several times per year.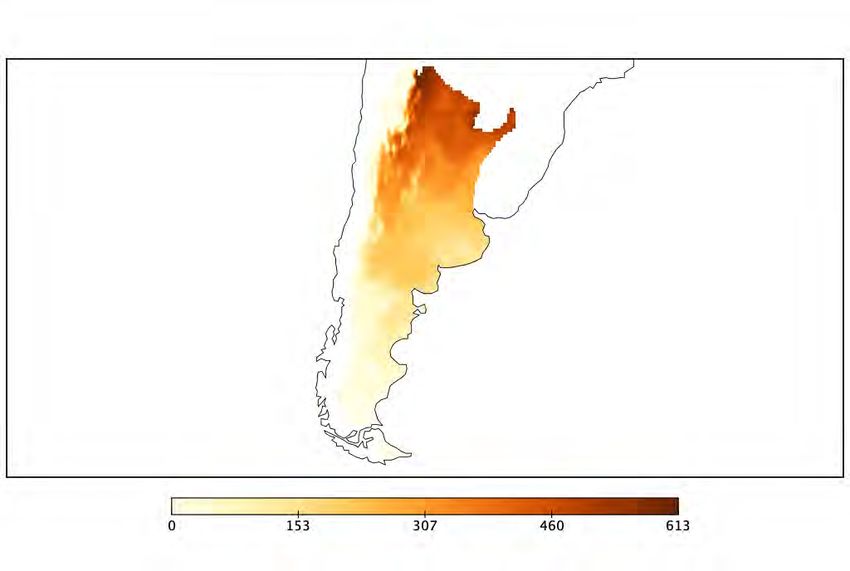
VULNERABILITY AND RISK
         A significant portion of people living in Argentina                                                             VULNERABLE
         reside in coastal zones, with about 3.6 million people                                          HISTORICAL     POPULATION
         living in low elevated lands below 10 metres above sea
         level, which amounts to approximately 1.9% of the land
         area of the country. Based on current projections the
         population of Argentina living in low lying coastal areas                                    0.01 Million
         could grow to 7.6 million by 2060.

                                                                                                                                      0.02 Million
                                                                                                           2050

         The coast of Argentina is at risk from the impacts of sea level rise and                                                       0.02 Million
         storm surges, in particular the urban areas around the Plata River,
         including Buenos Aires, and other smaller cities further South, such as                                                      0.02 Million
         Mar De Plata. Most coastal areas further south have relatively minor
         risk from coastal erosion and floods, given the lack of densely popula-
         ted areas. More specifically, the population exposed to the annual
         coastal flood level is expected to increase from 10,000 to 20,0000                                                            0.07 Million
                                                                                                           2100
         people under a medium emission scenario by 2050.
                                                                                                                                        0.04 Million

                                                                                                                                      0.03 Million

                           INFLUENCE OF SEA LEVEL RISE
                           ON EXTREME SEA LEVEL                                              + Wave set up refers to the accumulation of water near
                                                                                             the shore due to the presence of breaking waves.
         Present and future sea level rise are a consequence of
         carbon induced global warming causing melting ice                                   + Storm surge is an occasional increase in sea level driven
         and ocean expansion due to heat accumulation.                                       by shoreward wind-driven water circulation and atmo-
                                                                                             spheric pressure.
         The extreme sea levels reported here are based on the 100-year storm
         surge + wave set up + sea level rise + high tide indicators. The first two           + High tide is usually the highest tide reached in a given
         parameters (storm surge + wave set up) are based on the 100-year                    location based on tide records.
         value for the event; sea level rise is its projected value at 2050; and
         high tide is the absolute value of the highest tide calculated for a
         given locality, which won’t be influenced by climate change.

                                                                                                                                                 Wave set up
                                                                                                                                                         Storm surge
         Wave set up                                                                                                                             Storm surge
Storm surge
        Storm surge
          Lowest  tide

            Mean sea level                                                  Extreme     Mean sea level
                                                                                                                                                 Sea levelSea
                                                                                                                                                           riselevel rise
Sea levelSea
          riselevel rise                                                    sea level
                                            0m elevation (AHD)                                                         0m elevation (AHD)
Hig tide Hig tide                                                                       Lowest tide                                                   Hig tide Hig tide

         Present sea levels have risen globally by approximately 20 centime-            Future sea level rise is a projection based on different global
         tres over the past century.                                                    warming scenarios, at approximately 100 centimetres by the end of
                                                                                        2100, with consequent inundation during extreme sea level events.
ARGENTINA

WATER
OVERVIEW
Argentina can be divided into three climatic and hydro-
logical regions: humid, semi-arid and arid.                                 Renewable internal                     292
                                                                            freshwater resources              billion m3
Around 76% of the national territory is subject to
conditions of aridity or semi-aridity, with average rain-
fall of less than 800 millimetres per year and 85% of
surface water belonging to the La Plata River basin in
the urbanized east. Argentina is a water-rich country                       Renewable internal                  6,629
with an uneven distribution of water resources.                             freshwater resources                     m3
                                                                            per capita

                                                                           The Rio De La Plata Basin, which concentrates more than 85% of total
                                                                           national water resources, is the largest center for human settlements,
                                                                           urban development, and economic activity in the country.

CLIMATE CHANGE HAZARDS
Climate change can affect water resources due to increasing tempera-       resources. The highest increases in precipitation (from 1960-2010)
tures, higher rates of evapotranspiration and altered rainfall patterns.   occurred in the eastern parts of the country. In the northern regions,
This leads to changes in the water cycle, including decrease of snow       the increase in precipitation has led to more variability in precipita-
and ice coverage, alterations in surface runoff and groundwater            tion annually, with a higher risk of droughts and consequently
storage, as well as drought and flood occurrence. In Argentina, precipi-    affecting agriculture.
tation patterns and temperatures are changing, affecting water

KEY POINT RUNOFF
There is very little annual rainfall with less than 1% of available
surface runoff in very arid and semiarid provinces, such as San Juan or
La Rioja.                                                                                                                             +5.7%
                                                                           2050
The Andes region is particularly at risk in terms of runoff, with most
                                                                                       Changes in
climate models projecting marked surface runoff decreases in the                       annual runoff
area. Instead, at a country scale, an average increase in surface runoff               % of change
by approximately 21% and 6% is expected, respectively, under the low                                                                  +20.6%
emissions and high emissions scenarios for the 2045 to 2055 period,
compared to 2015 to 2025.

If temperatures rise by 1.5°C, 2°C or 4°C, 2%, 3.9% or 12% of the                                                                     +12.0%
                                                                           2050
country will likely experience an increase in runoff, whereas 23%,
36.1% or 50% of the surface of the country will likely experience a                   Runoff increase
respective decrease in runoff.                                                        % of area

                                                                                                                                      +2.0%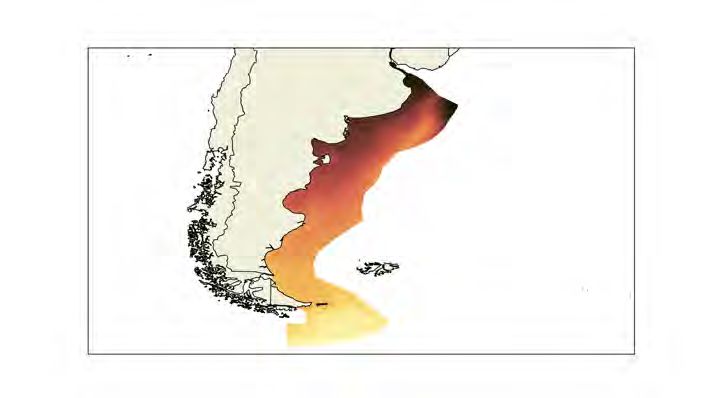
KEY POINT DROUGHTS
                                                                                                                                 +21.9%
The Salta province goes through periodic droughts and contributes to
Argentina's desertification at a rate of 2,500 kilometres per year.
                                                                          2050     Severe drought
Wide-scale clearing of forests in the Gran Chaco (covering southern                likelihood increase
Bolivia, western Paraguay, and northern Argentina) to make way for                 % of change
soybean planting has accelerated the process. The Pampas region is                                                               +15.9%
also severely affected by episodic drought events in 2008-2009 and
2017-2018.

These episodes are mainly driven by large-scale atmospheric circula-                                                             +13.0%
tion, such as El Niño, but likely strengthened by climate change. The
likelihood of severe droughts in Argentina is expected to increase by
                                                                          2050     Hydrological
15.9%, 17,9% and 21,9% (2040-2059) under low, medium and high                      drought frequency
emissions scenarios. Similarly, If temperatures rise by 1.5°C, 2°C or              % of change
4°C, hydrological drought frequency is expected to increase by 11%,                                                              +11.0%
12.2% and 13%, respectively.

                                                                                                                                 -17.2%
KEY POINT GROUNDWATER                                                     2050     Groundwater
Argentina's groundwater use has increased significantly over recent                 Recharge
decades due to its generalized presence, high reliability during                   % of change
droughts and decent quality in most cases. Current effects of climate
change can be seen through the spatial variations of the groundwater                                                             +10.6%
availability, also compromised by the more frequent prolonged
drought periods. In Argentina, the increase in evapotranspiration may
significantly affect those aquifers with a water table close to the        At the country level, a +10.5%, -3%, and -17.2% change of the annual
ground surface. The water demand is also expected to be higher due        groundwater recharge for 2045-2055 compared to 2015-2025 is
to the heat and lower availability of surface water.                      expected under low, medium, and high emissions scenarios.

KEY POINT FLOODS                                                          POPULATION AFFECTED BY RIVER FLOODS
Floods affect some of the population and infrastructure and have a
strong impact on agricultural productivity, one of the country's main      TODAY                                                   266,258
economic activities. The fluvial systems in Argentina can be classified                                                                 people
into three main groups: large tropical rivers, torrential rivers with
headwaters in mountain areas, and flat-plain rivers with insufficient        2050 SSP3                                              1,107,082
drainage efficiency.                                                                                                                   people

In April 2013, the northeastern section of the Buenos Aires province
                                                                           2050 SSP5                                               875,209
experienced severe flash floods, leading to 101 casualties and exten-                                                                   people
sive damage, with scientists agreeing on the important role of climate
change in this disaster. Changes in the population exposed to floods       to 1,100,000 under SSP3 and 875.000 under SSP5 by 2050. As such,
are expected, with an increase from about 266,000 in the present day      potential impacts related to river floods might increase.

RISK INDICATORS
The water stress index summarises current and future water related
vulnerabilities and risks at the global level. Scores are based on the
ratio of total water withdrawals, including agriculture, industrial and
human consumption, to available renewable surface and groundwa-
ter supplies.

WATER STRESS
Argentina's water stress level is considered low-medium for the recent
past (1960-2014 average), and it is expected to increase in the near
future (2030-2050) based on climate change projections.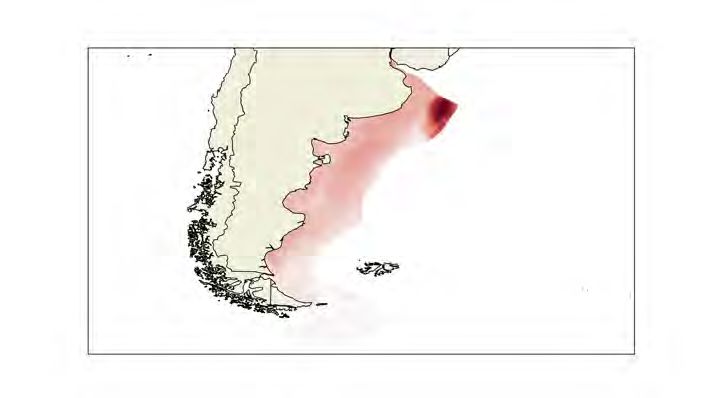
ARGENTINA

AGRICULTURE
OVERVIEW
Argentina is a leading food producer that relies on
abundant and fertile land, together with significant
water resources. Recent decades have seen an expan-
sion in the agricultural and irrigated area for the
production of key agricultural commodities, mainly                             43.5 Mt               37.8 Mt              18.5 Mt
focused towards export.                                                          Maize               Soybeans           Sugarcane

Most grain and oilseed production (wheat, maize, soybean) is concen-
trated in the Pampas region, whereas the production of higher-value
crops such as fruit, vegetables and sugarcane takes place outside of
the Pampas.

Though water stress in the country is considered to be relatively
limited (10.5%), agricultural sector water use to support irrigation is         18.5 Mt               3.5 Mt               2.6 Mt
substantial, accounting for 74% of total water withdrawal in 2017.              Wheat                 Citrus               Grapes

Added Value of Agricultu-              Share of Agriculture                   Agricultural                           Area Equipped
 re, Forestry and Fishing            Value added in Total GDP                    land                                 for Irrigation

                                2000                                   2000                           2000

          23,530                                 5.5 %                          28,640                                      1,565
         USD Million                                                          Thousand HA                               Thousand HA

                                2018                                   2018                            2018

          28,024                                4.4 %                           40,268                                      2,360
         USD Million                                                          Thousand HA                               Thousand HA

EXPECTED IMPACTS
ON AGRICULTURE PRODUCTIVITY                                                                                                 Rising
                                                                                                                      temperatures
                                                                                     Changes in
Rising temperatures, reduction in average annual precipitation, and                  precipitation
intensification of extreme events such as heat waves and drought,                     patterns
affect production variability with a tendency towards yield                                                                  Increased
reduction for many cultivated species, accompanied by a probable                                                      frequency of dry
decrease in food quality. Crops respond to increases in temperatures                                                spells and drought   Temperature
with changes in duration of the growing season, early appearance of                                                                        variability
phenological phases and potential shifts of cultivation areas toward                                   Increasing intensity of
higher latitudes and altitudes for better growing conditions. Howe-                                    extreme weather events
ver, impacts vary significantly depending on the geographical area
and specific crops in question.
CROP PRODUCTIVITY 7 -1.5 (-2.9)% 2.8 5.2 (-4)%
Crop productivity refers to the harvested yield of a crop per unit of
land area. It is strongly influenced by climate and other environmental -1.8 (-3.0) % 7.4 (-6.6)%
and management factors. Maize Soybeans
tons / ha tons / ha
Climate change is expected to have an impact on the productivity of
several major crops, although this may in part be offset by the fertili- 3.2 0.8 (-5)%
zing effect of higher CO₂.
2.9 (-7.3)%
Impacts are estimated using a range of model projections based on Wheat
tons / ha
low to high emission scenarios and reported as percentage changes
between the 30-year average around the historical period and the
30-year average around 2050. Productivity change with (without) the CO₂ fertilization effect.
2050
Estimates assume sufficient water and nutrient supplies, and
do not include impacts of pests, diseases, or extreme events.
CHANGE IN MAIZE CHANGE IN WHEAT
_ = + _ = +
Maize yield is projected to decrease in most areas, excluding some most areas. Projections highlight enhanced prolonged winter
central coastal areas where precipitation patterns during the growing droughts and reductions in spring rainfall over central regions, this
season remain consistent. Soybean cultivation may benefit from may pose significant risks to wheat productivity. Yield and quality of
climate change, with consistent increases of up to 10% in productivity grapes may suffer diverse impacts, with colder climate wine-growing
in the Pampas region where an increase in summer rainfall is regions favoured. This may lead to shifts of wine-growing towards
expected. Wheat will witness some yield gains in the Pampas, and cooler areas (higher latitude or altitude).
general decreases outside this region, particularly in the northern-
ADAPTATION IN AGRICULTURE AND WATER RESOURCES
Climate change may have some positive effects on some of the most ted farming systems (like grapevine cultivation in the West) have
widely used crops. However, higher temperatures will generally allowed for significant intensification of productivity. In the future,
require an increase in irrigation due to higher plant evapotranspira- further expansion of irrigation in water stressed areas, together with
tion and expansion of irrigated areas. This implies increased pressure changes in glacial melt and reduced river stream flows, could pose
on water withdrawal from the agricultural sector to maintain additional stress on freshwater resources prompting use of groundwa-
production and ensure food security. Currently, irrigation is relatively ter for irrigation.
limited and covers around 5% of Argentina’s agricultural lands. Irriga-
CHANGE IN WATER DEMAND
_ = +
Agriculture
Water Demand +11.3%
% of change
+11.1%
2050
Increase in water demand, associated with the expansion of
irrigated areas, will require adaptation practices that favour
water-use efficiency and limit the increase of stress on
water resources.ARGENTINA
FORESTS
FORESTS IN ARGENTINA
Given territorial and climatic conditions, Argentine 1990
forests (of which 6% are considered primary) are
characterized by extreme variety.
In recent decades, deforestation has significantly limi- 35 Mln ha 154 Tons/ha
ted the strategic ability of forests to fight the climate Million hectares Tons of Carbon per hectare
emergency through carbon dioxide absorption. Forested area Carbon stock
2020
FORESTED AREA AND CARBON STORAGE
Argentinian forests cover no more than 10% of the country and in
recent decades this area has been shrinking. According to the Argenti-
nian Second Biennial Update Report (BUR), deforestation (albeit a 29 Mln ha 163 Tons/ha
decreasing rate) contributes to 14.5% of the country’s total emissions. Million hectares Tons of Carbon per hectare
Forested area Carbon stock
FOREST PRODUCTIVITY 2050
Forest productivity or Net Primary Production is the net carbon captu- Productivity anomaly +0.52
red by plants. It is the difference between the carbon gained by Gross Tons of Carbon per
hectare per year
Primary Production - net photosynthesis measured at the ecosystem +0.30
scale - and carbon released by plants' respiration. It is expressed per
unit land area.
A generalized increase although weaker in the north.
Potentially pronounced increase only in scarcely
forested areas such as the Pampas.
Decrease expected in montane cloud forest
production in the southernmost area of the Catamarca
(24-27°C south).
+ Increase in the duration and severity of drought events which is
not sufficiently balanced by the fertilizing effect of CO₂ whereby
carbon dioxide stimulates photosynthesis
KEY SPECIES
THERMOPHILIZATION CONTRACTION
ANDEAN FORESTS CLOUD FORESTS
UNDER Pronounced thermophilization of Andean
forests, leading towards a higher dominance
Expected contraction of key species ranges
CLIMATE of warm-adapted species
CHANGE VULNERABILITY
NOTHOFAGUS
SHIFT
MONTANE FORESTS
Increasing vulnerability of various Expected upward shifting of montane forest
Nothofagus species to droughts across their ecosystems
entire range of distributionFIRES IN ARGENTINA WHERE DO FIRES OCCUR?
Fire is a structural ecological process that provides several types of 2.5% of the Andean cypress
ecosystem services and impacts on socio-ecological systems, forest, one of the most impor-
including human health, carbon budgets, and climate change. Changes tant tree species of central
in global fire activity are influenced by multiple factors such as Patagonia, burns annually
land-cover change, policies, and climatic conditions. Fire also releases generating up to 245 tonnes of
large quantities of greenhouse gases into the atmosphere, contribu- CO₂ per hectare.
ting to a vicious cycle.
During the last two decades, the total land area affected by fire was
approximately 21.5 million hectares of which 27% involving forests.
BURNING EMITTING
21.5 MILLION HECTARES 14 TERAGRAMMES OF
CARBON PER YEAR
The central mountainous
regions of the Sierras de
Córdoba and the Andean
temperate forests are the most
affected in terms of area
SAVANNA FIRE EMISSIONS 0.57 TERAGRAMMES OF CO₂
CONTRIBUTED TO EMITTED ANNUALLY BY NATIVE burned and fire frequency.
53.5% OF TOTAL FIRE RELATED FOREST FIRES IN CENTRAL AND
CARBON EMISSIONS SOUTHERN PATAGONIA
FUTURE BURNED AREA WILDLAND URBAN INTERFACE
Under a low emission scenario, the burned area might potentially
increase in the northern Montane Grasslands and Shrublands. Also Wildfires are a major threat to people and property, parti-
south eastern Temperate Grasslands, Savannas, and Shrublands might cularly within the Wildland Urban Interface (WUI) which is
experience a slight increase in burned area. Under a medium the transition zone between houses and wild vegetation
emission scenario, models project accentuated burned area in areas.
northern mountain areas. In central Argentina, around 15% of the territory is classi-
fied as WUI and a high percentage of buildings are located
in the WUI. Furthermore, most of these buildings are found
in areas with high burn probability and where historically
2050 fires have already occurred.
Burned Area +734 In this context, forest fires contribute significantly to urban
km² per year air pollution and particulate matter. For example, during
-314 the winter and spring of 2013 there was a strong presence
of PM2.5 concentrations as forest fires episodes
occurred around Cordoba city in central Argentina.
FUTURE FIRE EMISSIONS
Under a low emission scenario fire emissions might increase in the
north and west Temperate Grasslands, Savannas and Shrublands
of the Humid Pampas, the Espinal and the Dry Chaco. Under a
medium emission scenario, a generalized increase might be more
intense throughout mountainous areas in the North.
2050
Decrease in burned areas for a low emissions scenario Fire Carbon emission -4.6
Teragrams of Carbon per
year
-12.8
Increase in burned areas for a low emissions scenario
+ Increased risk of warming and drought in southern ArgentinaARGENTINA
URBAN
OVERVIEW
Over 92% of theA rgentine population lives in urban 2020
areas, and an urbanization rate of 95% is expected by
2050. 41,919,857
Population in
The urban population is unevenly distributed and Urban Areas
highly concentrated. 35% of people live in the Greater 2050 52,564,488
Buenos Aires area and a few other large cities, whereas
most others other inhabit smaller urban agglomera-
tions around the country.
Built up areas cover 0.32% of the country (8,897.11 Graphs refer to data provided by United Nations, Department of
Economic and Social Affairs, Population Division (2018).
square kilometers). World Urbanization
2020
92.1%
Urbanization
Rate
2050 95.2%
OVERVIEW OF KEY
CLIMATE IMPACTS IN URBAN AREAS
Key impacts on urban areas regard flooding from rivers and in urban
areas and heat stress from increasing frequency and intensity of
heatwaves. +59.5%
2050
Cooling
HEATWAVES AND HEAT STRESS Degree Days +23.7%
Observations show a general increase in the number of warm nights, % of change
alongside an increasing frequency of heatwaves in particular in the +15.1%
most recent period.
This affects major urban centres the most. In Buenos Aires, a particu- +91.8%
larly intense and long heatwave in 2013, with daytime temperatures 2050
Heatwave
up to 40°C, caused an increase in daily deaths by 43%. The elderly frequency +60.1%
were the most affected with mortality among over 84-year-olds rising % of change
by 51%. +37.0%
Energy supply in the metropolitan area of Buenos Aires collapsed due
to intense demand for air conditioning. With rising temperatures the
frequency and duration of heatwaves is expected to increase. This will +6,247%
impact living conditions in urban areas significantly with higher 2050 Heatwave
temperatures due to the urban heat island (UHI) effect. +1,032%
duration
% of time
+379%INTERACTIONS BETWEEN
HEAT AND AIR QUALITY
2017
Heat related health impacts from increasing air temperatures in urban Population exposed
areas are accentuated by air pollution. In Argentina, more than 90% of 93.9%
the urban population is exposed to unsafe levels of pollution such as
to air pollution
PM2.5, which regularly exceed the threshold values recommended by
the WHO.
In Argentina, more than 90% of the urban population is exposed to
unsafe pollution levels, for instance of PM2.5, which exceed the
threshold values recommended by the WHO.
COASTAL FLOODING 2050 0.23 m
Despite decreasing annual precipitations an increase in frequency and
intensity of extreme rainfall events will expose most urban areas
tomore frequent flooding.
Projected 0.18 m
Flooding from sea level rise presents risks for the estuary of the Rio de
la Plata and will also affect the capital city of Buenos Aires. If sea sea level rise
levels rise by 50 centimetres these cities woud triple their exposure to 0.77 m
the risk of flooding. 2100
EXTREME PRECIPITATION EVENTS 0.38 m
Argentina faces challenges related to changing precipitation
patterns, with increasingly frequent extreme precipitation events
exposing urban areas to flooding. +12%
2050 Runoff
Although Argentina has invested in infrastructure to protect from
flooding, precipitation events continue to cause damages. In Buenos
increase +4%
% of area
Aires nearly 200,000 people and at least 32 other cities have recently
been affected by floods with over one million people exposed to this +2%
risk. Despite decreasing annual precipitations an increase in frequency
and intensity of extreme rainfall events will expose most urban areas
tomore frequent flooding.
SURFACE SEALING Heavy precipitation in cities is problematic due to the high level of sealed surfaces. Soil sealing
increases run off and reduces the amount of water absorbed by soil. Where there are large amoun-
AND FLOODS ts of impervious ground cover, short duration extreme rainfall events can lead to increased
flooding, even resulting in flash floods.
2010 % of urban population
INEQUALITIES IN FLOOD RISK Population 14.7%
Both low and high income households settle in flood prone areas or living in slums
on steep ground. However, disadvantaged groups have less possibili-
ties to apply flood protection measures to their homes, lobby for
protective infrastructures or obtain flood insurance
% of total population
Urban population
2018
living in areas 2.1%
where elevation is
below 5 metersARGENTINA
HEALTH
OVERVIEW
Argentina’s sub-tropical climate is highly appropriate Mean annual temperature was seen to increase by
for the transmission of vector-borne diseases such as 0.5°C and by 1°C in the Patagonia region over the past
dengue, malaria, chikungunya, Zika, and leishmaniasis. 50 years. This projects up to 2°C and 4°C increase in
Rising temperatures will expand the range, seasonality, the south and north of the country. This is expected to
and distribution of vector-borne illnesses such as bring higher levels of hydric stress and increased drou-
malaria and Zika. Projections suggest that the potential ght, and desertification. The incidence of waterborne
spread of these diseases will result in the number of diseases and the distribution of food and vectors may
people exposed being tripled by the end of the century. also be affected.
HEAT RELATED MORTALITY
Warming and increased frequency and duration of heatwaves have
resulted in an increase in excess mortality and mortality risk in Argen- Heat-related mortality
% change with respect to 2000-2004
tina over the last two decades. In 2018, there was a 54% increase in
heat-related deaths from a 2000 to 2004 baseline. 20.5% of heat
related mortality in Argentina during 1991 to 2015 can be attributed
to human-induced climate change.
2018
+54%
IMPACTS ON LABOUR
Labour is directly affected by changes in environmental conditions.
Warming affects both the number of hours worked (labour supply) and Impact on total labour
% change with respect to 1986-2005 baseline
on the productivity of workers during their working hours (labour
productivity). Both labour supply and productivity are projected to
decrease under future climate change in most parts of the world, and
particularly in tropical regions. Parts of sub-Saharan Africa, south Asia,
and southeast Asia are at highest risk under future warming scenarios. 2050
Future climate change will reduce global total labour in the
low-exposure sectors by 18 percentage points and by24.8 percentage
points in the high-exposure sectors under a 3°C warming scenario
-2.9 %
Warming and heatwaves are projected to affect labour in high-expo-
2080
-5.9%
sure sectors in Argentina. In the agriculture and construction sectors,
there was a 49.7% decline in potential hours of labour in 2019
compared to a 1990s baseline. Total labour in Argentina is expected
to decline by 2.9% under a low emissions scenario, and by 5.9% under
a medium emissions scenario.CLIMATE CHANGE AND DENGUE
Dengue has spread throughout the tropical world over the past 60
years and now affects over half the world’s population. Globally, vecto- Dengue suitability
rial capacity for both dengue vectors (A. aegypti and A. albopictus) has % of population at risk
been rising steadily since the 1980s, with nine of the ten highest years
occurring since 2000.
Climatic stressors are one important driver of the current distribution 93.2%
and incidence of dengue. Climate change is likely to expand the 2050
geographical distribution and suitability of several vector-borne
human infectious diseases including dengue. The risk of dengue 93.2%
transmission is increased by warming climates, as the growth and
development of mosquitoes are significantly influenced by temperatu-
re, precipitation, and humidity.
CLIMATE CHANGE AND ZIKA
Zika virus has spread to at least 49 countries and territories since 2013.
Climate change impacts on transmission suitability risk have increased
over the years and future warming over 1.3 billion additional people
could face suitable transmission temperatures for Zika by 2050.
Zika suitability
% of population at risk
DENGUE AND ZIKA: POPULATION AT RISK
Argentina is already at risk of an increase in climate-induced infectious
diseases and these risks will increase due to future climate change.
88.4%
Climate change may extend suitability conditions for vectors and help
2050
them spread southwards.
54.0%
Under a medium emissions scenario, 93.2% of the population will be
at risk of transmission-suitable mean temperature for dengue by 2050,
whereas 92.5% will be at risk under a high emissions scenario.
In the case of Zika, 54% of the population will be at risk by 2050 under
medium emissions, whereas 88.4% will be at risk under high
emissions.
CLIMATE CHANGE AND MALARIA
Rising temperatures will expand the range, seasonality, and distribu-
tion of vector-borne illnesses such as malaria and Zika. Under a low Malaria suitability
emissions scenario, 42.2% of the population will be at risk of malaria % of population at risk
in 2050. Under a high emissions scenario, this will increase to 44.1% of
the population.
44.1%
2050
42.2%ARGENTINA
ENERGY
ENERGY SYSTEM IN A NUTSHELL ENERGY SUPPLY
Argentina’s energy mix is dominated by oil (for tran- The current (2019) energy mix of total primary energy supply in
sportation) and natural gas (for electricity generation). Argentina is strongly dominated by fossil fuels (32.8% oil, 54.9%
natural gas, 1.74% coal, totalling 89.4% of total primary energy
Domestic production of oil is almost entirely absorbed supply), followed by renewable sources (8.3%). There is also some
by the internal market. residual nuclear power generation (2.3% of total primary energy
supply). Imports are negligible, as the country is largely self-sufficient.
Over 25% of electricity generation comes from Electricity generation relies mostly on natural gas (69% of electricity
renewable sources. The country's geographic features fuel mix in 2018) and hydropower (12%).
result in a wide variety of climates and hence of
heating and cooling needs.
0.10 9%
ktoe/US$
Energy intensity Import
5.4% dependence ratio
AC Share in
electricity consumption
CLIMATE CHANGE TODAY
HEATING
Temperatures have increased on average by
1°C during the last century with uneven
patterns across the country, with minimum
temperatures increasing more than
maximum temperatures, pointing to decrea-
sing heating needs.
HYDROPOWER
Hydropower is already under threat due to
water scarcity in the north, north-east and
Cuenca de La Plata, and the marked
shrinking of Andean glaciers is hinting to an
intensification of this pattern in central and
southern regions as well.
ENERGY DEMAND
In Argentina, energy is used mainly for transport (31.6% of final
demand in 2018), industrial uses (29.5% including 6.5% for non-ener-
gy uses) and residential (24.7%), followed by commercial use (8.1%),
and agriculture (6.1%). Air conditioning’s contribution to residential
electricity demand is still moderate (5,4% in 2017).FUTURE ENERGY DEMAND
Argentina has a variety of climates ranging from the freezing polar
tundra of the Tierra del Fuego and alpine in the Andes, to temperate
in Buenos Aires, and a subtropical climate in the north.
Net change in 2050
+ 30.84
energy demand due to
Hence both effects on heating and cooling needs are expected to be changes in HDD/CDD
significant. Overall, cooling needs will prevail, leading to an increase Billion KWh
of 111 PJ (or 31 million KWh) by 2050 under a medium emissions
scenario.
COOLING NEEDS COOLING DEGREE DAYS 0 613
Cooling degree days will undergo very
marked increases along the northern
border, and loose intensity along the
north-south axis, although with signifi-
cant magnitude on the northeast coast
(where Buenos Aires lies).
Negligible variations in the sparsely
inhabited south and on the mountains.
HEATING NEEDS HEATING DEGREE DAYS -742 0
Highest decrease in heating degree days
in the Andean regions in the north of the
country, followed by the southern, cold
regions of Patagonia and Tierra del Fuego.
Moderate decreases in the central/east
coast, including the Buenos Aires area.
Negligible changes on the northern
border.
FUTURE EXPECTED IMPACTS
ENERGY SUPPLY OF CLIMATE CHANGE
The future configuration of Argentina's energy mix is likely to be The main concern regards water availability reduction for hydro-
determined by the evolution of climate mitigation policies and hence power and cooling of thermal power generation plants. However,
is outside the scope of this report. At the time of writing, there were no there is a lack of quantitative estimates of expected impacts.
confirmed long term decarbonization commitments in place.
-3.69%
Change in 2050
Hydropower generation -2.99%
% of changeARGENTINA
ECONOMY
OVERVIEW
Argentina ranks 19th in terms of GDP in the G20 group.
Although badly hit by the COVID 19 pandemic, recor-
ding a 10% decline in real GDP in 2020, the trend has
reversed in 2021, with 5.8% growth in real GDP. 1.2/2.78%
2050
0.71/0.8%
IMPACTS ON GDP GDP Loss
Argentina could experience systemic losses and negative growth % change w.r.t baseline
impacts due to climate change. GDP losses by mid century could be up
to 2.8% of GDP or 8.8 billion EUR under a high emissions scenario.
8.17%
By the end of the century, GDP is projected to decline by 2.5% or 2100
7.9 billion EUR under a low emissions scenario and by 8.2% of GDP or
25 billion EUR under a high emissions scenario.
2.5%
SECTORAL ECONOMIC IMPACTS
IMPACTS ON AGRICULTURE IMPACTS ON ENERGY
With 47% of land used for agriculture, and almost 7% of GDP produced As with all other economic sectors, energy supply and energy networks
by agriculture, forestry and fishing, climate change impacts on agricul- in Argentina will undergo more intense stress from extreme weather
ture present a significant risk to the overall economy. events.
It is estimated that a temperature increase consistent with a medium Economic impacts of shifts in household and firm energy demand (see
emissions scenarios (between 2°C and 3°C) may decrease agricultural chapter on energy) are difficult to predict and will mostly lead to
net revenues by 20% to 50%. redistribution effects.
However, Argentina is also the world’s third largest exporter of soybe- In the case of Argentina, the magnitude of the increase in demand for
ans, and the second largest exporter of maize, two crops that, all other cooling is expected to slightly exceed the one of decrease in heating
factors equal, respond well to rising temperatures. As a matter of fact, demand, leading to a moderate increase in energy bills.
yields of both crops are projected to increase under both a medium
and high emissions scenario.
Wheat production is more volatile: delines are expected by mid-cen-
tury, but potential gains could be registered at the end of the century
under a high emissions scenario due to the CO₂ fertilization effect.1.1
2050
SEA LEVEL RISE DAMAGES
Under current levels of coastal protection, by mid century, sea-level
rise and coastal flooding may cost the country 0.7 to 1.1 billion EUR in
terms of expected damages to assets in low and high emissions scena-
rios respectively. 0.7
By the end of the century, expected losses can increase to 1.1 billion
Sea Level Rise
Expected annual damages
EUR in the low emissions scenario and to 4 billion EUR under a high Billion Euro
emissions scenario.
4
2100
1.1
4.6
2050
RIVER FLOODING DAMAGES
River flooding may cause damage that has the potential to be even
more severe than that arising from sea-level rise.
By mid century total asset losses could reach 3.6 to 4.6 billion EUR, Riverine 3.6
and in the second half of the century 4.7 to 9.2 billion EUR under a low
and high emissions scenario, respectively. Flooding
Expected annual damages
Billion Euro
9.2
2100
4.7
IMPACTS ON TOURISM
In recent decades there has been a progressive trend towards prolon- However Patagonia will probably experience a reduction in the
ged summer climatic conditions during the first part of autumn in tourism linked with mountains and winter sports, due to the retreat of
most of Argentina. glaciers and the decreasing trend in precipitation and snow.
Climate projections show a similar trend for the rest of the century.
Both highest summer temperatures and extension of the warm period
would favor an increase in domestic tourism to beach areas and the
maritime coast.ARGENTINA
POLICY
OVERVIEW INTERNATIONAL COMMITMENTS
Although Argentina is the world's 8th largest country Argentina ratified the Paris Agreement and submitted its first NDC in
by surface, it has a low population density and accounts 2016, committing to a maximum level of yearly emission of 483
MtCO₂eq by 2030. In 2020, Argentina then submitted a second more
for only 0.8% of global emissions. In recent years the ambitious NDC, whereby yearly emission cannot exceed 359 MtCO₂eq
emissions trend has been unsteady, but in general by 2030.
emissions are still lower than the peak level registered CLIMATE POLICY
in 2005. COMMITMENTS CHRONOLOGY
288 396
MtCO2eq MtCO2eq
2001 KYOTO PROTOCOL - 1ST PERIOD
No target
2016 PARIS AGREEMENT - 1ST NDC
483 MtCO₂eq as the maximum level of yearly
emissions by 2030
2020 PARIS AGREEMENT - 2ND NDC
359 MtCO₂eq as the maximum level of yearly
1990 GHG EMISSIONS 2018
emissions by 2030
INTERNATIONAL CLIMATE The OECD DAC’s climate-related development financial data show that Argentina has received
3.2 billion USD. Almost all of it is provided in the form of debt instruments and comes from
FINANCE ASSISTANCE multilateral institutions. Mitigation is the main purpose.SUSTAINABLE RECOVERY POLICY ADAPTATION POLICY HIGHLIGHTS
According to the Global Recovery Observatory, in 2020 Argentina TRANSNATIONAL INITIATIVES
invested 7.34 billion USD in recovery. Post-covid policies were not
particularly green, with a negligible amount of sustainable invest- Regional and local climate risk management in
ments. Others: 4.387 Billion USD Brazil and Argentina
The objective is to build climate resilience in vulnerable populations
in Sao Paulo in Brazil and Cordoba in Argentina, reducing the risk of
floods and droughts
Climate change adaptation in vulnerable coastal
cities and ecosystems of the Uruguay River
23.44 7.34 0.10 The project aims to build resilience in coastal cities and ecosystems
billion $ billion $ billion $
throughout the Uruguay River, both in Argentina and Uruguay by
Total Spending Recovery Spending Green Spending developing shared instruments and tools for planning
NATIONAL INITIATIVES
DOMESTIC ADAPTATION POLICY National Forestry and Climate Change Action Plan
The plan aims to reduce GHG emissions and increase removals in the
Argentina has a specific adaptation objective in its NDC. Nevertheless, forestry sector, through a sustainable use of native forests for the
the country did not adopt an adaptation strategy or plan. There is no reduction of vulnerability
legal framework for adaptation planning at a sub-national or sectoral
level. System for Climate Change Risk Maps (SIMARCC)
The SIMARCC is a GIS that allows to visualize the risk maps of the
whole Argentinian territory. The platform targets local decision-ma-
Inclusion of Adaptation in NDCs kers for the development of local adaptation plans
Domestic Integrated Adaptation & Mitigation Policy
Adaptation Policy SUBNATIONAL INITIATIVES
Dedicated Adaptation Strategy
Buenos Aires Climate Change Action Plan 2050
Dedicated Adaptation Plan The Climate Action Plan 2050 sets out targeted measures to cut
greenhouse gas emissions (53% by 2030 and 84% by 2050) and
Sectoral Adaptation Plans increase resilience
Subordinate
Adaptation Policies Enhancing the Adaptive Capacity and Increasing
Subnational Adaptation Plans
Resilience of Small-size Agriculture Producers of the
Northeast of Argentina
The project aims to increase the adaptive capacity of smallholders in
Policy not in place Active policy the face of climate variability impacts, particularly floods and
droughts
ENERGY TRANSITION Energy Transition Fossil Fuels
Argentina shows an overall energy transition indicator a little over the average
value with respect to G20 countries. In particular, this position is due to its poor 58.7 45.3
performance in Electrification, 8 points below the average, whereas the Renewables
and Fossil Fuels indicators are just above the G20 average. 46.7
59.9
The transition pathway is well sustained by indicators such as Emissions and
Efficiency, where performance is definitely above average. Finally, Argentina shows Renewables Efficiency
indicators in line with the G20 average, with a wider margin for improvement.
19.7 84.9
21.2 87.4
Only actively pursuing an energy transition based on decarbonization and Electrification Emissions
electrification – from policy and regulation, to health and education – will
enable countries to benefit the most from future opportunities and fight
G20 72.9
AVERAGE climate change whilst ensuring an equitable distribution of wealth. 70.8 72.9
COUNTRY
The Energy Transition indicators were developed by Enel Foundation in
cooperation with SACE, and provide a retrospective analysis based on 62.8 81.1
historical data.You can also read