Application of Potassium Humate and Salicylic Acid to Mitigate Salinity Stress of Common Bean
←
→
Page content transcription
If your browser does not render page correctly, please read the page content below

Article

Application of Potassium Humate and Salicylic Acid to
Mitigate Salinity Stress of Common Bean
Hossam S. El-Beltagi 1,2,*, Hala Hazam Al-Otaibi 3, Aditya Parmar 4, Khaled M. A. Ramadan 5,6,
Allan Klynger da Silva Lobato 7 and Mohamed M. El-Mogy 8,*

                                         1 Agricultural Biotechnology Department, College of Agriculture and Food Sciences, King Faisal University,
                                           Al-Ahsa 31982, Saudi Arabia
                                         2 Biochemistry Department, Faculty of Agriculture, Cairo University, Gamma Street, Giza 12613, Egypt

                                         3 Food and Nutrition Science Department, Agricultural Science and Food, King Faisal University,

                                           Al-Ahsa 31982, Saudi Arabia
                                         4 Natural Resources Institute, University of Greenwich, Central Avenue, Chatham Maritime,

                                           Kent ME4 4TB, UK
                                         5 Central Laboratories, Department of Chemistry, King Faisal University, Al-Ahsa 31982, Saudi Arabia

                                         6 Department of Biochemistry, Faculty of Agriculture, Ain Shams University, Cairo 11241, Egypt

                                         7 Nucleo de Pesquisa Vegetal Basica e Aplicada, Universidade Federal Rural da Amazonia,

                                           Paragominas 68627-450, Para, Brazil
                                         8 Vegetable Crops Department, Faculty of Agriculture, Cairo University, Giza 12613, Egypt

                                         * Correspondence: helbeltagi@kfu.edu.sa (H.S.E.-B.); elmogy@agr.cu.edu.eg (M.M.E.-M.)

                                         Abstract: In the current study, we investigated the effect of potassium humate (Kh) and salicylic
                                         acid (SA) in mitigating the salinity stress of common bean plants. Common bean seedlings were
                                         treated with 0.2 g/L SA as a foliar application and 0.3 g/L Kh as a soil application individually or in
                                         combination. After 7 days of germination, plants were treated with 50 mM NaCl and normal water
                                         as a control. Our results indicate that salt treatment reduced the plant growth (fresh and dry shoots
                                         and roots), leaf pigments (total chlorophyll and carotenoids), ascorbic acid (AA), glutathione
                                         (GSH), and potassium (K) contents. On the contrary, proline content; sodium (Na); hydrogen per-
                                         oxide (H2O2); superoxide anion (O2•−); and antioxidant enzymes, including catalase (CAT), perox-
Citation: El-Beltagi, H.S.;
                                         idase (POX), and superoxide dismutase (SOD), were increased by saline stress. However, applying
Al-Otaibi, H.H.; Parmar, A.;             either individual Kh and SA or their combination stimulated seedling growth under salinity stress
Ramadan, K.M.A.; Lobato, A.K.d.S.;       by increasing growth parameters, leaf pigment contents, AA, GSH, proline content, K content, and
El-Mogy, M.M. Application of             antioxidant enzymes compared with the control. Additionally, Na content, H2O2, and O2•− were
Potassium Humate and Salicylic           reduced by all applications. The application of the Kh (0.3 g/L) + SA (0.2 g/L) combination was
Acid to Mitigate Salinity Stress of      more effective than using the individual compounds. In conclusion, applications of Kh + SA can
Common Bean. Life 2023, 13, 448.         mitigate salt stress and improve the seedling growth of common bean.
https://doi.org/10.3390/life13020448

Academic Editors: Balazs Barna,          Keywords: abiotic stress; antioxidant enzymes; humic acid; Phaseolus vulgaris; sodium chloride
Mohamed F.M Ibrahim and Ahmed
Abou El-Yazied

Received: 26 December 2022
                                         1. Introduction
Revised: 31 January 2023
Accepted: 3 February 2023                     Water and soil salinity have been among the main problems in the agricultural sec-
Published: 5 February 2023               tor in recent decades. Most economically essential crops are classified as moderate or
                                         severely sensitive to salinity. These crops have been reported to lose about 20–50% of
                                         their production due to exposure to salinity stress [1]. More than 33% of agricultural
Copyright: © 2023 by the authors.        lands are affected by salinity. Current estimates suggest that salinization is increasing by
Licensee MDPI, Basel, Switzerland.       10% annually due to factors such as irrigation with saline water, climate change, high
This article is an open access article
distributed under the terms and          temperatures, and high soil evaporation, as well as poor agricultural practices [2]. It is
conditions of the Creative Commons       estimated that by 2050, about 50% of cultivated lands will be affected by salinity [3].
Attribution     (CC    BY)    license
(https://creativecommons.org/license          Crops grown under salinity stress suffer from osmotic stress and a lack of nutrient
s/by/4.0/).                              supply [4]. These factors cause severe damage to plants, such as reductions in seed ger-

Life 2023, 13, 448. https://doi.org/10.3390/life13020448                                                                 www.mdpi.com/journal/life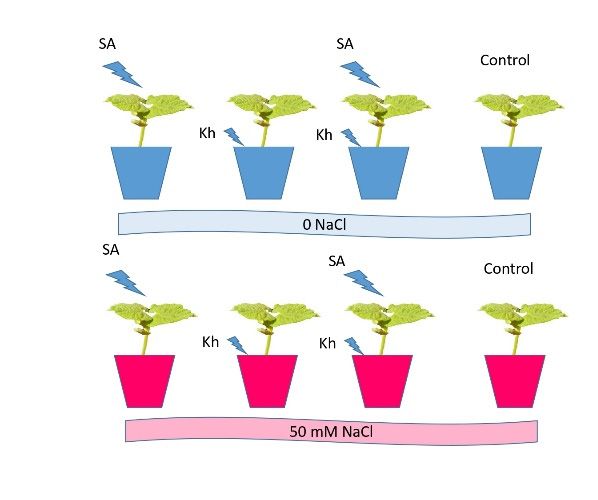
Life 2023, 13, 448                                                                                          2 of 18

                     mination, photosynthesis processes, growth, yield, and fruit quality [5–7]. Additionally,
                     several physiological processes in plants, such as respiration, protein synthesis, lipid
                     metabolism, enzyme and hormone activities, and gene expression, are affected by salinity
                     [8,9]. The effect of salinity on plants occurs first during an early stage of growth known
                     as the osmotic phase and then during a late stage of growth known as the ionic phase
                     [10]. Plant response to salinity depends on the salinity level, growth stage, and exposure
                     duration.
                           The common bean (Phaseolus vulgaris L.) is a notable crops belonging to the legume
                     family that is consumed either as fresh pods (also known as green beans, French beans,
                     string beans, or snap beans) or dry seeds. Common beans are considered one of the most
                     nutritious vegetable crops due to the high availability of protein and micronutrients [11].
                     Globally in 2020, the production of common beans was about 23 million tonnes har-
                     vested from about 16 million hectares (FAOSTAT 2020, https://www.fao.org/faostat/en/,
                     accessed on 1 September 2022). The top producers of green beans are China, Indonesia,
                     Turkey, India, Thailand, and Egypt.
                           One of the critical aspects of common bean cultivation is its salinity sensitivity [12].
                     It is well known that the growth and production of common bean plants are reduced
                     when salinity levels exceed 1 dS m−1 [12]. Several previous studies have reported the
                     adverse effect of salinity on the growth and production of common bean [13], as well as
                     other legumes, such as soybean, mungbean, and fava bean [14–16]. Under saline condi-
                     tions, Na+ and Clˉ are accumulated in plant cells, which causes toxicity for plants and
                     reduces the uptake of most elements, such as N, P, K, Ca, and Mg [17]. Some of the
                     strategies to reduce the harmful effects of salinity are the application of fertilizer with
                     organic matter, including compost and biochar [18], foliar application with nutrients
                     [19], the use of plant growth-promoting rhizobacteria [20], and breeding for resistance
                     cultivars [21]. However, some previous applications have had limited effects. Therefore,
                     more than one application may support mitigation of abiotic stresses crops sensitive to
                     salinity, such as common beans.
                           Potassium humate (Kh) is a salt derived from humic acid (HA) that is used to im-
                     prove plant growth and production via soil [22] and foliar applications [23]. The role of
                     HA in stimulating plant growth and increasing yield is attributed to its role in facilitat-
                     ing the transfer of elements from the soil into the plant by increasing the permeability of
                     the cell membrane [24]. Additionally, it has been reported that HA improves plant
                     growth and photosynthesis processes under abiotic stresses and increases antioxidant
                     enzyme activity [25]. Additionally, potassium (K) is classified as a macro element essen-
                     tial for most physiological processes inside plants [26]. K plays a positive role in allevi-
                     ating stresses such as salinity and drought [27]. Previous studies indicate the role of HA
                     in mitigating salinity stress in crops such as sorghum [28]. A limited number of studies
                     have been conducted on the effect of exogenous Kh application on beans, such as that by
                     Taha and Osman [29], who found that Kh improves bean growth under saline stress.
                           Salicylic acid (SA) is classified as a natural plant hormone and one of the phenolic
                     compounds that affect several physiological processes, such as photosynthesis, respira-
                     tion, growth, and production of plants [30]. Most reports indicate the positive role of fo-
                     liar application with SA in resistance to salinity in different crops, such as strawberries
                     [31], cabbage [32], and cowpea [33]. Previous studies reported the role of exogenous SA
                     application in mitigating biotic and abiotic stresses [34,35].
                           The combination of SA as a foliar application and Kh as a soil application to miti-
                     gate abiotic stresses is rarely reported in the literature. For example, Shalaby et al. [36]
                     found that foliar application of SA + Kh enhanced plant growth, leaf pigments, and the
                     activities of the antioxidant enzymes of marigold plants. Additionally, foliar application
                     of SA + Kh enhanced the growth, photosynthetic pigments, and K accumulation of
                     maize seedlings compared to control plants [37].
                           To the best of our knowledge, the combined application of SA + Kh to mitigate sa-
                     linity stress has not been evaluated to date in common bean plants. Our hypothesis in
Life 2023, 13, 448                                                                                       3 of 18

                     this study is that using SA + Kh could mitigate the salinity stress of common bean plants
                     better than the individual application of either SA or Kh. To evaluate our hypothesis, SA
                     as foliar application and Kh as soil application were applied to common bean plants,
                     and their effects on the plant growth, nutrient uptake, and changes in non-enzymatic
                     antioxidant and antioxidant enzymes were evaluated. The accumulation of reactive ox-
                     ygen species and hormone formations was also tested.

                     2. Materials and Methods
                     2.1. Plant Materials and Treatments
                           Pot experiments were performed in a modified growth chamber at a temperature of
                     24–28 °C of temperature, 65% relative humidity, and 3500 lx light intensity. Seeds of
                     common bean (cv. Bronco) were used in this experiment. The seeds were sterilized with
                     sodium hypochlorite (1%) for 2 min to avoid seed contamination before seed furrow.
                     The seeds were washed twice with distilled water, then dried. The experiment consisted
                     of 8 treatments (Figure 1) with 5 replicates as follows:
                     1.   Soil application of K-humate treated with 0 NaCl (Kh + 0 NaCl);
                     2.   Soil application of K-humate treated with 50 mM NaCl (Kh + 50 NaCl);
                     3.   Foliar application of salicylic acid treated with 0 NaCl (SA + 0 NaCl);
                     4.   Foliar application of salicylic acid treated with 50 mM NaCl (SA + 50 NaCl);
                     5.   Soil application of K-humate + foliar application of salicylic acid+ 0 NaCl (Kh + SA +
                          0 NaCl);
                     6.   Soil application of K-humate + foliar application of salicylic acid+ 50 mM NaCl (Kh
                          + SA + 50 NaCl);
                     7.   Foliar application of water treated with 50 mM NaCl (Cont. + 50 NaCl);
                     8.   Control (without K-humate, salicylic acid, or NaCl) (Cont.).
                         The concentration of Kh was 0.3 g/L, and that of SA was 0.2 g/L according to pre-
                     vious work [38]. Potassium humate contains 65% humic acid and 15% potassium.

                     Figure 1. Scheme of the experimental treatments.

                          The seeds were sown in plastic pots (15 × 15 cm) filled with acid-washed sand and
                     arranged in a complete randomized design with 5 replicates. After 7 days of complete
                     germination (14 days from seed planting), the desired salt concentration (200 mL) was
                     added daily. Foliar spraying with SA (about 10 mL) was performed using a handgun
                     sprayer on all shoots until the solution began to drip. The soil application of Kh was
                     performed by adding the desired concentration (200 mL) into the growth media.
                     Half-strength Hoagland’s nutrient solution was used to irrigate seedlings with saline
                     treatment every two days. The foliar application of SA and soil application of Kh were
                     performed 4 times 7, 14, 21, and 28 days after complete germination individually or to-
Life 2023, 13, 448 4 of 18
gether. After 33 days of complete germination, the plants were harvested to determine
the physiological and chemical parameters.
2.2. Plant Growth and Leaf Pigments
We used a digital balance to measure the fresh weight of the shoots and the roots.
Plants were dried in a forced-air drying oven to measure the dry weight of shoots and
roots (75 °C) until a consistent weight. For chlorophyll and carotenoid, the method de-
scribed by Lichtenthaler and Wellburn [39] was followed. In brief, 1 g of fresh samples
was extracted in 10 mL acetone (80%) for 1 h at 5 °C. Then, the samples were centrifuged
for 15 min at 3000× g. The absorption was measured by a spectrophotometer (model
UV-2401 PC, International Equipment Trading LTD. (IET), Milano, Italia) at three wave-
lengths (470, 647, and 663 nm) against the blank. Chlorophyll content and carotenoids
are represented in the results as mg.g−1 FW.
2.3. Proline Content
The method of Bates et al. [40] was used to determine proline content. Briefly, leaf
samples (0.1 g) were extracted in sulfosalicylic acid (3% 10 mL). Then, filter paper
(Whatman one) was used to filter the samples. Subsequently, ninhydrin and glacial ace-
tic acid (100% 2 mL) were mixed with 2 mL of the filtrated solution. The samples were
boiled for one hour in a water bath at 100 °C. The samples were kept in ice water for 15
min, 4 mL of toluene was added, and the mixture was added and stirred for 15 to 20 s in
a test tube. A spectrophotometer measured the absorbance at 520 nm. A standard curve
was used to calculate the proline content, and the results are represented as µg.g−1 FW.
2.4. Hydrogen Peroxide (H2O2) and Superoxide Anion (O2•−)
The content of H2O2 in fresh leaves was measured according to the method de-
scribed by Junglee et al. [41]. In brief, 0.1 g of fresh sample was homogenised with 1 mL
of extraction mixture (0.1% TCA, 1 M KI, and 10 mM potassium phosphate buffer) for 10
min in an ice bath. The results are expressed as mmol g−1 FW. To determine O2•−, the
method of Yang et al. [42] was followed. In brief, a fresh sample (0.2 g) of bean leaves
was mixed with 3 mL of phosphate buffer (50 mM; pH 7.8). Polyvinylpyrrolidone (PVP
1% w/v) was mixed with the reagent and centrifuged for 20 min under cooling (4 °C) at
10,000 rpm. Finally, the optical density was measured at 530 nm. The results are ex-
pressed as mmol g−1 FW.
2.5. Determination of Antioxidant Enzymes
Anitoxidant enzymes in leaf samples were determined using the method proposed
by Grace and Logan [43]. Proteins were extracted by homogenising 0.1 g of fresh sam-
ples in a buffer of potassium phosphate (pH 7.0), which contains 0.1 mM EDTA, 4%
PVP, and 2% glycerol. Then, the samples were centrifuged at 15,000× g under cooling (4
°C) for 40 min. The supernatant was used as a crude extract. The total soluble protein
was also determined in the supernatant to calculate the specific activity of different en-
zymes according to Bradford [44]. Enzyme activities of POX and CAT were measured in
the supernatants.
To measure the activity of peroxidase (POX) (EC: 1.11.1.7), the method of Lagrimini
[45] was used. In brief, 100 µL of crude extract was mixed with 2.9 mL of the reaction
solution containing 100 mM guaiacol, 0.1 mM EDTA, 50 mM phosphate buffer, and 30
mM H2O2. The tetra-guaiacol was measured at 465 nm, and the POX activity result is
presented as µmol mg−1 protein min−1. The activity of catalase (CAT) (EC: 1.11.1.6) was
measured according to Aebi [46]. The ability of the enzyme extract to decompose H2O2 at
room temperature was used to measure CAT activity by observing the drop in absorb-
ance at 240 nm. The reaction mixture consisted of potassium phosphate (100 Mm) buffer
(pH 7) and 25 mM H2O2. A volume of 100 µL of crude extract was added to 3 mL toLife 2023, 13, 448 5 of 18
begin the reaction. The results are expressed as µmol mg−1 protein min−1. The method of
Dhindsa et al. [47] was used to determine the superoxide dismutase (SOD) activity. This
method depends on the ability of one unit of SOD to inhibit 50% of nitro blue tetrazoli-
um photoreduction at 560 nm. The results are expressed in mg−1 protein min−1.
2.6. Determination of Sodium (Na+) and Potassium (K+) in Leaves
The amounts of sodium (Na+) and potassium (K+) in bean leaves were measured
using the flame photometric method (Jenway, Leicestershire, UK) as described previ-
ously [4]. In brief, the fresh samples were washed with distilled water and kept in a
forced-air oven until constant weight at 70 °C. The dried samples were ground to obtain
powder. Then, 0.2 g of sample was digested using a mixture of perchloric acids and
sulphuric acid. The results are presented as mg g−1 DW.
2.7. Determination of Ascorbic Acid (AA) and Glutathione (GSH)
The previously described by Mukherjee and Choudhuri [48] was followed to de-
termine the ascorbic acid (AA) content in the common bean leaves. Briefly, samples (0.1
g) were extracted in 6% (w/v) trichloroacetic acid. Then, 2 mL of dinitrophenyl hydrazine
(2%; w/v) was mixed with 4 mL of the extract, and 1 drop of thiourea in 70% (v/v) etha-
nol was added. The mixtures were then boiled for 15 min in a water bath. After cooling,
5 mL of H2SO4 (80%; v/v) was added, and samples were read at 530 nm. The results are
expressed as mg/100 g FW. The method of Griffth [49] was used to determine the con-
centration of GSH. The concentration of GSH was calculated from a standard curve, and
the results are expressed as nmol GSH g−1 FW.
2.8. Statistical Analysis
The results were statistically analysed using a one-way analysis of variance under a
complete randomized design. The means were compared by Duncan’s multiple range
test at p ≤ 0.05. SPSS (V.21) computer software was used for statistical analysis. The
heatmap figure was created using ClustVis online software. Principal component analy-
sis (PCA) was performed using Statistica 7 software (TIBCO Software, Palo Alto, CA,
USA).
3. Results
3.1. Effect of Kh and SA on Growth
As expected, salinity stress (50 mM NaCl) reduced the growth of common bean
plants (Figure 2A–D). Under non-saline and saline conditions, all treatments increased
the fresh weight of shoots compared to control plants (Figure 2A). The highest values of
shoots were recorded under the Kh + SA treatment. Furthermore, there was no signifi-
cant difference in the fresh weight of shoots between the Kh + SA treatment under saline
conditions and the control plants under non-saline conditions. Similarly, under
non-saline conditions, Kh and Kh + SA applications showed higher shoot dry weight
than the control plants (Figure 2B). Under the saline condition, both Kh and Kh + SA ap-
plications improved the shoots’ dry weight by 16.35 % and 23.59 %, respectively, com-
pared with the control plants.Life 2023, 13, 448 6 of 18
26 a 4.0
Shoots fresh weight (g)
Shoots Dry weight (g)
24 3.5
b b
22 ab a
3.0 bc
20 c cd c
18 d 2.5 d
de d
16 e 2.0 e
14 f 1.5
12
1.0
10
A Treatments B Treatments
7 0.5
a
Roots fresh weight (g)
Roots dry weight (g)
6 b 0.4
c bc
5 d b a
de 0.3 c bc
4 e d
f e de
0.2 e
3
2 0.1
1 0.0
C Treatments D Treatments
Figure 2. Effect of potassium humate (Kh), salicylic acid (SA), and their combination on (A) shoot
fresh weight, (B) shoot dry weight, (C) root fresh weight, and (D) root dry weight of common bean
plants irrigated with 0 and 50 mM NaCl. Different letters indicate significant differences according
to Duncan’s test (p < 0.05). Data are reported as means ± SE; n = 5.
As shown in Figure 2C, the root fresh weight was increased by Kh and Kh + SA
treatments compared with control plants under non-saline conditions. However, under
50 mM NaCl stress, all treatments significantly increased the root fresh weight by
28.10%, 19.73%, and 49.41%, respectively, compared with the control. Furthermore, the
Kh + SA treatment under saline conditions resulted in the highest values. As shown in
Figure 2D, Kh and Kh + SA applications increased the dry weight of roots compared to
the control treatment under non-saline conditions. Moreover, under saline conditions,
Kh + SA treatment resulted in the highest values of root dry weight.
3.2. Effect of Kh and SA on Leaf Pigments, O2•−, and H2O2
Salinity stress reduced the content of total chlorophyll and carotenoids in common
bean leaves under all treatments (Figure 3A,B). Moreover, the total chlorophyll content
was significantly increased by only Kh + SA treatment under non-saline conditions
compared to the control treatment. However, under saline stress, SA, Kh, and Kh + SA
applications improved total chlorophyll content by 19.28%, 30.79%, and 45.41%, respec-
tively, compared to the control. None of the treatments changed carotenoid content un-
der the non-saline condition (Figure 3B). However, all treatments improved carotenoid
content without significant differences compared to the control treatment.
As shown in Figure 3C,D, H2O2 and O2•− levels were increased by salinity stress
under all treatments. Under the non-saline condition, neither H2O2 nor O2•− levels were
significantly different between any of the treatments. The accumulation of H2O2 in the
leaves of common bean plants that were treated with Kh, SA, and Kh + SA was reduced
by 20.37, 27.45, and 27.16%, respectively, compared to control treatment under NaCl
stress. The same trend of results was recorded for O2•− content.Life 2023, 13, 448 7 of 18
2.5 0.5
Total chlorophyll (mg.g-1 fw)
Carotenoids (mg.g-1 fw)
a
bc b
bc bc
2.0 cd 0.4
d a a a
1.5 e 0.3 a
b b
b
1.0 0.2 c
0.5 0.1
0.0 0.0
A Treatments B Treatments
3.0 a 1.0 a
H2O2 (mmol g-1 fw)
b ab
c c 0.8 bc
O2•¯ (mmol g−1 fw)
2.0 c
d d d 0.6
d d d
d d
0.4
1.0
0.2
0.0 0.0
C Treatments D Treatments
Figure 3. Effect of potassium humate (Kh), salicylic acid (SA), and their combination on (A) total
chlorophyll, (B) carotenoids, (C) H2O2, and O2•− (D) of common bean plants irrigated with 0 and 50
mM NaCl. Different letters indicate significant differences according to Duncan’s test (p < 0.05).
Data are presented as means ± SE; n = 5.
3.3. Effect of Kh and SA on the Activity of Antiaxidant Enzymes and Proline
As shown in Figure 4A–C, the activity of POX, CAT, and SOD enzymes in leaves
was increased under saline stress compared to non-saline conditions for all treatments.
Moreover, under non-saline conditions, there was no significant difference in the activity
of any enzymes between treatments. However, under saline conditions, the POX activity
in plants that were treated with Kh + SA was increased compared to the control. Simi-
larly, SA, Kh, and Kh + SA treatments significantly increased the activities of CAT and
SOD enzymes compared to the control under saline conditions.
The proline concentration was increased under 50 mM NaCl stress compared with
the non-saline condition in all treatments (Figure 3D). Under the non-saline condition,
there was no significant difference in proline content between any of the treatments.
However, all applications resulted in higher proline content values than the control
treatment under saline conditions.
1.0 a 1.0 a
a
ab ab
CAT (µmol mg-1 protein
POX (µmol mg-1 protein min-1)
0.8 b 0.8 b b
c c c c
0.6 c c c c 0.6
min-1)
0.4 0.4
0.2 0.2
0.0 0.0
A Treatments B TreatmentsLife 2023, 13, 448 8 of 18
a a
2.0 b 35.0 ab
SOD (µmol mg-1 protein min-1)
b b
Proline (µg.g-1 dw)
c 30.0
1.5 c
d d d d d
d 25.0 d d
1.0
20.0
0.5
15.0
0.0 10.0
C Treatments D Treatments
Figure 4. Effect of potassium humate (Kh), salicylic acid (SA), and their combination on (A) POX,
(B) CAT, (C) SOD, and (D) proline content of common bean plants irrigated with 0 and 50 mM
NaCl. Different letters indicate significant differences according to Duncan’s test (p < 0.05). Data are
presented as means ± SE; n = 5.
3.4. Effect of Kh and SA on the GSH, AA, Na, and K
The results presented in Figure 5A,B show that both GSH and AA in common bean
seedlings were decreased by salinity treatment compared to the control treatment
(non-saline condition). However, the SA + Kh application significantly increased GSH
content under saline conditions compared to untreated seedlings. Furthermore, both SA
and SA + Kh applications increased AA content in bean seedlings compared to the con-
trol under saline stress.
The content of Na in the leaves of the bean seedlings irrigated with 50 mM NaCl
was higher than in plants irrigated with regular water (Figure 5C). There was no signif-
icant difference in Na content between any of the treatments under non-saline condi-
tions. Additionally, all treatments significantly reduced Na content compared with the
control under saline stress. Under non-saline conditions, SA + Kh application resulted in
higher K content than the control, whereas SA treatment decreased the K content (Figure
5D). However, SA, Kh, and Kh + SA applications increased the K content compared to
the control under saline conditions.
250.0 2.0
a a
a a a a a
b abc 1.5
GSH (nmol g−1 dw)
AA (mg 100g−1 dw)
200.0 cd bcd b b
d 1.0 c
c
150.0
0.5
100.0 0.0
A Treatments B TreatmentsLife 2023, 13, 448 9 of 18
a
15.0 10.0 ab
a b c
12.0 b 8.0 d cd
Na+ (mg g−1 dw)
K+ (mg g−1 dw)
c c
d e
9.0 d d d 6.0 f
6.0 4.0
3.0 2.0
0.0 0.0
C Treatments D Treatments
Figure 5. Effect of potassium humate (Kh), salicylic acid (SA), and their combination on (A) GSH,
(B) AA, (C) Na, and (D) K content of common bean plants irrigated with 0 and 50 mM NaCl. Dif-
ferent letters indicate significant differences according to Duncan’s test (p < 0.05). Data are pre-
sented as means ± SE; n = 5.
3.5. Principal Component Analysis and Heatmap Clustering
A PCA biplot including PC1 and PC2 is presented in Figure 6A. The biplot visual-
izes how samples relate to each other, i.e., which samples are similar and which are dif-
ferent, as well as how each variable contributes to each principal component. PCA anal-
ysis accounted for 82% of the variance. PC1 and PC2 accounted for 69.27 and 12.95% of
the total variability, respectively. Antioxidant enzymes and proline contributed signifi-
cantly to PC2, and all vegetative growth and non-enzymatic antioxidants (GSH, AA, and
carotenoids) showed inclinations toward PC1, including K and total chlorophyll.
The heatmap shows that all growth and biochemical parameters under different
treatments can be divided into four clusters (Figure 6B a, b, c, and d). Group a includes
all vegetative growth parameters, total chlorophyll, and K. GSH, AA, and carotenoids
are in group b, whereas H2O2, O2•−, and Na are in group c. Proline, CAT, POX, and SOD
enzymes are categorized in group d. As shown in Figure 6B, group a indicates that veg-
etative parameters were reduced (dark blue) by salinity stress but enhanced by SA and
Kh applications (light blue to red). GSH, AA, and carotenoid values (Figure 6B, group b)
were reduced by salinity stress (blue) compared to non-saline conditions (red) and in-
creased by SA and Kh applications under saline conditions. In contrast, H2O2, O2•−, and
Na were increased by salinity stress (Figure 6B, group c). The double treatments (SA +
Kh) showed the best results in reducing H2O2, O2•−, and Na contents under saline condi-
tions (light blue values). Finally, the activity of antioxidant enzymes and proline in-
creased under salinity stress compared to the non-saline condition (Figure 6B, group d).Life 2023, 13, 448 10 of 18
Figure 6. (A) Loading plot of all recorded parameters included in the PCA. (B) Heatmap analysis
for treatments (columns) and tested parameters (rows). The numbers indicate the degree of colour.
Blue refers to lower numerical values, and red refers to higher numerical values. The colour scale is
located in the top-right corner of the chart.
4. Discussion
4.1. Effect of Kh and SA on Growth
Salt stress reduces plant growth by affecting physiological processes such as pho-
tosynthesis, hormones, and enzyme activities [9]. Our study shows that salinity stress
decreased the growth of common bean seedlings (Figure 2A–D). This reduction in
growth might be due to several factors, such as ionic toxicity, osmotic pressure, limita-
tion of elements absorption, a reduction in photosynthesis processes, and accumulation
of Na in plant tissue [4,50]. In this study, SA, Kh, and Kh + SA applications increased
plant growth parameters under normal and saline conditions. Recently, SA has been
used in plant cultivation to mitigate the harmful effects of several abiotic stresses, suchLife 2023, 13, 448 11 of 18
as salinity. This is due to the role of SA in enhancing the photosynthesis processes and
mitigating cell membrane damage caused by salinity stress [51].
The application of SA might enhance the growth of seedlings by weakening the cell
membrane. Furthermore, SA enhanced plant growth by maintaining the expected levels
of indole acetic and gibberellic acid levels responsible for plant growth [52]. Additional-
ly, previous studies indicated that SA application mitigates salinity and improves
growth (plant fresh and dry weight) of some crops, such as kidney beans and cabbage
[31,34].
In line with our results, previous works reported the positive role of Kh in enhanc-
ing plant growth of beans under normal and salinity stress [29,53,54]. The positive role
of Kh in enhancing plant growth might be due to its role in increasing the organic matter
of growth media, water availability, conserved mineral nutrients from leaching, and
mineral absorption by plant roots [53–55]. Additionally, Kh was more effective than SA
in improving plant growth (Figure 2). This could be due to the role of potassium in con-
trolling many enzymes in plants [56], as well as the role of humate as a biostimulants
[36]. Taken together, our results suggest that SA + Kh application was the most effective
treatment. This result is in agreement with that reported by Shalaby et al. [36], who
found that the combined application of SA + Kh significantly enhanced the plant growth
of marigold plants. Moreover, heatmap analysis (Figure 6B, group a) showed that SA
and Kh treatments increased vegetative growth parameters under saline conditions.
4.2. Effect of Kh and SA on Leaf Pigments, O2•−, and H2O2
The decline in photosynthetic pigments is one of the most damaging effects of salt
stress. Our results show that salinity stress reduced total chlorophyll and carotenoids
(Figure 3A,B). Alzahrani et al. [57] confirmed our findings, reporting that saline condi-
tions prevented the synthesis of chlorophyll and carotenoid in stressed plants. Salinity
stress might also reduce chlorophyll fluorescence and cause a severe imbalance in sto-
matal function [58]. Additionally, salinity retards the absorption of magnesium, which is
required for chlorophyll synthesis [59].
The results in this study (Figure 3A) and those of previous studies indicate that SA
application enhances the chlorophyll content of kidney bean plants [31], tomatoes [60],
cucumbers [61], and mungbean [62]. These results could be due to the role of SA in in-
creasing the relative vitality of photosynthesis and decreasing initial fluorescence [63].
Furthermore, the role of Kh in enhancing chlorophyll and carotenoid contents under sa-
line conditions was previously reported [29,64]. These findings could be due to the role
of SA and Kh in enhancing photosynthesis biosynthesis (by protecting chloroplast pig-
ments from salt toxicity through oxidative protection of chloroplasts) and improving the
performance of enzymes during the chlorophyll process [51]. Bijanzadeh et al. [37] found
that a combination treatment of SA and Kh improved chlorophyll and carotenoid con-
tent in corn plants, which supports our hypothesis that the combination of the two
compounds is more effective than the individual compounds. Furthermore, heatmap
analysis (Figure 6B) showed that SA and Kh treatments under saline conditions in-
creased leaf pigments.
Environmental stresses, especially salinity and drought, encourage the production
of reactive oxygen species (ROS), including O2•−and H2O2, which promote the tolerance
of plants to these stresses [62]. Figure 3C,D show a clear trend of increasing ROS under
salinity stress compared with the non-saline condition. A similar result was recorded by
Nawaz et al. [62], who found that salinity increased ROS levels in mungbean shoots.
However, in this study, the application of SA and Kh retarded the production of H2O2
under saline conditions. This result is in agreement with that reported by Nawaz et al.
[62], who showed that SA application decreased the H2O2 content in mungbean shoots
under saline conditions. SA may have played a vital role in ROS scavenging and re-
duced H2O2 content, which maintains plant growth under adverse conditions [65].
Moreover, Kh effectively reduced ROS generated by oxidative stresses in maize [66] andLife 2023, 13, 448 12 of 18
strawberries [38]. Additionally, PCA (Figure 6A) and heatmap analysis (Figure 6A,
group c) showed that O2•−, H2O2, and Na are closely clustered in the same group.
4.3. Effect of Kh and SA on the Activity of Antioxidant Enzymes and Proline
Under abiotic stresses, several mechanisms of plants mitigate these stresses. One of
these mechanisms is enhancement of the activity of antioxidant enzymes such as CAT,
SOD, and POX, which play a vital role in scavenging ROS [67]. These findings are con-
sistent with our results presented in Figure 4A–C, indicating an increase in the activity
of antioxidant enzymes under saline conditions. Similar results were recorded in straw-
berry plants [33].
The results of this study indicate that the application of SA increased the activity of
antioxidant enzymes under saline stress. Treatment with SA might stimulate the activity
of antioxidant enzymes, reducing the harmful effects of ROS under saline stress [68].
Previous studies indicated that SA application increases the activity of antioxidant en-
zymes under biotic stress conditions [36,69–71]. We also recorded an increase in the ac-
tivities of CAT, SOD, and POX as a result of Kh treatment (Figure 4A–C). These results
match those observed in an earlier study by Hemida et al. [53], who found that Kh ap-
plication increased the activities of CAT, SOD, and POX enzymes in common bean
plants under salinity conditions. The increased activity of antioxidant enzymes with the
increasing AA and GSH (Figure 5A,B) by SA + Kh application could encourage the nor-
mal growth of plants under environmental stresses. Potassium also plays a vital role in
plant growth and regulates many physiological processes by controlling their enzymes
[72], which could explain the effective role of Kh in enhancing antioxidant enzyme activ-
ity [36].
It is well known that proline accumulates in plant tissue under unfavourable envi-
ronmental conditions, especially salinity and drought [73]. Proline protects proteins,
membranes, and cellular structures from damage by scavenging reactive oxygen species
(ROS) in tissue [74–76]. Many previous works recorded an increase in proline content in
some crops, such as tomatoes [4], broad bean [9], and green beans [29], under saline
conditions. Similarly, our results presented in Figures 3C and 5 show that salinity in-
creased proline content in common bean leaves. The increase in proline content by SA
application in mungbean was previously recorded [62]. As a growth regulator, SA could
help regulate osmotic pressure, protect cell membranes from damage, and scavenge ROS
under stress conditions [62]. Additionally, previous work indicated that Kh application
increased proline content in pea leaves under saline stress [55]. In this study, Kh im-
proved the activity of antioxidant enzymes and proline content, which could mitigate
salinity [25]. Moreover, PCA (Figure 6A) and heatmap analysis (Figure 6B, group d)
showed that the activity of antioxidant enzymes and proline are in the same group that
increased by SA and Kh treatments under saline conditions compared to the control
plants.
4.4. Effect of Kh and SA on the GSH, AA, Na+, and K+
In this study, GSH and AA were decreased by salinity but increased by Kh and SA
application (Figure 5A,B). It has been reported that AA and GSH protect cell membranes
from oxidative damage by reacting with O2•−and H2O2 [77,78]. The application of Kh
mitigates the adverse effects of salinity by improving the absorption of elements, en-
hancing plant growth [55], and motivating the plant defence system against stresses [53].
Previous studies indicated that Kh application increased antioxidant activity in pepper
plants under saline conditions [79]. The role of SA treatment in salinity resistance was
reported in some previous studies [33–35]. Increasing GSH and AA contents in plants by
SA application could enhance a mechanism to protect plants from the accumulation of
ROS under stress conditions [80].
Salinity affects the absorption and accumulation of elements in plant tissue [10]. It is
well known that uptakes of nutrients (N, P, K+, Ca, and Mg, as well as microelements) inLife 2023, 13, 448 13 of 18
the rhizosphere area is negatively affected by high levels of Na and Cl [4]. In this study,
salinity increased the level of Na+ and decreased the K+ content in common bean leaves
(Figure 4C,D). Saidimoradi et al. [38] obtained a similar pattern of results, finding that
salinity stress reduced the uptake of K+ by strawberry plants. Maintaining adequate K+
levels in plants could mitigate adverse salinity conditions [11,81,82]. Under the saline
condition, our results show that Na+ content in leaves was decreased, whereas Kh and
SA treatments and their combination increased K+ content (Figure 4C,D). This result is in
line with previous studies by Gunes et al. [83] and Roshdy et al. [33], who found that SA
application reduced Na+ levels and increased K levels in maize and strawberry plants,
respectively, under saline conditions. Additionally, soil Kh application improved the
absorption of K+ and decreased the uptake of Na+ in shoots of strawberry plants Sai-
dimoradi et al. [38]. Kh also contains K+, which is known to be responsible for salinity re-
sistance, owing to its competition with sodium in terms of binding and maintaining
plant water status [84]. The adsorption of Na by humic compounds as a result of Kh ap-
plication helps to reduce the content of Na in common bean shoots and allows more K+
to be absorbed by the roots [85].
4.5. Effect of Combined Application (Kh + SA)
The results of this study show that there are no significant differences between SA +
Kh and Kh applications in shoot fresh weight, shoot dry weight, root dry weight, total
chlorophyll, total carotenoids, H2O2, O2•−, POX, GSH, Na+, or K+ under saline conditions.
This might be due to the role of K+ and humate in both treatments in improving plant
growth. However, with respect to some other parameters (fresh weight, CAT, proline,
AA, and SOD) SA + Kh treatment was more effective than the individual applications.
Thus, our results suggest that soil application of Kh plus SA foliar application can miti-
gate salinity stress of bean seedlings. More studies are required to prove the effective-
ness of the combined application of SA and Kh in enhancing salinity tolerance in bean
plants.
5. Conclusions
Oxidative damage resulting from salinity stress was observed, as evidenced by a
reduction in shoot and root growth and pigments such as chlorophyll and carotenoids
(Figure 7). However, the application of SA, Kh, and SA + Kh enhanced the resistance of
common bean to salinity stress by reducing Na, O2•−, and H2O2 contents in shoots and
increasing content, the activity of the antioxidant enzymes, AA, GSH, and proline con-
tent. The most effective treatment was the combined treatment. Thus, combining SA +
Kh can effectively mitigate salinity stress in common bean plants.Life 2023, 13, 448 14 of 18
Figure 7. Simplified chart illustrating the effect of Kh and SA applications on the growth and
chemical changes of common bean seedlings grown under salinity stress.
Author Contributions: Conceptualization, H.S.E.-B., H.H.A.-O., A.P., K.M.A.R., A.K.d.S.L. and
M.M.E.-M.; methodology, H.S.E.-B., H.H.A.-O., A.P., K.M.A.R. and M.M.E.-M.; software, H.S.E.-B.,
H.H.A.-O., A.P. and M.M.E.-M.; validation, H.S.E.-B., H.H.A.-O., K.M.A.R., A.K.d.S.L. and
M.M.E.-M.; formal analysis, H.S.E.-B., H.H.A.-O., A.P., K.M.A.R., A.K.d.S.L. and M.M.E.-M.; in-
vestigation, H.S.E.-B., H.H.A.-O., A.K.d.S.L., and M.M.E.-M.; resources, H.S.E.-B., H.H.A.-O. and
M.M.E.-M.; data curation, A.P, H.S.E.-B., H.H.A.-O. and M.M.E.-M.; writing—original draft prep-
aration, H.S.E.-B. and M.M.E.-M.; writing—review and editing, H.S.E.-B., A.P., A.K.d.S.L.,
K.M.A.R. and M.M.E.-M.; visualization, H.S.E.-B., H.H.A.-O., K.M.A.R. and M.M.E.-M.; supervi-
sion, H.S.E.-B., H.H.A.-O. and M.M.E.-M.; project administration, H.S.E.-B. and M.M.E.-M.; fund-
ing acquisition, H.S.E.-B., H.H.A.-O. and K.M.A.R. All authors have read and agreed to the pub-
lished version of the manuscript.
Funding: This work was supported by the Deanship of Scientific Research, Vice Presidency for
Graduate Studies and Scientific Research, King Faisal University, Saudi Arabia (grant 2,401).
Institutional Review Board Statement: Not applicable.
Informed Consent Statement: Not applicable.
Data Availability Statement: All data are available within the manuscript.
Acknowledgments: The authors are thankful to the Deanship of Scientific Research, Vice Presi-
dency for Graduate Studies and Scientific Research, King Faisal University, Saudi Arabia, for
supporting this research work.
Conflicts of Interest: The authors declare no conflict of interest.
References
1. Yamaguchi, T.; Blumwald, E. Developing salt-tolerant crop plants: Challenges and opportunities. Trends Plant Sci. 2005, 10, 615–
620. https://doi.org/10.1016/j.tplants.2005.10.002.
2. Shrivastava, P.; Kumar, R. Soil salinity: A serious environmental issue and plant growth promoting bacteria as one of the tools
for its alleviation. Saudi J. Biol. Sci. 2015, 22, 123–131. https://doi.org/10.1016/j.sjbs.2014.12.001.
3. Jamil, A.; Riaz, S.; Ashraf, M.; Foolad, M.R. Gene expression profiling of plants under salt stress. Crit. Rev. Plant Sci. 2011, 30,
435–458. https://doi.org/10.1080/07352689.2011.605739.
4. Abdeldym, E.A.; El-Mogy, M.M.; Abdellateaf, H.R.L.; Atia, M.A.M. Genetic characterization, agro-morphological and
physiological evaluation of grafted tomato under salinity stress conditions. Agronomy 2020, 10, 1948.
https://doi.org/10.3390/agronomy10121948.Life 2023, 13, 448 15 of 18
5. Murillo-Amador, B.; Yamada, S.; Yamaguchi, T.; Rueda-Puente, E.; Ávila-Serrano, N.; García-Hernández, J.L.; López-Aguilar,
R.; Troyo-Diéguez, E.; Nieto-Garibay, A. Influence of calcium silicate on growth, physiological parameters and mineral
nutrition in two legume species under salt stress. J. Agron. Crop Sci. 2007, 193, 413–421.
https://doi.org/10.1111/j.1439-037X.2007.00273.x.
6. F. Abdelgawad, K.; M. El-Mogy, M.; I. A. Mohamed, M.; Garchery, C.; G. Stevens, R. Increasing Ascorbic acid content and
salinity tolerance of cherry tomato plants by suppressed expression of the ascorbate oxidase gene. Agronomy 2019, 9, 51.
https://doi.org/10.3390/agronomy9020051.
7. El-Mogy, M.M.; Garchery, C.; Stevens, R. Irrigation with salt water affects growth, yield, fruit quality, storability and
marker-gene expression in cherry tomato. Acta Agric. Scand. Sect. B Soil Plant Sci. 2018, 68, 727–737.
https://doi.org/10.1080/09064710.2018.1473482.
8. Ahmad, F.; Kamal, A.; Singh, A.; Ashfaque, F.; Alamri, S.; Siddiqui, M.H. Salicylic Acid modulates anti-oxidant system, defense
metabolites, and expression of salt transporter genes in Pisum sativum under salinity stress. J. Plant Growth Regul. 2022, 41, 1905–
1918. https://doi.org/10.1007/s00344-020-10271-5.
9. Nasrallah, A.K.; Kheder, A.A.; Kord, M.A.; Fouad, A.S.; El-Mogy, M.M.; Atia, M.A.M. Mitigation of salinity stress effects on
Broad bean productivity using calcium phosphate nanoparticles application. Horticulturae 2022, 8, 75.
https://doi.org/10.3390/horticulturae8010075.
10. Munns, R.; Tester, M. Mechanisms of salinity tolerance. Annu. Rev. Plant Biol. 2008, 59, 651–681.
https://doi.org/10.1146/annurev.arplant.59.032607.092911.
11. Nadeem, M.; Li, J.; Yahya, M.; Wang, M.; Ali, A.; Cheng, A.; Wang, X.; Ma, C. Grain legumes and fear of salt stress: Focus on
mechanisms and management strategies. Int. J. Mol. Sci. 2019, 20, 799. https://doi.org/10.3390/ijms20040799.
12. Garcia, C.L.; Dattamudi, S.; Chanda, S.; Jayachandran, K. Effect of salinity stress and microbial inoculations on glomalin
production and plant growth parameters of Snap bean (Phaseolus vulgaris). Agronomy 2019, 9, 545.
https://doi.org/10.3390/agronomy9090545.
13. Osman, H.S.; Salim, B.B.M. Influence of exogenous application of some phytoprotectants on growth, yield and pod quality of
snap bean under NaCl salinity. Ann. Agric. Sci. 2016, 61, 1–13. https://doi.org/10.1016/j.aoas.2016.05.001.
14. Shu, K.; Qi, Y.; Chen, F.; Meng, Y.; Luo, X.; Shuai, H.; Zhou, W.; Ding, J.; Du, J.; Liu, J.; et al. Salt Stress represses soybean seed
germination by negatively regulating ga biosynthesis while positively mediating ABA biosynthesis. Front. Plant Sci. 2017, 8.
https://doi.org/10.3389/fpls.2017.01372.
15. Yasar, F.; Ellialtioglu, S.; Yildiz, K. Effect of salt stress on anti-oxidant defense systems, lipid peroxidation, and chlorophyll
content in green bean. Russ. J. Plant Physiol. 2008, 55, 782–786. https://doi.org/10.1134/S1021443708060071.
16. Nahar, K.; Hasanuzzaman, M.; Rahman, A.; Alam, M.M.; Mahmud, J.-A.; Suzuki, T.; Fujita, M. Polyamines confer salt tolerance
in Mung bean (Vigna radiata L.) by reducing sodium uptake, improving nutrient homeostasis, anti-oxidant defense, and
methylglyoxal detoxification systems. Front. Plant Sci. 2016, 7, 1104. https://doi.org/10.3389/fpls.2016.01104.
17. Hu, Y.; Schmidhalter, U. Drought and salinity: A comparison of their effects on mineral nutrition of plants. J. Plant Nutr. Soil Sci.
2005, 168, 541–549. https://doi.org/10.1002/jpln.200420516.
18. Sun, H.; Lu, H.; Chu, L.; Shao, H.; Shi, W. Biochar applied with appropriate rates can reduce N leaching, keep N retention and
not increase NH(3) volatilization in a coastal saline soil. Sci. Total Environ. 2017, 575, 820–825.
https://doi.org/10.1016/j.scitotenv.2016.09.137.
19. Zuccarini, P. Effects of silicon on photosynthesis, water relations and nutrient uptake of Phaseolus vulgaris under NaCl stress.
Biol. Plant. 2008, 52, 157–160. https://doi.org/10.1007/s10535-008-0034-3.
20. Kumawat, K.C.; Nagpal, S.; Sharma, P. Potential of plant growth-promoting rhizobacteria-plant interactions in mitigating salt
stress for sustainable agriculture: A review. Pedosphere 2022, 32, 223–245. https://doi.org/10.1016/S1002-0160(21)60070-X.
21. Smýkal, P.; Coyne, C.J.; Ambrose, M.J.; Maxted, N.; Schaefer, H.; Blair, M.W.; Berger, J.; Greene, S.L.; Nelson, M.N.; Besharat, N.;
et al. Legume crops phylogeny and genetic diversity for science and breeding. Crit. Rev. Plant Sci. 2015, 34, 43–104.
https://doi.org/10.1080/07352689.2014.897904.
22. dos Santos, B.D.M.S.; Chávez, D.W.H.; de Oliveira, R.; Santos, C.H.B.; Oliveira, E.C.; Rigobelo, E.C. K-humate as an agricultural
alternative to increase nodulation of soybeans inoculated with Bradyrhizobium. Biocatal. Agric. Biotechnol. 2021, 36, 102129.
https://doi.org/10.1016/j.bcab.2021.102129.
23. Abdelrasheed, K.G.; Mazrou, Y.; Omara, A.E.; Osman, H.S.; Nehela, Y.; Hafez, E.M.; Rady, A.M.S.; El-Moneim, D.A.;
Alowaiesh, B.F.; Gowayed, S.M. Soil amendment using biochar and application of k-humate enhance the growth, productivity,
and nutritional value of Onion (Allium cepa L.) under Deficit Irrigation Conditions. Plants 2021, 10, 2598.
https://doi.org/10.3390/plants10122598.
24. Noroozisharaf, A.; Kaviani, M. Effect of soil application of humic acid on nutrients uptake, essential oil and chemical
compositions of garden thyme (Thymus vulgaris L.) under greenhouse conditions. Physiol. Mol. Biol. Plants Int. J. Funct. Plant Biol.
2018, 24, 423–431. https://doi.org/10.1007/s12298-018-0510-y.
25. Kaya, C.; Akram, N.A.; Ashraf, M.; Sonmez, O. Exogenous Application of humic acid mitigates salinity stress in Maize (Zea mays
L.) plants by improving some key physico-biochemical attributes. Cereal Res. Commun. 2018, 46, 67–78.
https://doi.org/10.1556/0806.45.2017.064.Life 2023, 13, 448 16 of 18
26. Mridha, D.; Paul, I.; De, A.; Ray, I.; Das, A.; Joardar, M.; Chowdhury, N.R.; Bhadoria, P.B.S.; Roychowdhury, T. Rice seed (IR64)
priming with potassium humate for improvement of seed germination, seedling growth and anti-oxidant defense system under
arsenic stress. Ecotoxicol. Environ. Saf. 2021, 219, 112313. https://doi.org/10.1016/j.ecoenv.2021.112313.
27. Kumari, S.; Chhillar, H.; Chopra, P.; Khanna, R.R.; Khan, M.I.R. Potassium: A track to develop salinity tolerant plants. Plant
Physiol. Biochem. 2021, 167, 1011–1023. https://doi.org/10.1016/j.plaphy.2021.09.031.
28. Ali, A.Y.A.; Ibrahim, M.E.H.; Zhou, G.; Nimir, N.E.A.; Jiao, X.; Zhu, G.; Elsiddig, A.M.I.; Zhi, W.; Chen, X.; Lu, H. Ameliorative
effects of jasmonic acid and humic acid on anti-oxidant enzymes and salt tolerance of Forage Sorghum under salinity
conditions. Agron. J. 2019, 111, 3099–3108. https://doi.org/10.2134/agronj2019.05.0347.
29. Taha, S.S.; Osman, A.S. Influence of potassium humate on biochemical and agronomic attributes of bean plants grown on saline
soil. J. Hortic. Sci. Biotechnol. 2018, 93, 545–554. https://doi.org/10.1080/14620316.2017.1416960.
30. Koo, Y.M.; Heo, A.Y.; Choi, H.W. Salicylic acid as a safe plant protector and growth regulator. Plant Pathol. J. 2020, 36, 1–10.
https://doi.org/10.5423/ppj.Rw.12.2019.0295.
31. Roshdy, A.E.; Alebidi, A.; Almutairi, K.; Al-Obeed, R.; Elsabagh, A. The effect of salicylic acid on the performances of salt
stressed strawberry plants, enzymes activity, and salt tolerance index. Agronomy 2021, 11, 775.
https://doi.org/10.3390/agronomy11040775.
32. Linić, I.; Mlinarić, S.; Brkljačić, L.; Pavlović, I.; Smolko, A.; Salopek-Sondi, B. Ferulic acid and salicylic acid foliar treatments
reduce short-term salt stress in Chinese Cabbage by increasing phenolic compounds accumulation and photosynthetic
performance. Plants 2021, 10, 2346. https://doi.org/10.3390/plants10112346.
33. El-Taher, A.M.; Abd El-Raouf, H.S.; Osman, N.A.; Azoz, S.N.; Omar, M.A.; Elkelish, A.; Abd El-Hady, M.A.M. Effect of salt
stress and foliar application of salicylic acid on morphological, biochemical, anatomical, and productivity characteristics of
Cowpea (Vigna unguiculata L.) Plants. Plants 2021, 11, 115. https://doi.org/10.3390/plants11010115.
34. Tania, S.S.; Rhaman, M.S.; Rauf, F.; Rahaman, M.M.; Kabir, M.H.; Hoque, M.A.; Murata, Y. Alleviation of Salt-Inhibited
germination and seedling growth of kidney bean by seed priming and exogenous application of salicylic acid (SA) and
hydrogen peroxide (H2O2). Seeds 2022, 1, 87–98. https://doi.org/10.3390/seeds1020008.
35. Osei, R.; Yang, C.; Wei, L.; Jin, M.; Boamah, S. Effects of combined application of salicylic acid and proline on the defense
response of potato tubers to newly emerging soft rot bacteria (Lelliottia amnigena) Infection. Sustainability 2022, 14, 8870.
https://doi.org/10.3390/su14148870.
36. Shalaby, T.A.; El-Newiry, N.A.; El-Tarawy, M.; El-Mahrouk, M.E.; Shala, A.Y.; El-Beltagi, H.S.; Rezk, A.A.; Ramadan, K.M.A.;
Shehata, W.F.; El-Ramady, H. Biochemical and physiological response of marigold (Tagetes Erecta L.) to foliar application of
salicylic acid and potassium humate in different soil growth media. Gesunde Pflanz. 2022, 1–14.
https://doi.org/10.1007/s10343-022-00693-4.
37. Bijanzadeh, E.; Naderi, R.; Egan, T.P. Exogenous application of humic acid and salicylic acid to alleviate seedling drought stress
in two corn (Zea mays L.) hybrids. J. Plant Nutr. 2019, 42, 1483–1495. https://doi.org/10.1080/01904167.2019.1617312.
38. Saidimoradi, D.; Ghaderi, N.; Javadi, T. Salinity stress mitigation by humic acid application in strawberry (Fragaria x ananassa
Duch.). Sci. Hortic. 2019, 256, 108594. https://doi.org/10.1016/j.scienta.2019.108594.
39. Lichtenthaler, H.K.; Wellburn, A.R. Determinations of total carotenoids and chlorophylls a and b of leaf extracts in different
solvents. Biochem. Soc. Trans. 1983, 11, 591–592. https://doi.org/10.1042/bst0110591.
40. Bates, L.S.; Waldren, R.P.; Teare, I.D. Rapid determination of free proline for water-stress studies. Plant Soil 1973, 39, 205–207.
https://doi.org/10.1007/BF00018060.
41. Junglee, S.; Urban, L.; Sallanon, H.; Lopez-Lauri, F. Optimized assay for hydrogen peroxide determination in plant 580 tissue
using potassium iodide. Am. J. Anal. Chem 2014, 5, 730.
42. Yang, H.; Wu, F.; Cheng, J. Reduced chilling injury in cucumber by nitric oxide and the anti-oxidant response. Food Chem. 2011,
127, 1237–1242. https://doi.org/10.1016/j.foodchem.2011.02.011.
43. Grace, S.C.; Logan, B.A. Acclimation of Foliar Anti-oxidant systems to growth irradiance in three broad-leaved evergreen
species. Plant Physiol. 1996, 112, 1631–1640. https://doi.org/10.1104/pp.112.4.1631.
44. Bradford, M.M. A rapid and sensitive method for the quantitation of microgram quantities of protein utilizing the principle of
protein-dye binding. Anal. Biochem. 1976, 72, 248–254. https://doi.org/10.1016/0003-2697(76)90527-3.
45. Lagrimini, L. Plant peroxidases: Under-and over-expression in transgenic plants and physiological consequences. Plant
Peroxidases 1980, 1990, 59–69.
46. Aebi, H. Catalase in vitro. In Methods in Enzymology; Academic Press: Cambridge, MA, USA, 1984; Volume 105, pp. 121–126.
47. Dhindsa, R.S.; Plumb-Dhindsa, P.; Thorpe, T.A. Leaf Senescence: Correlated with increased levels of membrane permeability
and lipid peroxidation, and decreased levels of superoxide dismutase and catalase. J. Exp. Bot. 1981, 32, 93–101.
https://doi.org/10.1093/jxb/32.1.93.
48. Mukherjee, S.P.; Choudhuri, M.A. Implications of water stress-induced changes in the levels of endogenous ascorbic acid and
hydrogen peroxide in Vigna seedlings. Physiol. Plant. 1983, 58, 166–170. https://doi.org/10.1111/j.1399-3054.1983.tb04162.x.
49. Griffith, O.W. Determination of glutathione and glutathione disulfide using glutathione reductase and 2-vinylpyridine. Anal.
Biochem. 1980, 106, 207–212. https://doi.org/10.1016/0003-2697(80)90139-6.
50. Abbas, G.; Rehman, S.; Siddiqui, M.H.; Ali, H.M.; Farooq, M.A.; Chen, Y. Potassium and Humic Acid synergistically increase
salt tolerance and nutrient uptake in contrasting wheat genotypes through ionic homeostasis and activation of anti-oxidant
enzymes. Plants 2022, 11, 263. https://doi.org/10.3390/plants11030263.Life 2023, 13, 448 17 of 18
51. Ma, X.; Zheng, J.; Zhang, X.; Hu, Q.; Qian, R. Salicylic acid alleviates the adverse effects of salt stress on Dianthus superbus
(Caryophyllaceae) by activating photosynthesis, protecting morphological structure, and enhancing the anti-oxidant system.
Front. Plant Sci. 2017, 8, 600.
52. El-Mergawi, R.A.; Abd El-Wahed, M.S.A. Effect of exogenous salicylic acid or indole acetic acid on their endogenous levels,
germination, and growth in maize. Bull. Natl. Res. Cent. 2020, 44, 167. https://doi.org/10.1186/s42269-020-00416-7.
53. Hemida, K.A.; Eloufey, A.Z.A.; Seif El-Yazal, M.A.; Rady, M.M. Integrated effect of potassium humate and α-tocopherol
applications on soil characteristics and performance of Phaseolus vulgaris plants grown on a saline soil. Arch. Agron. Soil Sci. 2017,
63, 1556–1571. https://doi.org/10.1080/03650340.2017.1292033.
54. Mahdi, A.H.A.; Badawy, S.A.; Abdel Latef, A.A.; El Hosary, A.A.A.; Abd El Razek, U.A.; Taha, R.S. Integrated Effects of
Potassium Humate and planting density on growth, physiological traits and yield of Vicia faba L. Grown in Newly Reclaimed
Soil. Agronomy 2021, 11, 461. https://doi.org/10.3390/agronomy11030461.
55. Osman, A.S.; Rady, M.M. Ameliorative effects of sulphur and humic acid on the growth, anti-oxidant levels, and yields of pea
(Pisum sativum L.) plants grown in reclaimed saline soil. J. Hortic. Sci. Biotechnol. 2012, 87, 626–632.
https://doi.org/10.1080/14620316.2012.11512922.
56. Kumar, P.; Kumar, T.; Singh, S.; Tuteja, N.; Prasad, R.; Singh, J. Potassium: A key modulator for cell homeostasis. J. Biotechnol.
2020, 324, 198–210. https://doi.org/10.1016/j.jbiotec.2020.10.018.
57. Alzahrani, O.; Abouseadaa, H.; Abdelmoneim, T.K.; Alshehri, M.A.; El-Mogy, M.; El-Beltagi, H.S.; Atia, M.A.M. Agronomical,
physiological and molecular evaluation reveals superior salt-tolerance in bread wheat through salt-induced priming approach.
Not. Bot. Horti Agrobot. Cluj-Napoca 2021, 49, 12310. https://doi.org/10.15835/nbha49212310.
58. Khan, H.A.; Siddique, K.H.; Munir, R.; Colmer, T.D. Salt sensitivity in chickpea: Growth, photosynthesis, seed yield
components and tissue ion regulation in contrasting genotypes. J. Plant Physiol. 2015, 182, 1–12.
https://doi.org/10.1016/j.jplph.2015.05.002.
59. Acosta-Motos, J.R.; Ortuño, M.F.; Bernal-Vicente, A.; Diaz-Vivancos, P.; Sanchez-Blanco, M.J.; Hernandez, J.A. Plant Responses
to Salt Stress: Adaptive Mechanisms. Agronomy 2017, 7, 18. https://doi.org/10.3390/agronomy7010018.
60. Molina, A.; Bueno, P.; Marín, M.C.; Rodríguez-Rosales, M.P.; Belver, A.; Venema, K.; Donaire, J.P. Involvement of endogenous
salicylic acid content, lipoxygenase and anti-oxidant enzyme activities in the response of tomato cell suspension cultures to
NaCl. New Phytol. 2002, 156, 409–415. https://doi.org/10.1046/j.1469-8137.2002.00527.x.
61. Shim, I.-S.; Momose, Y.; Yamamoto, A.; Kim, D.-W.; Usui, K. Inhibition of catalase activity by oxidative stress and its
relationship to salicylic acid accumulation in plants. Plant Growth Regul. 2003, 39, 285–292.
https://doi.org/10.1023/A:1022861312375.
62. Nawaz, M.; Ashraf, M.Y.; Khan, A.; Nawaz, F. Salicylic Acid– and Ascorbic Acid–Induced Salt Tolerance in Mung bean (Vigna
radiata (L.) Wilczek) Accompanied by Oxidative Defense Mechanisms. J. Soil Sci. Plant Nutr. 2021, 21, 2057–2071.
https://doi.org/10.1007/s42729-021-00502-3.
63. Ghassemi-Golezani, K.; Lotfi, R. The impact of salicylic acid and silicon on chlorophyll a fluorescence in mung bean under salt
stress. Russ. J. Plant Physiol. 2015, 62, 611–616. https://doi.org/10.1134/S1021443715040081.
64. Aminifard, M.H.; Aroiee, H.; Azizi, M.; Nemati, H.; Jaafar, H.Z.E. Effect of Humic Acid on Antioxidant Activities and Fruit
Quality of Hot Pepper (Capsicum annuum L.). J. Herbs Spices Med. Plants 2012, 18, 360–369.
https://doi.org/10.1080/10496475.2012.713905.
65. Jini, D.; Joseph, B. Physiological Mechanism of Salicylic Acid for Alleviation of Salt Stress in Rice. Rice Sci. 2017, 24, 97–108.
https://doi.org/10.1016/j.rsci.2016.07.007.
66. Kaya, C.; Şenbayram, M.; Akram, N.A.; Ashraf, M.; Alyemeni, M.N.; Ahmad, P. Sulfur-enriched leonardite and humic acid soil
amendments enhance tolerance to drought and phosphorus deficiency stress in maize (Zea mays L.). Sci. Rep. 2020, 10, 6432.
https://doi.org/10.1038/s41598-020-62669-6.
67. Parihar, P.; Singh, S.; Singh, R.; Singh, V.P.; Prasad, S.M. Effect of salinity stress on plants and its tolerance strategies: A review.
Environ. Sci. Pollut. Res. 2015, 22, 4056–4075. https://doi.org/10.1007/s11356-014-3739-1.
68. Hayat, S.; Hasan, S.A.; Fariduddin, Q.; Ahmad, A. Growth of tomato (Lycopersicon esculentum) in response to salicylic acid under
water stress. J. Plant Interact. 2008, 3, 297–304. https://doi.org/10.1080/17429140802320797.
69. Horváth, E.; Szalai, G.; Janda, T. Induction of Abiotic Stress Tolerance by Salicylic Acid Signaling. J. Plant Growth Regul. 2007, 26,
290–300. https://doi.org/10.1007/s00344-007-9017-4.
70. Harfouche, A.L.; Rugini, E.; Mencarelli, F.; Botondi, R.; Muleo, R. Salicylic acid induces H2O2 production and endochitinase
gene expression but not ethylene biosynthesis in Castanea sativa in vitro model system. J. Plant Physiol. 2008, 165, 734–744.
https://doi.org/10.1016/j.jplph.2007.03.010.
71. El-Beltagi, H.S.; Mohamed, H.I.; Aldaej, M.I.; Al-Khayri, J.M.; Rezk, A.A.; Al-Mssallem, M.Q.; Sattar, M.N.; Ramadan, K.M.A.
Production and anti-oxidant activity of secondary metabolites in Hassawi rice (Oryza sativa L.) cell suspension under salicylic
acid, yeast extract, and pectin elicitation. Vitr. Cell. Dev. Biol. Plant 2022, 58, 615–629. https://doi.org/10.1007/s11627-022-10264-x.
72. Guo, K.; Tu, L.; He, Y.; Deng, J.; Wang, M.; Huang, H.; Li, Z.; Zhang, X. Interaction between calcium and potassium modulates
elongation rate in cotton fiber cells. J. Exp. Bot. 2017, 68, 5161–5175. https://doi.org/10.1093/jxb/erx346.
73. Kaur, G.; Asthir, B. Proline: A key player in plant abiotic stress tolerance. Biol. Plant. 2015, 59, 609–619.
https://doi.org/10.1007/s10535-015-0549-3.You can also read