Appendix P3 Economic analysis - Western Sydney Airport
←
→
Page content transcription
If your browser does not render page correctly, please read the page content below
Appendix P3 Economic analysis

Western Sydney Airport
Draft Technical Report to the draft EIS
Draft Economic Analysis

September 2015
Disclaimer
This report: has been prepared by EY for the Commonwealth of Australia and may only be used and relied
on by the Commonwealth for the purpose agreed between EY and the Commonwealth.

EY otherwise disclaims responsibility to any person other than the Commonwealth arising in connection
with this report. EY also excludes implied warranties and conditions, to the extent legally permissible.

The services undertaken by EY in connection with preparing this report were limited to those specifically
detailed in the report and are subject to the scope limitations set out in the report.

The opinions, conclusions and any recommendations in this report are based on conditions encountered
and information reviewed at the date of preparation of the report. EY has no responsibility or obligation to
update this report to account for events or changes occurring subsequent to the date that the report was
prepared.

The opinions, conclusions and any recommendations in this report are based on assumptions made by EY
described in this report. EY disclaims liability arising from any of the assumptions being incorrect. To the
extent that our conclusions are based on forecasts, we express no opinion on the achievability of those
forecasts and thus they should not be relied upon.

EY has prepared this report on the basis of information provided by others who provided information to
EY (including Government authorities), which EY has not independently verified or checked beyond the
agreed scope of work. EY does not accept liability in connection with such unverified information,
including errors and omissions in the report which were caused by errors or omissions in that information.

 Ernst & Young | 2
Glossary of terms
Airport The airport located at the Airport Site.

 Note: the airport is referred to in the Airports Act as Sydney West Airport
 and is also commonly known as Western Sydney Airport

Airport Site The airport site for Sydney West Airport as defined in the Airports Act

Airport-lessee The company that is granted an airport lease over the airport site
company

ATMs Annual Traffic Movements – a landing or departure constitutes one ATM

Aviation activity Any activity for the arrival, departure, movement or operation of aircraft
 and includes aircraft aprons, helipads, heliports, runways, taxiways,
 navigational aids and the like

Base Case: Scenario where the Western Sydney Airport is not developed – i.e. this
 represents the status quo

BTS NSW Bureau of Transport Statistics

CGE Computable general equilibrium (CGE) models are a class of economic
 models that use existing data to estimate how an economy might respond
 to changes in external factors

DPE NSW Department of Planning and Environment

Earthworks Means excavation or filling

Economic footprint The total or gross contribution of an investment / expenditure /
 operations to employment or expenditure in the community (i.e. this does
 not account for substitution impacts)

Environmental Impact Means the environmental impact statement prepared in relation to the
Statement airport under the Environment Protection and Biodiversity Conservation
 Act 1999 following a referral dated 4 December 2014.

FTE Full time equivalent (FTE) is a standard unit of measurement of employee
 time

Greater Metropolitan A wide classification of Sydney, stretching from Newcastle in the north to
Area (GMA) of Sydney Kiama in the south and Blue Mountains in the west. Sydney GMA is broken
 into four catchments: the WSA catchment, KSA catchment, Marginal
 catchment and Other

Joint Study Joint study into aviation capacity in the Sydney region, Report to the
 Australia and NSW Governments, 2012

KSA Sydney (Kingsford-Smith) Airport or Sydney Airport

Land Side That area of an airport and buildings to which the public normally has
 access, consistent with Section 9 of the Aviation Transport Security Act
 2004.

MAP Million annual passengers

 Ernst & Young | 3
Person years A unit of measurement which accounts for the employment of one person
 in a full-time capacity for one year. It provides a consistent basis for
 accounting for employment where, for example, one person might be
 employed full time for five years or five different people working in
 different roles of one year each (both of which would be 5 person years).

Project Case: Scenario where the Western Sydney Airport is developed and operating by
 2025

SA3 Statistical Area Level 3. Statistical Areas Level 3 (SA3s) are built from
 aggregations of whole Statistical Area Level 2 (SA2) boundaries to
 represent regions of between approximately 30,000 people and 130,000
 people to cover the whole of Australia. These boundaries reflect a
 combination of widely recognised informal regions as well as existing
 administrative regions such as State Government Regions in rural areas
 and local Government Areas in urban areas.

Sydney basin area The Sydney basin is identified as the Sydney Greater Capital City
 Statistical Area, as defined by the ABS. It is bordered by Sutherland and
 Bargo in the south, Lake Macquarie and the Hawkesbury River in the
 north and Mt Victoria in the west.

Sydney West Airport The Airport. Note: this is the name used in the Act. The airport is also
 commonly known as Western Sydney Airport

Terminal Means services and facilities for passengers and freight of a kind usually
 provided within an airport terminal building including food and drink
 premises, kiosks, shops, airline lounges, medical centers, transfer
 corridors, business, premises, office premises, retail premises, passenger
 transport facility, public administration facility, vehicle hire premises and
 facilities for the conduct of events, functions, conferences and the like.

Transfer corridor Means the provision of an area for the facilitation of inter- or intra
 terminal transfers of passengers or baggage

Up-gauging An increase in the aircraft size (B737 to A340) by an airline to increase
 the number of available seats for a flight destination in lieu of adding an
 additional flight segment during the day. This will result in an increase in
 passengers per ATM.

Wilton-Richmond The technical study commissioned by the Government in 2012 and
Study completed in 2013 which considered Wilton’s suitability as a second
 airport and explored the use of RAAF Base Richmond for limited civil
 operations.

Western Sydney The Airport. Under the Act the airport is referred to as Sydney West
Airport (WSA) Airport

 Ernst & Young | 4
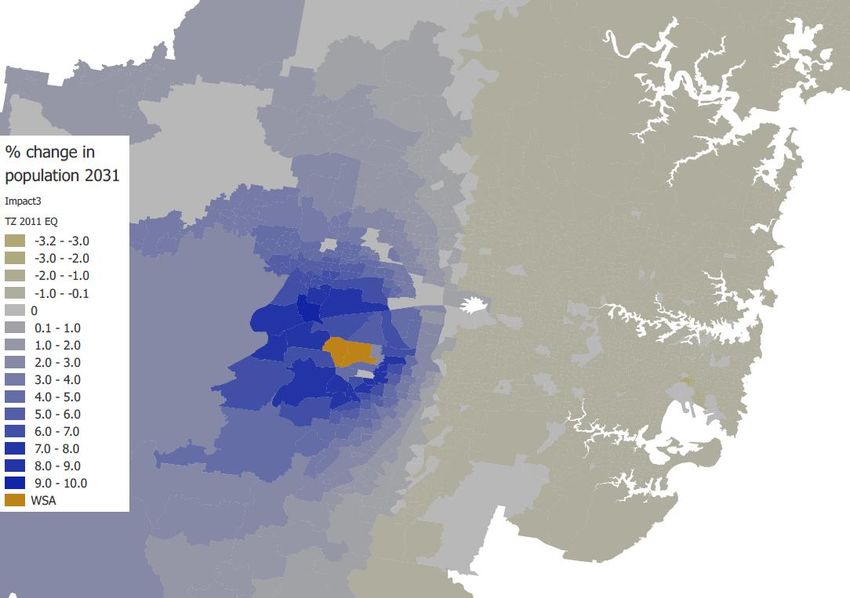
Table of contents
1. Introduction .................................................................................................................. 7
 1.1 Background ............................................................................................................. 7
 1.2 Scope of works ........................................................................................................ 8
 1.3 Approach ................................................................................................................ 8
 1.4 Sources of data ....................................................................................................... 8
 1.5 Assumptions ........................................................................................................... 9
 1.6 Limitations of the analysis ........................................................................................ 9
 1.7 Structure of the report ........................................................................................... 10
2. Construction footprint ................................................................................................. 12
 2.1 Introduction .......................................................................................................... 12
 2.2 Economic footprint of construction ......................................................................... 13
3. Employment at WSA .................................................................................................... 20
 3.1 Introduction .......................................................................................................... 20
 3.2 Direct employment ................................................................................................ 20
 3.3 On-site business park employment .......................................................................... 22
 3.4 Conclusions .......................................................................................................... 25
 3.5 Limitations of this section ...................................................................................... 26
4. Land use econometric model ........................................................................................ 27
 4.1 Land use econometric model .................................................................................. 27
 4.2 Land use model methodology ................................................................................. 28
 4.3 Population model results ........................................................................................ 32
 4.4 Population Impacts ................................................................................................ 32
 4.5 Employment model results ..................................................................................... 34
 4.6 Employment impacts ............................................................................................. 34
 4.7 Conclusions .......................................................................................................... 36
 4.8 Limitations ........................................................................................................... 38
5. CGE analysis ............................................................................................................... 40
 5.1 Data Sources ......................................................................................................... 40
 5.2 CGE Models ........................................................................................................... 40
 5.3 WSA CGE methodology .......................................................................................... 43
 5.4 Consumption ......................................................................................................... 45
 5.5 Production ............................................................................................................ 46
 5.6 Labour ................................................................................................................. 46
 5.7 The Australian economy ......................................................................................... 47
 5.8 The Implementation of Western Sydney Airport ........................................................ 48
 5.9 Results ................................................................................................................. 48
 5.10 Conclusion ............................................................................................................ 50
 5.11 Limitations of the analysis ...................................................................................... 50

 Ernst & Young | 5
sdfg

 Section A
 Introduction

 Ernst & Young | 6
1. Introduction

1.1 Background
 Planning investigations to identify a site for a second Sydney airport first commenced in 1946 with a
 number of comprehensive studies—including two previous environmental impact statements for a site at
 Badgerys Creek—having been completed over the last 30 years.

 More recently, the Joint Study on Aviation Capacity in the Sydney Region (Department of Infrastructure
 and Transport, 2012) and A Study of Wilton and RAAF Base Richmond for civil aviation operations
 (Department of Infrastructure and Transport, 2013) led to the Australian Government announcement on
 15 April 2014 that Badgerys Creek will be the site of a new airport for Western Sydney. The airport is
 proposed to be developed on approximately 1,700 hectares of land acquired by the Commonwealth in the
 1980s and 1990s. Construction could commence as early as 2016, with airport operations commencing in
 the mid-2020s.

 The proposed airport would provide both domestic and international services, with development staged in
 response to demand. The initial development of the proposed airport would include a single, 3,700 metre
 runway coupled with landside and airside facilities such as passenger terminals, cargo and maintenance
 areas, car parks and navigational instrumentation capable of facilitating the safe and efficient movement
 of up to 10 million passengers per year. While the proposed Stage 1 development does not currently
 include a rail service, planning for the proposed airport preserves flexibility for several possible rail
 alignments including a potential express service. A final alignment will be determined in consultation with
 the New South Wales Government, with any enabling work required during Stage 1 subject to a separate
 approval and environmental assessment process.

 In the longer term, approximately 40 years after operations commence and in accordance with relevant
 planning processes, the airport development could include parallel runways and additional passenger and
 transport facilities for around 82 million passenger movements per year. To maximise the potential of the
 site, the airport is proposed to operate on a 24 hour basis. Consistent with the practice at all federally
 leased airports, non-aeronautical commercial uses could be permitted on the airport site.

 On 23 December 2014, the Australian Government Minister for the Environment determined that the
 construction and operation of the airport would require assessment in accordance with the Environment
 Protection and Biodiversity Conservation Act 1999 (Cth) (EPBC Act). Guidelines for the content of an
 environmental impact statement (EIS) were issued in January 2015. Approval for the construction and
 operation of the proposed airport will be controlled by the Airports Act 1996 (Cth) (Airports Act). The
 Airports Act provides for the preparation of an Airport Plan which will serve as the authorisation for the
 development of the proposed airport.

 The Australian Government Department of Infrastructure and Regional Development is undertaking
 detailed planning and investigations for the proposed airport, including the development of an Airport
 Plan. The draft Airport Plan is the primary source of reference for, and companion document to, the EIS.
 The draft Airport Plan identifies a staged development of the proposed airport. It provides details of the
 initial development being authorised, referred to as Stage 1, as well as a long-term vision of the airport’s
 development. This enables preliminary consideration of the implications of longer term airport operations.
 Any stages of airport development beyond Stage 1 would be managed in accordance with the existing
 process in the Airports Act. This includes a requirement that for major developments (as defined in the
 Airports Act), a major development plan be approved by the Australian Government Minister for
 Infrastructure and Regional Development following a referral under the EPBC Act.

 The Airport Plan will be required to include any conditions notified by the Environment Minister following
 this EIS. Any subsequent approvals for future stages of the development will form part of the airport
 lessee company’s responsibilities in accordance with the relevant legislation.

 Ernst & Young | 7
1.2 Scope of works
 This report has been prepared as part of the proposed Western Sydney Airport draft EIS, in accordance
 with Section 10 of the EIS Guidelines issued in January 2015 by the Department of the Environment.
 Section 10 of the Guidelines sets out the following requirements:

 • The economic and social impacts of the action, both positive and negative, must be analysed. Matters of
 interest may include:

 • Details of any public consultation activities undertaken, and their outcomes

 • Details of any consultation with Indigenous stakeholders

 • Projected economic costs and benefits of the project, including the basis for their estimation
 through cost/benefit analysis or similar studies

 • Employment opportunities expected to be generated by the project (including construction and
 operational phases).

 • The economic and social impacts must include impacts at the local, regional and national level.

 • Details of the relevant cost and benefits of alternative options to the proposed action, as identified in
 section 3, should also be included.

 This document specifically provides an assessment of economic and employment impacts of the project for
 construction of Stage 1, as well as operations of the proposed airport in the short term (2031) and the
 longer term (2063). Economic and employment impacts have included consideration of how impacts are
 distributed at the local, regional and national level.

 Specifically the Draft Economic Analysis includes the following:

 • Airport construction land use impact assessment – Considers the potential impacts of the construction
 of the proposed Stage 1 airport on employment in Western Sydney / Greater Sydney, as well as the
 value added implications of this investment

 • Operations land use impact assessment –This considers how the proposed WSA development could
 potentially deliver jobs to Western Sydney in the form of direct employment, on-site business park
 employment, as well as off-site employment (due to flow-on impacts)

 • Computable General Equilibrium (CGE) economic impact assessment – This considers the distribution
 of the economic benefits identified for the WSA project – in terms of household incomes, gross value
 added, jobs, etc.

 This report has been prepared to detail the methodology and findings of each of the above and acts as a
 Technical Report to the draft EIS that has been prepared. This report should not be considered in isolation
 from the draft EIS.

1.3 Approach
 In accordance with the study brief and accepted ‘best practice’ in the development of major transport
 project economic analyses, this analysis has been prepared to conform to the EIS guidelines.

 More details on the approach to each of the three components of the Draft Economic Analysis is outlined in
 the relevant sections of this report.

1.4 Sources of data
 A number of data sources have been utilised to undertake this analysis:

 • Aviation demand forecasts – The changes in travel patterns as a result of an operational WSA. This
 analysis was undertaken by LEK Consulting
 Ernst & Young | 8
• Airport proposed design – The Reference Design of the proposed WSA development which informs the
 costs of the project as well as the scale of demand which can be accommodated.

 • Capital and maintenance costs – WT Partnership have estimated the costs of construction (and
 maintenance costs) of the proposed airport and off-site supporting infrastructure.

 • Commercial analysis – Revenues and operating costs have been estimated by LEK Consulting.

 • Ground transport demand – An assessment of the change in ground transport demand (road and public
 transport) that will result from WSA – including workers and passengers to the airport and business park
 was developed by Transport for NSW’s Bureau of Transport Statistics (BTS) 1

 • Population, demographics and employment forecasts – Long-term forecasts of population,
 demographics and employment in the Greater Metropolitan Area of Sydney have been provided by SGS
 Economics and Planning (SGS).

1.5 Assumptions
 A number of assumptions were made to undertake this analysis:

 • All value terms throughout this report are presented in real 2015 dollar terms unless clearly expressed
 otherwise

 • All analysis of changes in employment as a result of the development of the proposed WSA assumes a
 net zero gain in employment across NSW. That is, the development of the proposed WSA is assumed to
 not change total employment in NSW, but to re-distribute it towards areas of increased activity (i.e.
 Western Sydney). This is a standard assumption in the economic appraisal of proposed transport
 infrastructure investments and is conservative

 • As part of the land use impact assessment of the operations of the proposed airport, the employment
 impacts of a possible future business park has been included. The proposed development of a business
 park at the proposed airport site is consistent with the draft Airport Plan but outside of the scope of the
 Stage 1 airport development and would be subject to a future separate environmental assessment and
 approval regime under the Airports Act 1996.

 • Results for 2031and 2063 have been presented. The year 2031 is used due to the traffic model outputs
 that have been provided by the NSW Bureau of Transport Statistics. The year 2063 is consistent with
 the definition of the long term scenario used for the purposes of the draft EIS

 • All the data and calculations presented in this analysis are based on the concept design presented in the
 draft Airport Plan and may change following detailed design of the proposed airport.

 Assumptions specific to each of the three components of the Draft Economic Analysis has been outlined in
 the remainder of the report.

1.6 Limitations of the analysis
 The findings across the three components of the Draft Economic Analysis are subject to the following
 cross-cutting limitations:

 • This work has not been prepared to inform decision making processes. Its sole purpose is to present
 potential employment and economic outcomes as a result of the development of the proposed WSA.
 Therefore, sensitivity testing around the results of the analysis has not been conducted

 • Assumptions, forecasts and estimates underpinning the analysis are subject to further change and
 refinement (i.e. as part of the Final EIS process)

 1
 Note that for the purposes of the evaluation, workers at WSA and their changing travel patterns are included as an externality
 impact of the airport

 Ernst & Young | 9
• Assumptions used to develop the forecasts may not be realised and unanticipated events and
 circumstances may occur. Therefore, there are likely to be differences between the forecast and the
 actual results, and these differences may be material

 • This economic analysis is an input to the draft EIS for the WSA project only. Consequential
 infrastructure in the surrounding area (for example, new road links to the airport) is expected to be
 assessed by the NSW Government in separate decision making processes

 • BTS traffic modelling is one of the inputs used to identify the scale of benefits from the WSA
 development to consumers of air services and the wider community. The BTS model is based on a
 planning horizon which is shorter than the long term planning period.2 As a result, traffic modelling
 inputs from BTS (including travel times and generalised costs of access) were not provided for the full
 evaluation period, and therefore were assumed to remain constant for the remainder of the evaluation
 period.

 Limitations specific to each of the three components of the Draft Economic Analysis has been outlined in
 the remainder of the report.

1.7 Structure of the report
 The report is structured as follows:

 Table 1: Structure of the report

 Section Contents
 Section A – Introduction Chapter 1 – Introduction
 Section B – Construction footprint Chapter 2 – Construction footprint
 Chapter 3 – Employment at WSA
 Section C – Land use impacts of operations
 Chapter 4 - Land use impacts of operations
 Section D – Economic impacts of operations Chapter 5 - Spatial CGE modelling
 Source: EY

 2
 The BTS planning horizon is for the following 25 years, as opposed to the definition of the long term scenario used for the purposes
 of the Draft EIS (i.e. 2063)

 Ernst & Young | 10
Section B
Construction footprint

 Ernst & Young | 11
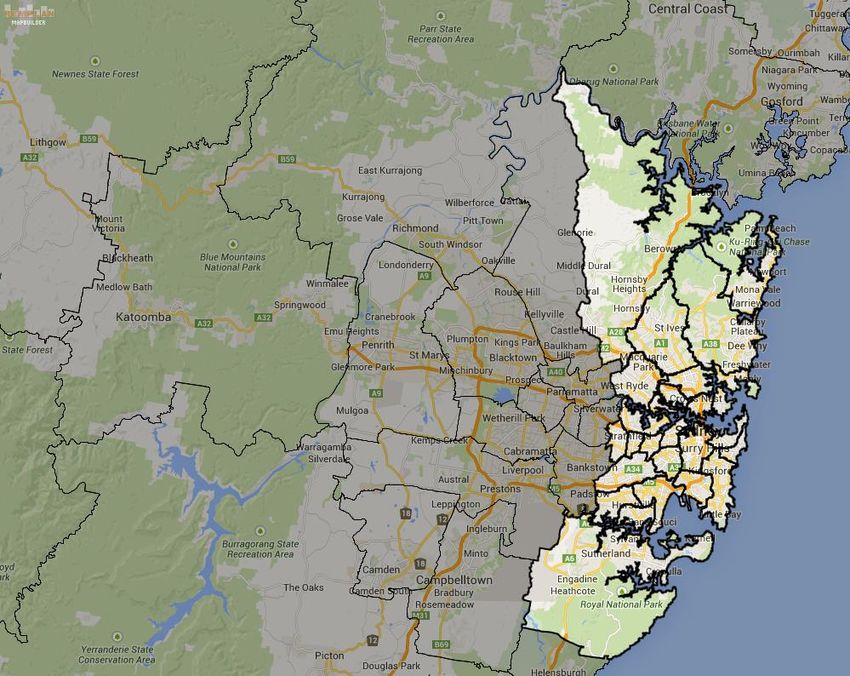
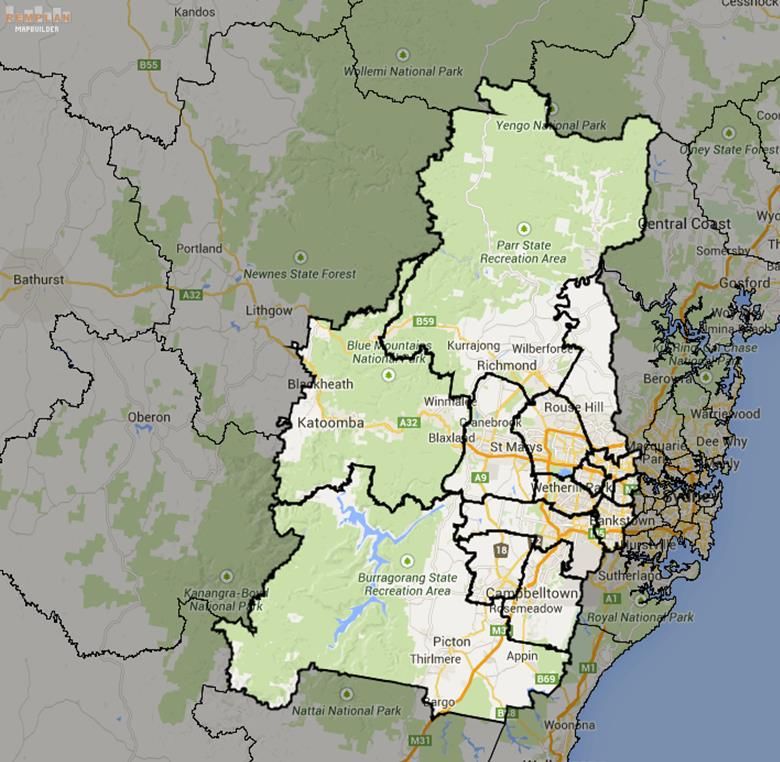
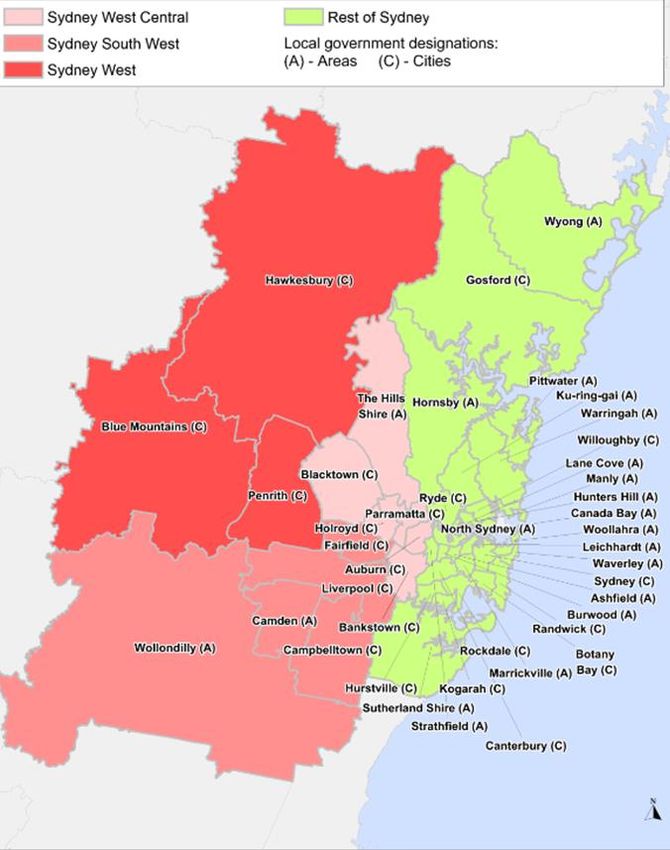
2. Construction footprint

2.1 Introduction
 This section of the report presents results of an analysis of economic impacts of the construction of Stage
 1 of the proposed Western Sydney Airport (the airport). Specifically, the analysis presents an economic
 contribution analysis covering the economic footprint of the construction phase of the Stage 1
 development.

 The results are presented for Western Sydney and ‘Rest of Sydney’. Western Sydney comprises three
 subregions as defined by the NSW Government, with each subregion containing the following Local
 Government Areas (LGAs):

 ► Sydney South West - Liverpool, Fairfield, Camden, Campbelltown and Wollondilly LGAs

 ► Sydney West - Penrith, Hawkesbury and Blue Mountains LGAs

 ► Sydney West Central - Auburn, Bankstown, Blacktown, Holroyd, Parramatta and The Hills Shire LGAs

 ’Rest of Sydney’ refers to the areas identified in Figure 1 not contained within the three Western Sydney
 subregions. The spatial areas are shown in the following map.

 Figure 1: Spatial areas for reporting with Local Government Areas identified

 Ernst & Young | 12
2.2 Economic footprint of construction
 The following section outlines:

 ► Direct and flow-on economic contributions

 ► Our approach to measuring economic contribution

 ► Economic footprint – employment

 ► Economic footprint – value-add

2.2.1 Direct and flow-on economic contributions
 The direct and flow-on economic contributions presented in this report are based upon the following
 construction activities:

 ► ►Non-residential building construction

 ► ►Heavy and civil engineering construction

 ► ►Construction services

 The analysis firstly identifies the direct jobs and the value-add of the proposed airport development in the
 above sectors. It then measures the flow-on impacts on jobs and value-add in other sectors along the
 supply chain, as well as consumption impacts through additional household expenditure.

 The following definitions apply for the economic contribution analysis:

 ► ►Value-add: for each industry this is the value of production outputs (both direct and flow-on) less the
 value of inputs sourced from other sectors. The sum of value-add across all industry sectors in a
 specific region is known as the Gross Regional Product (GRP)

 ► ►”Direct” jobs and value-add: this is the number of jobs and amount of value-add directly related to the
 construction activities on-site. It includes the construction and fitting out of the airport, terminal
 buildings, the business park and associated infrastructure.

 ► ►”Flow-on” jobs and value-add: this is the number of jobs and amount of value-add generated in the
 supply chain of the on-site activities. This includes two components: the industrial effect and the
 consumption effect. The industrial effect is the impact on industries supplying the goods and services
 being used by the on-site activities. The consumption effect is the impact on sectors supplying goods
 and services being bought by households with the labour income they earned from the on-site
 activities.

 For the purposes of the analysis, ‘person years’ has been used to express results. This term refers to the
 number of people employed, multiplied by the number of years that they are employed for. Therefore, 10
 people employed for one year, or 1 person employed for 10 years, are both equivalent to 10 person years
 of employment. For the purposes of this economic contribution analysis, all employment totals over the
 construction period (i.e. from 2016 to 2024) are expressed in person years.

2.2.2 Approach to measuring economic contribution
 In order to measure economic contribution, a two-step process was implemented:

 ► Initial inputs (sourced from GHD and REMPLAN) were collated; and

 Western Sydney Unit 13
 Western Sydney Airport: Draft Economic Analysis
► Input-output modelling of direct and flow-on contributions was performed by EY (using GHD
 employment estimates and REMPLAN multipliers for the Western Sydney and Greater Sydney 3
 regional economies).4

 Employment assumptions
 Table 2 presents the number of Full Time Equivalent (FTE) jobs involved in the construction sector by type
 of activity for each financial year during the construction phase of Stage 1 of the Project, based on GHD
 estimates.

 Table 2: Construction FTE employment by category
 GHD Category REMPLAN Category 2017 2018 2019 2020 2021 2022 2023 2024 Total
 Aviation Infrastr - Labour (Building) Non-Residential Building Constr - - - 74 124 256 217 82 754
 Aviation Infrastr - Labour (Civil) Heavy & Civil Engineering Constr - - 27 159 128 114 74 104 605
 Aviation Infrastr - Superv and mangnt Construction Services - - 4 55 135 157 148 84 583
 Site Prep - Labour (civil) Heavy & Civil Engineering Constr 52 141 103 15 26 61 28 - 427
 Site Prep - Supervisory and mangnt Construction Services 16 48 78 80 73 44 7 - 346
 Aviation Infrastructure - Contract Admin Construction Services - - 3 40 97 113 107 60 419
 Site Prep - Contract Construction Services 4 14 22 23 21 12 2 - 97
 Total 72 203 236 446 605 758 583 330 3,231
 Note: Construction is expected to end in FY2024, with development approval processes being required before the airport
 commences operations in July 2025.
 Source: GHD

 The number of jobs by type of work is mapped to the REMPLAN categories below, as shown in the above
 table:

 ► Non-Residential Building Construction – construction of non-residential buildings such as hotels,
 motels, hostels, hospitals, prisons or other buildings

 ► Heavy & Civil Engineering Construction – construction or general repair of roads, bridges, aerodrome
 runways or parking lots

 ► Construction Services – a range of services provided as part of construction activities, including
 installation, finishing, management, etc.

2.2.3 Economic footprint – Employment
 This has been estimated for:

 Western Sydney
 Table 3 summarises the footprint of the construction activities on the Western Sydney economy in each
 financial year in terms of FTE jobs, based on REMPLAN multipliers and GHD job estimates for the project.

 Table 3: Western Sydney FTE employment footprint (FTE)

 Effects/Year 2017 2018 2019 2020 2021 2022 2023 2024 Total
 Direct Effect 72 203 236 446 605 758 583 330 3,231
 Industrial Effect 117 331 386 729 988 1,238 953 540 5,281
 Consumption Effect 63 178 207 391 530 664 511 290 2,834
 Total 251 712 828 1,565 2,123 2,660 2,047 1,160 11,346
 Source: REMPLAN, EY analysis

 3
 This includes Western Sydney plus the rest of Sydney
 4
 REMPLAN is an economic input-output model of regional economies which traces the revenue and expenditure ‘multipliers’ that link
 industries and workers within and outside economic regions based on ABS data.

 Western Sydney Unit 14
 Western Sydney Airport: Draft Economic Analysis
Figure 2 shows the annual contribution to employment over time for Western Sydney:

Figure 2: Western Sydney FTE employment footprint

Source: REMPLAN, EY analysis

Direct on-site jobs reach 750 by 2022, generating a footprint that furthermore includes 1,200 jobs in the
supply chain and a further 660 jobs through consumption effects. The total Western Sydney employment
footprint reaches 2,700 jobs in 2022 and a total of 11,300 person-years over the construction period.

Greater Sydney
Table 4 summarises the footprint on the Greater Sydney economy in each financial year in terms of jobs,
based on REMPLAN multipliers and GHD job estimates for the project.

Table 4: Greater Sydney employment footprint (FTE)

Effects/Year 2017 2018 2019 2020 2021 2022 2023 2024 Total
Direct Effect 72 203 236 446 605 758 583 330 3,231
Industrial Effect 130 369 429 810 1,099 1,377 1,060 600 5,874
Consumption Effect 99 279 325 614 833 1,043 803 455 4,451
Total 300 850 990 1,870 2,537 3,178 2,446 1,386 13,556
Source: REMPLAN, EY analysis
Note that the Greater Sydney results outlined above are equal to Western Sydney plus the rest of Sydney

Western Sydney Unit 15
Western Sydney Airport: Draft Economic Analysis
Figure 3 shows the annual contribution to employment over time for Greater Sydney:

 Figure 3: Greater Sydney FTE employment footprint

 Source: REMPLAN, EY analysis
 Note that the Greater Sydney results outlined above are equal to Western Sydney plus the rest of Sydney

 The Greater Sydney employment footprint is slightly larger, as a more of the flow-on impacts are captured
 within this larger geographical area. The Greater Sydney employment footprint reaches 3,200 jobs in
 2022, and 13,600 person-years in total.

2.2.4 Economic contribution – Value-add
 This has been estimated for:

 Western Sydney
 Table 5 summarises the economic footprint of the construction activities on the Western Sydney economy
 in each financial year in terms of value-add (in millions of dollars), based on REMPLAN multipliers and GHD
 job estimates for the project.

 Table 5: Western Sydney value-add footprint ($ millions)

 Effects/Year 2017 2018 2019 2020 2021 2022 2023 2024 Total
 Direct Effect 16 44 52 98 132 166 128 72 707
 Industrial Effect 17 47 55 104 141 176 136 77 751
 Consumption Effect 10 28 33 62 84 105 81 46 446
 Total 42 119 139 263 356 446 344 195 1,904
 Source: REMPLAN, EY analysis

 Figure 4 shows the annual contribution to value-add over time for Western Sydney:

 Western Sydney Unit 16
 Western Sydney Airport: Draft Economic Analysis
Figure 4: Western Sydney value-add footprint

Source: REMPLAN, EY analysis

Direct on-site value-add reaches $170m by 2022, generating another $175m and $105m indirectly
(through industrial and consumption effects). The total Western Sydney value-add footprint reaches
$450m in 2022, summing up to $1,900m over the construction period (undiscounted).

Greater Sydney
The table below summarises the economic footprint on the Greater Sydney economy in each financial year
in terms of value-add (in millions of dollar), based on REMPLAN multipliers and GHD job estimates for the
project.

Table 6: Greater Sydney value-add footprint ($ millions)

Effects/Year 2017 2018 2019 2020 2021 2022 2023 2024 Total
Direct Effect 16 44 52 98 132 166 128 72 707
Industrial Effect 19 55 64 121 165 206 159 90 880
Consumption Effect 16 45 52 99 134 168 129 73 716
Total 51 145 168 318 431 540 416 235 2,304
Source: REMPLAN, EY analysis
Note that the Greater Sydney results outlined above are equal to Western Sydney plus the rest of Sydney

Figure 5 shows the annual contribution to value-add over time for Greater Sydney:

Western Sydney Unit 17
Western Sydney Airport: Draft Economic Analysis
Figure 5: Greater Sydney value-add footprint

Source: REMPLAN, EY analysis
Note that the Greater Sydney results outlined above are equal to Western Sydney plus the rest of Sydney

As with employment impacts, the Greater Sydney value-add footprint is greater in magnitude than for
Western Sydney, reaching $540m in 2022 and $2,300m over the construction period.

Limitations to this section
The findings that have been presented in this section are subject to the following limitations:

► The main limitation of economic contribution analysis is that it uses gross values rather than net values. This
 means it expresses the amount of economic activity that is directly and indirectly dependent on a project or an
 industry, but it does not explain whether the economic activity would be lost had the project not gone ahead or
 had the industry not existed. To understand the net impacts of a project, its economic contribution would have to
 be compared to that of an alternative use of resources.

► Furthermore, economic contribution analysis does not support conclusions as to whether the delivery of the
 project is ‘better’ for the economy than another project.

► Inputs have been sourced from GHD, BTS and a range of other organisations. EY has not undertaken any
 independent verification of the accuracy of any of these inputs.

► Assumptions, forecasts and estimates underpinning the analysis are subject to further change and refinement.

► Assumptions used to develop the forecasts may not be realised and unanticipated events and circumstances may
 occur. Therefore, there are likely to be differences between the forecast and the actual results, and these
 differences may be material.

► The results should be interpreted as being ‘on average’ estimates, and all else being equal. They should not be
 taken to reflect ‘exact’ and final impacts on population, employment, value-add or any other variable.

► The assessments focus on the economic outcomes resulting from the introduction of the airport. They do not
 consider any implications arising from any other policy changes or impacts, including how the airport is funded.

► The models do not explicitly take into account time, nor how preferences may change over time (between now
 and 2031 for example). Estimates should be thought of as a point in time cross sectional estimate for each of the
 modelled years.

Western Sydney Unit 18
Western Sydney Airport: Draft Economic Analysis
Section C
 Land use impacts of operations

Western Sydney Unit 19
Western Sydney Airport: Draft Economic Analysis
3. Employment at WSA
 Airports provide a mix of direct and indirect employment opportunities for communities, cities and
 regions.

3.1 Introduction
 For the purposes of the technical report, the potential employment impacts that the operations of the
 proposed WSA can have on the Western Sydney (and wider) region has been considered in three
 categories:

 • Direct airport employment (see Section 3.2) - Direct employment includes those persons that are
 employed at the airport to assist in the provision of its services. Direct employment at an airport
 typically includes administration and airport management staff, baggage handlers, airline staff, freight
 processing, retail operators, government operators, security and other services provided to customers

 • On-site business park employment (see Section 3.3) – The airport site is expected to contain a business
 park, which can attract services directly supporting the operations of the airport (e.g. flight kitchens),
 services for airport employees and passengers (e.g. hotels, restaurants, tourism, car rental), as well as
 freight, high technology, manufacturing and finance / business related services

 • Off-site (flow-on) employment effects (see Section 4) – The development of the proposed WSA is likely
 to have distributional effects on population and employment decisions in Sydney (and NSW), as
 businesses locate closer to the operating airport and people locate closer to employment opportunities.

3.2 Direct employment
 Direct employment includes those persons that are employed at the airport to assist in the provision of its
 services.

 In relation to direct employment, the three broad categories of employees in airports are: airline
 operation/service (such as ground handling, airline staff, fuel staff, freight operations staff and all
 maintenance staff), administration (such as airport company, police, immigration and customs employees)
 and commercial (such as duty free retail, restaurants and car hire companies). 5

 This section considers the approach used to estimate the total direct employees at the WSA site, and
 presents the results to the approach, and how they should be interpreted.

3.2.1 Approach
 To identify the total number of direct airport jobs which could be supported by the proposed airport
 development, a benchmarking exercise was used to determine the relationship between the passenger
 throughput at domestic and international airports and the number of direct employees at each airport.

 Table 7 presents the findings from this benchmarking exercise:

 Table 7: Results from the benchmarking exercise

 Airport FTE's pax in '000 FTE per MAP
 London Airport 73000 76000 961
 Schiphol Airport 60000 48000 1250
 JFK NY 37000 53300 694
 EWR NJ 21000 35600 590

 5
 York Aviation (2004), The social and economic impact of airports in Europe

 Western Sydney Unit 20
 Western Sydney Airport: Draft Economic Analysis
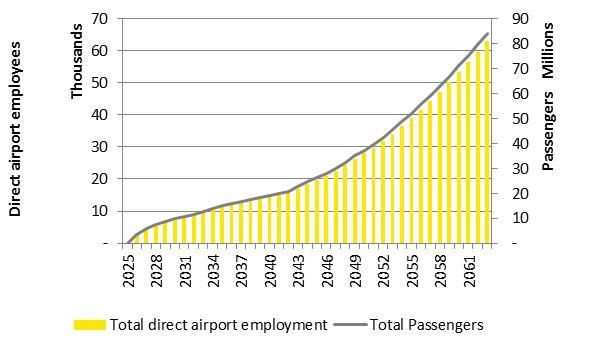
Airport FTE's pax in '000 FTE per MAP
 LGA NY 12000 27000 444
 Atlanta 58000 96000 604
 Orlando 18000 34000 529
 Hong Kong 40000 54000 741
 Sydney 36882 32346 1140
 Brisbane 14700 20300 724
 Melbourne 12542 24448 513
 Canberra 4900 3200 1531
 Perth 5960 9359 637
 Adelaide 5070 6784 747
 Darwin 1641 1539 1066
 Wellington 1361 5021 271
 Sunshine Coast 900 917 981
 Newcastle 383 1173 327
 Launceston 319 1127 283
 Hobart 250 1869 134
 Total 403908 531983 759
 Source: Publically available sources

 The average employees per million annual passengers are a function of the airports considered in the
 analysis. Characteristics such as an airports scale (and resulting efficiencies), operating model and
 surrounding community can each have a significant effect on the direct employees required to service one
 million passenger movements.

 In light of this the results in the table above demonstrate that there is a wide range of variability in the
 number of employees per million annual passengers – results range from 134 FTE per million annual
 passengers at Hobart Airport, to 1,250 FTE per million passengers at Schiphol Airport (Amsterdam,
 Netherlands).

 Recognising the high degree of variability in the analysis, it was found that the average results are broadly
 consistent with:

 • The findings in A study of Wilton and RAAF Base Richmond for civil aviation operations (released in
 2013) – 749 FTE per million annual passengers

 • The technical advice provided by LEK Consulting (the demand modelling team) – 750 FTE per million
 annual passengers.

 Therefore a ratio of 750 employees to one million annual passengers was applied to passenger demand
 forecasts to calculate expected direct employees at WSA.

3.2.2 Results and interpretation
 Given the findings presented above and the draft demand forecasts delivered by LEK Consulting, the
 expected direct employees at the proposed WSA are:

 • In 2031 – 8,730 direct employees

 • In 2063 – 62,860 direct employees

 Figure 6 highlights how employee numbers are expected to grow over the course of the demand modelling
 period (i.e. to 2075).
 Western Sydney Unit 21
 Western Sydney Airport: Draft Economic Analysis
Figure 6: Direct employees at WSA to 2075

 Source: EY

 When interpreting these results it is important to note that:

 • These are estimates of the gross contribution of employment to Western Sydney as a result of the
 delivery of the proposed WSA. It is not a net measure (i.e. it does not consider substitution effects; i.e.
 the likelihood that some people who will be employed by the airport may have already been employed in
 a different job in Western Sydney

 • It is assumed that the airport does not deliver any new population or jobs to NSW (i.e. beyond that
 which is currently forecast by state planning etc.). Therefore, in 2031, 8,730 jobs have been re-
 distributed from the remainder of NSW – i.e. 8,730 people have moved from a previous job to work at
 the airport.

3.3 On-site business park employment
 The Land Use Plan contained within the draft Airport Plan permits commercial and other activities to take
 place in other areas of the airport site. As part of this report, the employment impacts of a possible
 business park have been assessed. However, these developments are outside of the scope of the Stage 1
 development and would be subject to a separate environmental assessment and approval regime under
 the Airports Act 1996.

 As informed by our design consultant’s Landrum & Brown, it is possible that an on-site business park at
 WSA will be delivered in stages alongside the airport development to 2063. The business park could
 potentially contain the following land uses: 6

 • Industrial

 • Office

 • Hotels

 • Petrol station and food outlets

 • Regional shopping centre

 6
 It is important to note that for the purposes of the draft EIS, the impacts of the following land uses have not been considered.

 Western Sydney Unit 22
 Western Sydney Airport: Draft Economic Analysis
• Bulky goods.

 This section considers the approach used to estimate the total on-site business park employees at the WSA
 site, and presents the results of the approach, and how they should be interpreted.

3.3.1 Approach
 The approach used to estimate the total number of on-site business park employees is based on the
 approach that was used to conduct the same analysis as part of the Wilton and Richmond Study released in
 2013. This involved three stages of work:

 1. Estimate the scale of the business park
 The potential scale and land use at the proposed business park was a key driver of the expected number of
 employees. As part of the drafting process for the draft Airport Plan, the land envelope available for the
 on-site business park was identified. A market sounding and work from the EY Real Estate team then
 identified how the identified business park envelope could be divided between different land uses.

 Table 8 provides the assumed allocation of land to different land uses to 2063, as of May 2015:

 Table 8: Proposed land use at the on-site business park (all units in m2)

 2031 2063
 Industrial 350,000 845,000
 Office 10,000 100,000
 Hotels 20,000 50,000
 Petrol Station and Food Outlets 15,000 40,000
 Regional shopping centre - 200,000
 Bulky goods 153,000 561,000
 Total 548,000 1,796,000
 Source: L&B / EY Real Estate Advisory

 Therefore, the on-site business park was expected to grow from 548,000 m2 in 2031 to 1,796,000 m2 in
 2063, with the largest portion of land being set aside for industrial use and bulky goods.

 2. Apply floor space to site ratio
 A floor space ratio is the ratio of a buildings total floor area (gross floor area) to the gross area of the plot
 of land on which it is constructed.

 Different land uses have standard floor space to site ratios. These were provided by the EY Real Estate
 Advisory team and used to identify the total floor space available given the land use expectation outlined in
 the previous step of the approach.

 Table 9 provides the ratios applied:

 Table 9: Floor space to site ratios

 Land use Floor space to site ratio
 Industrial 50%
 Office 125%
 Hotels 40%
 Petrol Station and Food Outlets 40%
 Regional shopping centre 100%
 Bulky goods 50%
 Source: EY Real Estate Advisory

 Western Sydney Unit 23
 Western Sydney Airport: Draft Economic Analysis
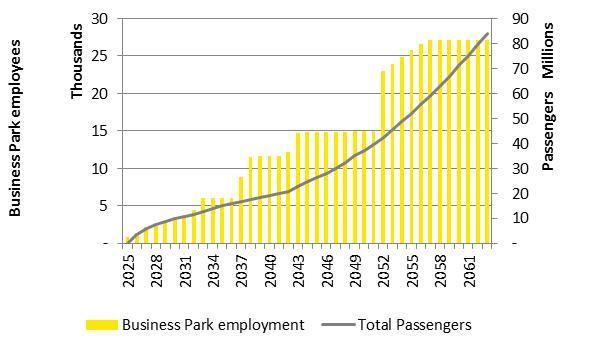
3. Apply a m2 per employee
 Having identified the total floor space available for each land use, standards (defined by industry) which
 outline the number of employees per square metre of floor space were then applied to identify total
 employees at the proposed business park.

 The square metres per employee, by land use are outlined in below.

 Table 10: Square metres per employee, by land use7

 Land use M2 per employee
 Industrial 50
 Office 10
 Hotels 54
 Petrol Station and Food Outlets 20
 Regional shopping centre 90
 Bulky goods 100
 Source: EY Real Estate Advisory

3.3.2 Results and interpretation
 Using the approach outlined above, it was estimated that the on-site business park will support:

 • In 2031 – 4,440 employees

 • In 2063 – 27,150 employees.

 Table 11 provides a breakdown of these employment estimates by land use:

 Table 11: Business park employees

 2031 2063
 Industrial 3,500 8,450
 8
 Office - 12,500
 Hotels 74 370
 Petrol Station and Food Outlets 200 800
 Regional Shopping Centre - 2,222
 Bulky Goods 665 2,805
 TOTAL 4,439 27,148
 Source: EY
 As noted previously, the business park development was not considered as part of the draft EIS process

 Figure 7 illustrates expected growth in on-site business park employees (relative to total passenger
 growth):

 7
 It should be noted that the square metres per hotel employee were not provided, and therefore, this was estimated as an average
 of the other land uses
 8
 It is assumed that employees are hired one year after land is released. Therefore, while there are 10,000 m2 of office space
 available in the business park in 2031, it has only just been released that year, and therefore, there is no employment expected

 Western Sydney Unit 24
 Western Sydney Airport: Draft Economic Analysis
Figure 7: Business park employees to 2075

 Source: EY

 When interpreting these results it is important to note that:

 • These are estimates of the gross contribution of employment to Western Sydney as a result of the
 delivery of the proposed WSA. It is not a net measure (i.e. it does not consider substitution effects: i.e.
 the likelihood that some people who will be employed by the airport may have already been employed in
 a different job in Western Sydney

 • It is assumed that the airport does not deliver any new population or jobs to NSW (i.e. beyond that
 which is currently forecast by state planning etc.). Therefore, in 2031, 4,440 jobs have been re-
 distributed from the remainder of NSW – i.e. 4,440 people have moved from a previous job to work at
 the airport.

3.4 Conclusions
 The combined direct employee and on-site business park employee estimates represent the total on-site
 employment anticipated over the planning horizon (i.e. to 2063) of the proposed WSA development.

 Table 12 outlines the total employment that is expected to be redistributed to the WSA site.

 Table 12: Total on-site employment

 2031 2063
 Direct employees 8,730 62,860
 On-site business park employees 4,439 27,148
 TOTAL 13,169 90,008
 Source: EY

 Therefore, total on-site employment is anticipated to grow from approximately 13,000 in 2031, to
 approximately 90,000 in 2063.

 These first distributional effects will have subsequent flow-on impacts onto the population growth and
 employment growth in the areas surrounding the proposed WSA. The next section considers these flow-on
 impacts in greater detail.

 Western Sydney Unit 25
 Western Sydney Airport: Draft Economic Analysis
3.5 Limitations of this section
 When considering the numbers that have been outlined in this section it is important to note that:

 • The direct employment estimates that are presented are draft estimates. These are a function of the demand
 modelling which has been undertaken by LEK in February 2015 and are in the process of being updated. This will
 have direct impacts on the scale of the direct employment estimates identified for WSA

 • The land use plans that have informed the on-site business park employee estimates was developed in May 2015
 and has since been updated as part of the ongoing planning and design work for the Western Sydney Airport.
 Therefore the on-site business park employment results will be updated for the purposes of the Final EIS

 • The employment estimates have been prepared for the purposes of the draft EIS, and will be prepared in line with
 updated demand and land use forecasts for the purposes of the final EIS process

 • These numbers do not represent jobs which have been created in Western Sydney, but rather, these estimates
 represent the possible redistribution of existing employment to Western Sydney, which may be driven by the
 proposed WSA development. Therefore, the analysis assumes that no employment is created in NSW in the Project
 Case relative to the Base Case as a result of the WSA development. This is a standard assumption for economic
 analyses of transport infrastructure projects and we accept it is conservative.

 Western Sydney Unit 26
 Western Sydney Airport: Draft Economic Analysis
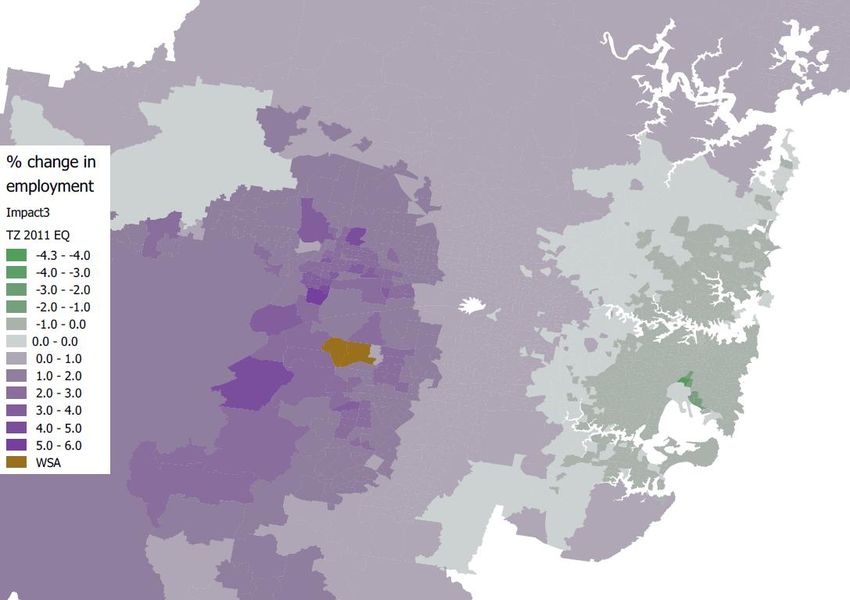
4. Land use econometric model
 WSA has the potential to impact jobs and population growth spatially throughout NSW, influencing where
 people will live and work. In particular, WSA is expected to significantly contribute to employment growth in
 and around the airport, which will provide improved job opportunities for residents in Western Sydney. In
 this way, WSA is a city-shaping investment that will contribute to a more balanced and sustainable growth
 for Sydney.

 This section considers the econometric land use analysis of the Sydney economy which was used to
 predict, at a high level, the change in population and employment density as a result of WSA.

4.1 Land use econometric model
 A project such as WSA has the potential to impact jobs and population growth in Sydney. In particular,
 WSA would be expected to redistribute population and employment towards Western Sydney, away from
 other parts of Sydney.

4.1.1 Accessibility and land use changes
 To capture changes in land use (i.e. employment and population distributions) in surrounding areas due to
 the implementation of WSA, a land use econometric model was developed. This model was designed to
 measure the change in population and employment density as a result of a change in accessibility – driven
 by the delivery of an airport and its surrounding infrastructure. This includes:
 Employment accessibility
 One of many drivers of people’s choice of where to live is the accessibility different locations provide to
 jobs and other attractions. WSA has the potential to improve accessibility to employment in Sydney’s west
 which would be expected to attract people into the area from outside.

 Population and firm accessibility
 Similarly, one of many drivers of firms’ location choice is the accessibility of different locations to workers
 and to other firms. WSA has the potential to improve accessibility for employers to both workers and other
 firms in Sydney’s west which would be expected to attract more employers into the area from outside.

 Airport
 Airports themselves, independent of accessibility, also have an impact on population and employment
 density. In the case of population density, people may consider the distance they live from an airport. This
 includes:

 • Effect of being within a ‘threshold’ distance whereby noise has an distinguishable negative impact

 • Effect of distance from an airport outside of the threshold

 Similarly, airports themselves also have an effect on where firms choose to locate. The effects on
 employment density include:

 • Effect of being within an immediate airport zone – employment density within the zones that an airport
 is located

 • Effect of distance from an airport

 i) within a ‘threshold’ distance (5km) which is attractive for firms in selected industries

 ii) the effect of distance outside of this threshold

 Western Sydney Unit 27
 Western Sydney Airport: Draft Economic Analysis
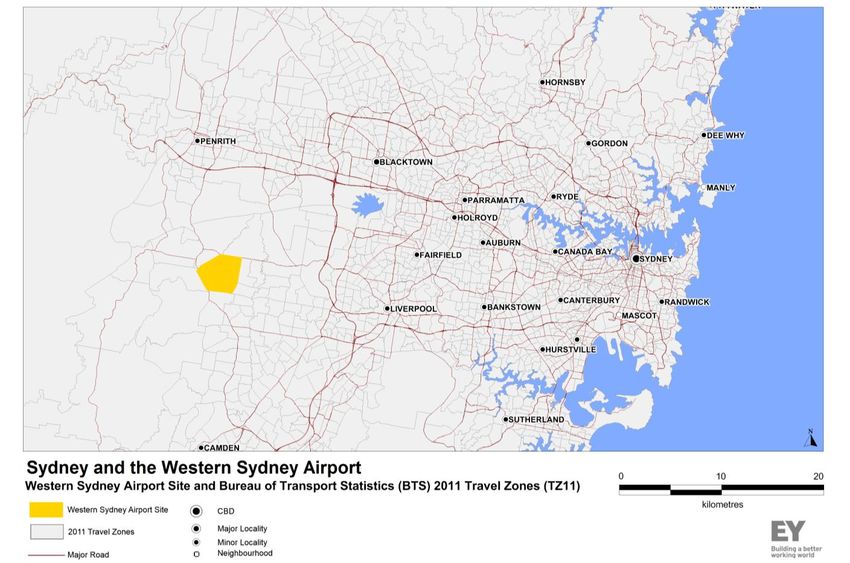
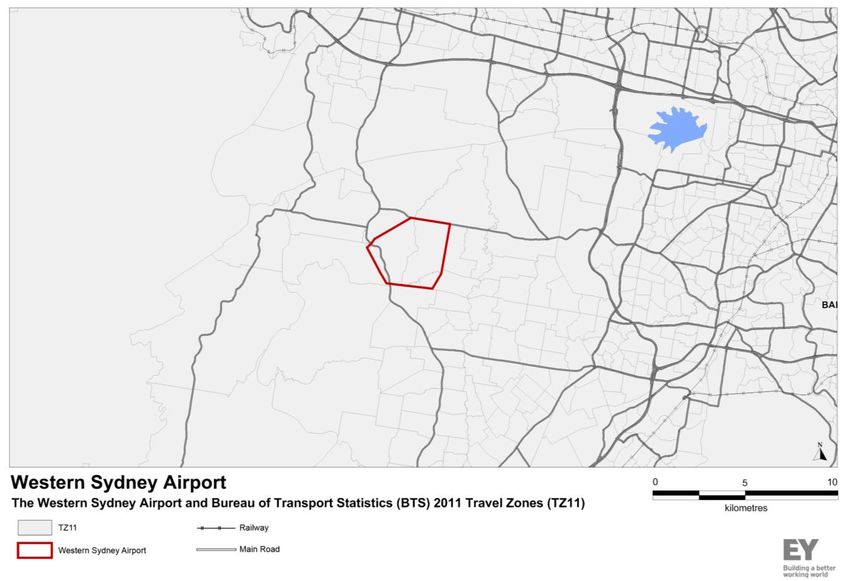
4.1.2 Land use model
 In order to measure the effect of accessibility on land use, both observed population and employment
 density is used in the econometric regression model. The model is therefore split into two parts:

 • Model 1: Population density

 • Model 2: Employment density

 Model 1 builds a causal relationship between observed population density and accessibility to jobs in each
 area of Sydney to estimate the extent to which accessibility drives residential density. It does this by
 isolating accessibility to jobs from a number of other factors, such as distance or accessibility to other
 attractions or the physical characteristics of the area.

 Model 2 builds a causal relationship between observed employment density and accessibility to population
 and other firms in each area of Sydney to estimate the extent to which accessibility drives employment
 density. It does this by isolating accessibility to people and firms from a number of other factors, such as
 proximity to other enabling pieces of infrastructure such as a port or an airport.

 Outputs from the population density model (Model 1) are used as an input for population accessibility in
 Model 2. In this way, Model 1 and Model 2 are iterative.

 Econometric techniques are used to correct for a number of confounding relationships that often prevents
 robust causal relationships from being identified. One such relationship is ‘reverse causality’. Reverse
 causality occur if we estimate the impact of accessibility on density and there is a simultaneous causal
 impact of density on accessibility – which would be the case if transport investment and services tend to be
 provided in locations where density is already high.

 The models developed for WSA explicitly account and correct for reverse causality using techniques that
 are discussed the methodology below.

4.2 Land use model methodology
4.2.1 Geography
 Data for density, accessibility and all of the other explanatory variables in the model was obtained for each
 TZ11 zone in the Sydney Greater Metropolitan Area (GMA). Figure 8 depicts the TZ11s zones and the WSA
 Airport site.

 Western Sydney Unit 28
 Western Sydney Airport: Draft Economic Analysis
Figure 8: TZ11s and the Western Sydney Airport9

Travel zones are defined by NSW Bureau of Transport Statistics

9
 Note that the site marked is not the same as the proposed airport site

Western Sydney Unit 29
Western Sydney Airport: Draft Economic Analysis
You can also read