Appendix A: Shared Electric Scooters in Santa Fe Best
←
→
Page content transcription
If your browser does not render page correctly, please read the page content below
Appendix A: Shared Electric
              Scooters in Santa Fe Best
Practices and Recommendations for the MPO
The past few years have seen an exponential rise in the number of shared electric scooters deployed
throughout the United States. From Los Angeles to Little Rock, more than 50 cities nationwide now have
fleets of at least 150 scooters; just three years ago, they were nonexistent. As the impressive rider
statistics—over 80 million trips in 2018 alone—continue to pile up, so do the concerns. Questions about
the safety, accessibility, and equity of micro-mobility services have led dozens of local governments to
take regulatory action, including some outright bans, on the industry, with at least 44 e-scooter bills
introduced thus far across 26 states. Beyond this reactionary legislation, the rapid influx of micro-mobility
devices nationwide is already influencing how many communities think about and address mobility; those
that have yet to experience e-scooters on their streets need to start having discussions on how to adapt
to this significant new trend in transportation, lest they risk falling behind and missing out on the
opportunities it presents. Santa Fe recently adopted a resolution directing the City Manager to explore
the suitability of a shared electric scooter program within the City. This paper has been prepared to
document key considerations regarding e-scooters and the lessons learned from programs in other cities
and provide a framework for the City to rollout a program of its own.

OPPORTUNITIES & POTENTIAL ISSUES
E-scooters and other micro-mobility devices offer a number of notable benefits that have gained them a
positive reputation among the general public—a 2018 survey covering 11 major U.S. cities found over
two-thirds of people support their adoption. The primary opportunities presented by e-scooters stem
from their potential to reduce personal motor vehicle trips and mitigate the associated environmental
and traffic-related concerns.
One of the most apparent benefits of e-scooters is their substantially smaller ecological footprint
compared to a personal motor vehicle. E-scooters require a fraction of the energy to operate and don’t
consume fossil fuels, so any motor vehicle trip replaced by a scooter trip is a net reduction in emissions.
Their overall impact on the environment, though, is dependent on the source of the electricity that
powers them.
A robust and well-utilized e-scooter program can also help to alleviate traffic congestion, particularly in
dense urban areas. Study of a 2018 pilot project in Portland, Oregon found that approximately half of all
e-scooter trips replaced a motor vehicle trip, contributing to a substantial reduction in the number of
vehicles on the road (over 700,000 e-scooter trips were taken over the three-month study period). When
such large numbers of motor vehicles are being replaced by much smaller e-scooters, there is a natural
freeing up of streetspace.
While most e-scooter trips are only a few miles at most in length, they can also help remove longer
personal motor vehicle trips from the road by providing better transit connections. The “first and last
mile” problem of covering the gap between a transit stop and an individual’s unique origin/destination
has been a challenging one to address for agencies throughout the world—e-scooters strategically
corralled along transit lines offer an easy and efficient means for making these connections.
While e-scooters present a major opportunity for enhancing local transportation networks, a number of
potential issues have also arisen as they have become more prevalent. Safety concerns, both for scooter
                                         Santa Fe MPO 2020–2045 Metropolitan Transportation Plan | A-1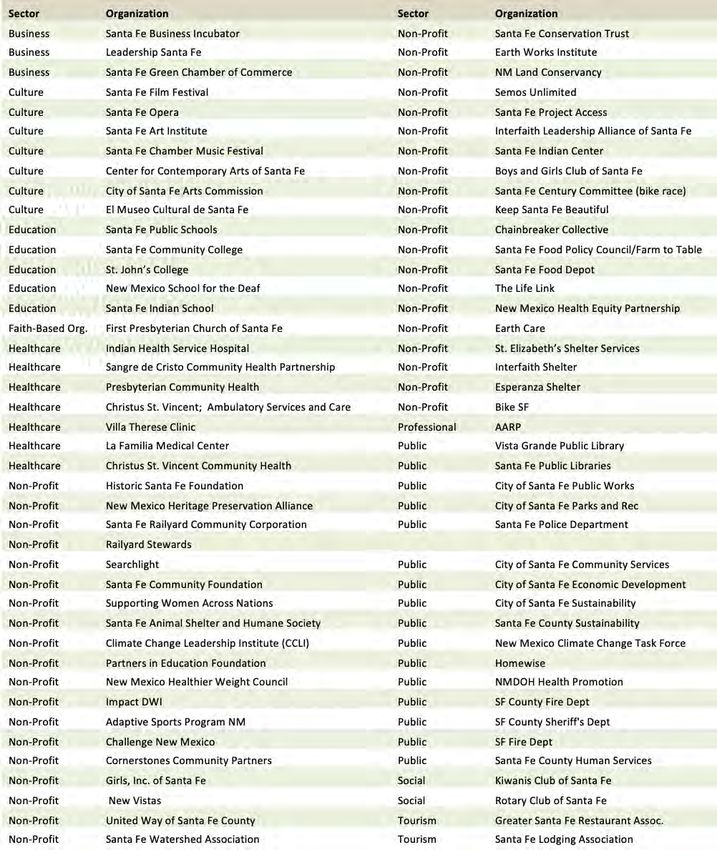
riders and for pedestrians, have been the main instigator behind a recent rush of regulatory action by
communities across the country. Over 1,500 scooter-related injuries have been reported since fall 2017,
with several fatal incidents capturing national media attention. While data on scooter crash rates and
causes have not yet been thoroughly studied, some risks are evident: inexperience with operating
e-scooters, lack of consistent riding etiquette, and conflicts with other modes. Helmet usage rates are
also very low. And when ridden and/or parked on sidewalks, e-scooters present a hazard to pedestrians
as well, particularly those with mobility impairments. Equity was another concern identified in the review
of Portland’s pilot study—historically disadvantaged portions of the city received a disproportionately low
share of the total deployed scooter fleet.
LESSONS LEARNED & BEST PRACTICES
The first shared e-scooter program was launched by Bird in Santa Monica, California in 2017. Dozens of
other communities have seen fleets deployed in the two years since, sometimes without any prior
notification by the private operators. This rapid proliferation has allowed for the development of a
substantive body of lessons learned and best practices as communities nationwide identify what does and
does not work about their e-scooter programs.
To date, Portland has conducted one of the nation’s most robust assessments of an e-scooter program.
E-scooters were allowed in the city for a 120-day pilot period in 2018, during which city staff collected
substantial amounts of data related to trip starts and ends, routes, usage by time-of-day, and safety.
Following the end of the study, the data were analyzed, and the findings compiled into a technical report
outlining lessons learned and recommendations for the future. Parameters of the regulatory framework
established for the pilot included:
A cap on the total number of scooters allowed from each private operator, with this number
gradually increasing throughout the pilot period
A requirement that each operator deploy 100 scooters every day in East Portland, a historically
disadvantaged neighborhood
Prohibition of riding e-scooters on sidewalks and park trails
Mandate for all private operators to develop rider education materials
The rollout also coincided with a major public outreach campaign involving distribution of flyers,
community events, and digital commenting tools. The collected data were supplemented by a user
survey, polling, focus groups, and community feedback. Over 700,000 scooters trips were taken during
the pilot, and the analysis concluded that e-scooters have the potential to advance Portland’s goal of
reducing personal motor vehicle usage. Several issues were also noted: sidewalk riding was a pervasive
problem, particularly on higher-speed streets with no dedicated bike facilities, and the private operators
did not fully comply with the city’s permit requirements relating to equitable distribution and deployment
locations. As a result of these findings, the city identified the need to conduct a second, longer pilot study
involving more robust permitting, monitoring, and evaluation processes. The new permit outlines specific
sets of evaluation criteria and incentives for each private operator.
Denver was one of the cities where private operators deployed scooter fleets without prior authorization
in 2018. In response, city staff worked quickly with other stakeholders to establish micro-mobility policies
and a one-year pilot program to study their suitability to Denver. The parameters of the pilot were mostly
similar to those from Portland, with fleet size restrictions, an incentive for deployment in disadvantaged
areas, and data collection requirements. One differing component was an initial rule that e-scooters be
relegated to sidewalks. Community feedback led the city to reverse this rule with a follow-up ordinance
requiring e-scooters to instead operate in the street. The city also prohibited scooter riding on the
16th Street Mall, a major pedestrian area, and some private operators have established geofences to
disable their scooters there. Pending a final report on the pilot, Denver Public Works is anticipating
implementation of a permanent micro-mobility program in fall 2019.
A-2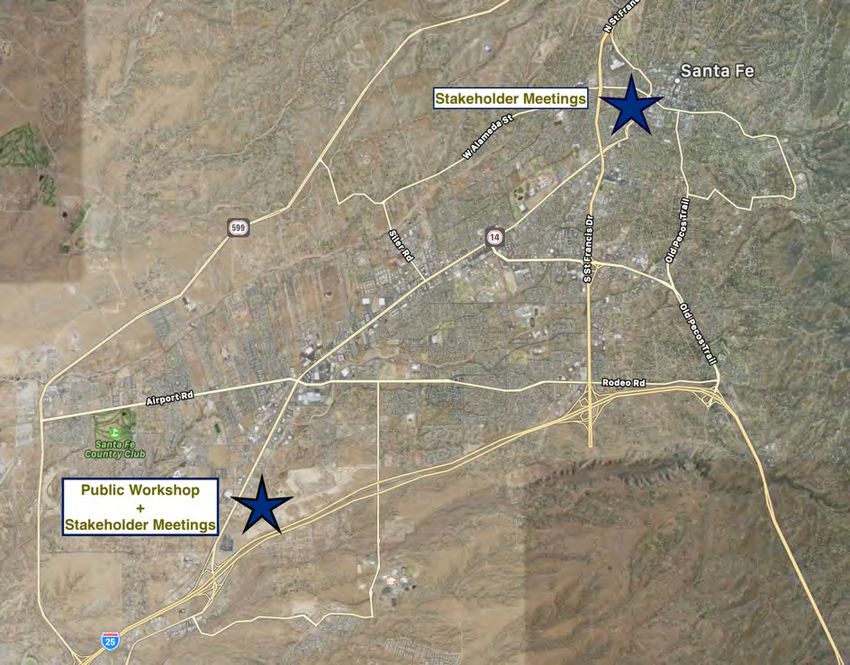
In response to the wave of communities that witnessed unauthorized deployment of e-scooters and the
disjointed collection of regulations, the Los Angeles Department of Transportation developed a digital
tool called the Mobility Data Specification (MDS) in 2018. Using location-based data, MDS allows cities
real-time access to an array of data about individual micro-mobility devices including location, route
history, and status; it has been hailed as a potentially powerful tool for informing transportation policy,
monitoring adherence to permitting requirements, and improving equitable fleet distribution. Since
LADOT developed this tool, it has expanded to dozens of other cities. Los Angeles also recently partnered
with 15 other major US cities to form the Open Mobility Foundation, a nonprofit focused on addressing a
number of urban transportation issues related to micro-mobility.
Albuquerque
In April 2019, Albuquerque established parameters for the first micro-mobility program in New Mexico—
a one-year pilot program allowing a maximum of 750 e-scooters to “better understand the impact of
e-scooters on our community and to protect the safety and well-being of Albuquerque residents and
visitors.” A permit application detailing the scope, stipulations, and data collection requirements of the
program was released for interested private operators to review and respond to. The relatively expensive
fee schedule, including a $12,000 permit fee, may have dissuaded the most well-known operators—Lime
and Bird—from pursuing a permit; Zagster was ultimately selected as the sole vendor for the program,
which officially launched on May 24th. Notable rules of the program for operators to follow include
establishing designated stations for e-scooter parking, a 15 mile per hour speed limit, an education
component to inform users about e-scooter regulations, and monthly reporting to the City on usage-
related data. Additionally, e-scooters are banned from the University of New Mexico campus. Through
the first three months of the pilot, over 40,000 trips have been logged on e-scooters in Albuquerque.
Planning Director Brennon Williams has said that the program is placing minimal burden on city staff since
the initial program development and negotiations with Zagster; no fines have yet been incurred by
Zagster for violating its agreement, and through July no scooter-related injuries had been reported. A
drop in usage was evident in July 2019, which may be partially attributable to excessive heat during that
month.
A FRAMEWORK FOR SANTA FE
In May 2019, the City of Santa Fe imposed a one-year moratorium on shared e-scooters to provide time
for an assessment of their suitability in the community and for the possible development of a pilot
program. While the potential benefits of micro-mobility are impressive, there are also a number of
related issues that must be considered and proactively addressed for a program to be effective. The pilot
efforts and subsequent findings in other cities provide a wealth of data and examples for the City to draw
on as it considers a program of its own. However, context is a key consideration as well—an effective pilot
program in Santa Fe will not necessarily look the same as one in Portland or Denver. This section provides
some considerations and recommendations related to a potential e-scooter program in Santa Fe.
Pilot Process
Given Portland’s decision to implement a second pilot program after the initial 120-day was deemed
insufficient, it would be prescient for the City to start with a one-year pilot—this would allow for the
collection of a robust amount of data and observation of seasonal trends in usage. Regarding data,
interested private operators should be required to provide at least the following information to the City
on a regular basis:
Trip origins, destinations, and routes Safety history
Average and maximum speeds Complaint history
Daily deployment locations Customer demographics
Santa Fe MPO 2020–2045 Metropolitan Transportation Plan | A-3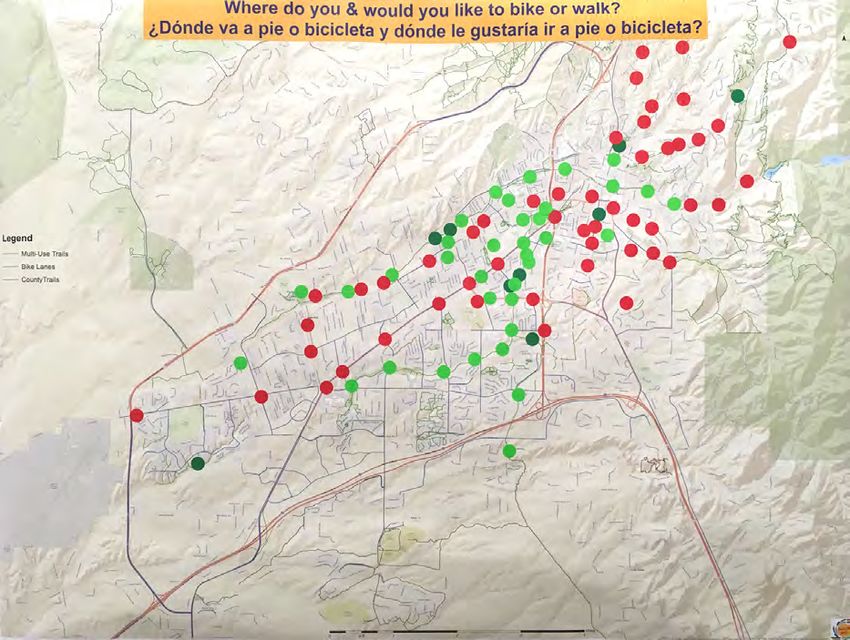
The MDS developed by LADOT provides more detailed data specifications that may be referenced as the
pilot is developed—the City may also consider involvement with the Open Mobility Foundation. Desired
fleet sizes will require additional conversations about the potential impacts, but a gradually increasing
maximum per operator is recommended to allow community members time to adapt to e-scooters. The
City may also want to identify priority areas in underserved neighborhoods and either mandate or
incentivize operators deploy a portion of their fleet in these areas.
The City should also partner with interested private operators in a public rollout at the onset of the pilot
to educate the community about e-scooters, covering topics such as why they are being introduced and
how they are to be ridden. Community meetings, flyers & signage, and social media could all be utilized.
Surveys periodically throughout the pilot would also be helpful in understanding how residents feel about
e-scooters once they are introduced and what they feel are the positive and negative elements of the
program. Topics to consider asking about include:
Opinions of e-scooters, both from users and observers
What mode a user would have chosen for their trip had an e-scooter not been available
Purpose of e-scooter trips (commuting, recreation, etc.)
When the pilot is complete, an in-depth analysis of all the collected data and feedback should be
conducted and summarized in a report that details the results and identifies next steps for e-scooters in
Santa Fe.
Permitting
The disorder and backlash seen after unauthorized e-scooter deployments in numerous cities highlights
the need for a formal micro-mobility permitting process. The permit should clearly lay out the
expectations of the program and requirements that each private operator must adhere to; a fine
schedule is recommended to reduce the risk of noncompliance. Items common in the permit applications
from other cities include:
Fleet size Safety reporting process
Parking and riding regulations Required device specifications
Data sharing Equity plan, including service to underserved areas,
accessibility for people with low-incomes and people
without smartphones, and translation services
Identifying an appropriate maximum fleet size will ensure the City is not overwhelmed with e-scooters at
the onset of the pilot program. Some cities have chosen to severely restrict the number of devices initially
introduced—Cedar Rapids, Iowa, a city of approximately 130,000 people, allows only 30 e-scooters—
while others have allowed several thousand. Albuquerque set a cap of 750 e-scooters for its one-year
pilot. Permitting only a few dozen e-scooters likely would not provide the City sufficient observational
data to understand their impact, but more than a few hundred would likely be excessive in a city of
85,000; somewhere between 150 and 250 e-scooters would be a sensible maximum fleet size for the City
to consider. Appropriate fees for operators will also need to be determined. Typical ranges from other
cities have been $100 - $300 for an application, $5,000 - $15,000 for a permit, and $30 - $80 for each
e-scooter deployed. Some cities also have a per-trip surcharge.
Language could also be included in a permit application to incentivize or mandate targeted deployment of
e-scooters in specific areas of Santa Fe. Other cities have taken this approach to ensure a portion of the
overall e-scooter fleet is provided to historically disadvantaged neighborhoods. In Portland, operators
were required to deploy at least 20% of their fleet in East Portland; a follow-up assessment found only of
the three permitted operators complied throughout the pilot, though the others were close to the 20%
mandate. Denver’s pilot program included an incentive for operators to increase their fleet size from 250
A-4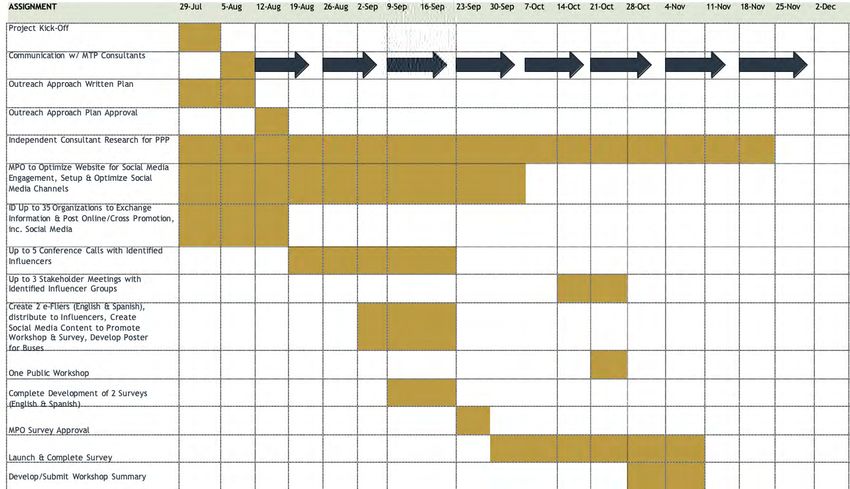
to 350 if they committed to keep at least 100 e-scooters within designated “opportunity areas” —
predominantly low-income and minority neighborhoods surrounding the downtown core. An interim
evaluation of Denver’s pilot project showed limited deployment in these “opportunity area,” with the vast
majority of e-scooters concentrated in the downtown core. Portland’s mandate was more successful than
Denver’s incentives in getting e-scooters to underserved areas and is the recommended priority
deployment model for Santa Fe; the Hopewell neighborhood southwest of downtown Santa Fe and
downtown itself are areas of the City that could be considered to apply it towards.

User Regulations
There is still no definitive answer among the transportation community as to whether e-scooters should
be ridden on sidewalks or on the street, though many cities are choosing to ban sidewalk riding. Denver
recently passed an ordinance giving e-scooters the same rights and regulations as bicycles. This would be
a fitting approach for Santa Fe, as it would prohibit sidewalk riding in the busy downtown core while also
allowing scooter riders to operate off-street in further-out parts of the City where comfortable on-street
bike facilities are lacking but adequate sidewalk infrastructure exists; where sidewalks are deficient or
nonexistent, fees collected from the private operators could potentially be used to help fund
improvements. The City’s extensive network of trails presents another opportunity for accommodating
e-scooters, as many of the trails have more-than-sufficient widths (10+ feet) for pedestrians, bicyclists,
and scooter riders to comfortably operate amongst each other.
The roadways throughout Santa Fe present varying levels of comfort for on-street scootering. The
differences between Cerillos Street and Agua Fria Street, two parallel roads running between the urban
core and the airport, are a good example of this—St. Francis is a busy, fast-moving arterial with no
dedicated bicycle facilities for a scooter rider to use, while Agua Fria is a calmer and slower street with
bike lanes. Just like is done for bicycling, the City could consider identifying a network of preferred routes
for scootering that, as much as possible, avoid arterials and their associated safety risks. In addition to
Agua Fria, Alameda Street and Galisteo Street are examples of roadways that would provide nice
on-street scootering connections from residential areas to destinations throughout Santa Fe.
The City could also consider identifying certain zones where e-scooters are banned entirely from
operating through the use of geo-fencing technology. In other cities, this has typically been done in
college campuses, pedestrian malls, and other areas with significant foot traffic—the busy Santa Fe Plaza
stands out as an area where e-scooter riding may be particularly dangerous for both the riders and
pedestrians. Geofencing has also been used to restrict operating speeds in certain areas—e-scooters are
permitted to go up to 15 miles per hour within Los Angeles city limits but are automatically slowed to
5 miles per hour when entering Beverly Hills, and e-scooters are slowed from 15 to 8 miles per hour when
entering the University of Texas campus in Austin.
In addition to clarifying where e-scooters can be ridden, clear parking guidelines/regulations are a critical
element of a potential pilot program. Stationary e-scooters left in pedestrian areas can block transit
stops, building accesses, and curb ramps. It is difficult to mandate that e-scooters be left in specified
parking zones given their dockless nature, but there are several strategies available to encourage
responsible parking behavior. Scooter corrals—paved areas marked as places to leave e-scooters and
other micro-mobility devices—have been implemented in numerous cities, typically near transit stops
and major destinations. Downtown, the New Mexico State Capitol complex, and Rail Runner stations
would be logical locations for corrals in Santa Fe. Geofencing technology can also be used to prohibit
people from leaving e-scooters in specific areas where they might be particularly hazardous to others.

                                         Santa Fe MPO 2020–2045 Metropolitan Transportation Plan | A-5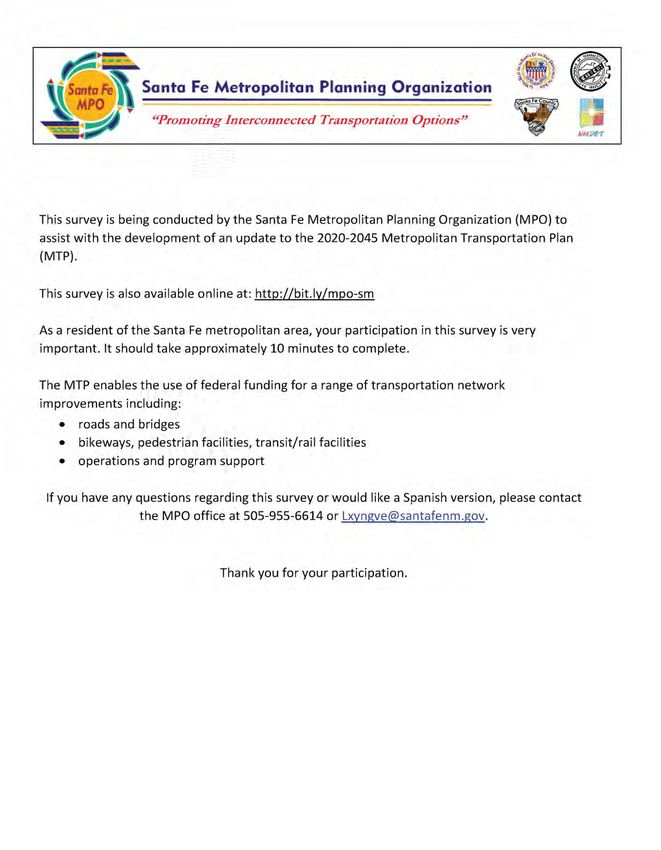
Appendix B: Public
                                                   Outreach Summary
Table of Contents
                                                                                                                                                      Page
Executive Summary ..................................................................................................................... 1
Targeted Outreach ...................................................................................................................... 2
   Planning for Public Participation ............................................................................................................... 3
   Outreach Deliverables............................................................................................................................... 3
   Outreach Distribution ............................................................................................................................... 4
   Public and Stakeholder Engagement ........................................................................................................ 7
   Public and Stakeholder Meeting Locations ............................................................................................... 8
   Stakeholder Identification ......................................................................................................................... 9
   Stakeholder List....................................................................................................................................... 10
Survey implementation ............................................................................................................. 11
   How Respondents Accessed the Survey.................................................................................................. 11
   Survey Demographics ............................................................................................................................. 12
Outreach Summary and Analysis................................................................................................ 17
   Stakeholder Meeting Input ..................................................................................................................... 18
   Public Open House Input ........................................................................................................................ 20
   Survey Results ......................................................................................................................................... 23
   Open-Ended Survey Response Summary ................................................................................................ 31

Attachments
Attachment A: Survey
Attachment B: Guiding Questions – Stakeholder Meetings
Attachment C: Open House – Written, Public Commentary

                                                               Santa Fe MPO 2020–2045 Metropolitan Transportation Plan | i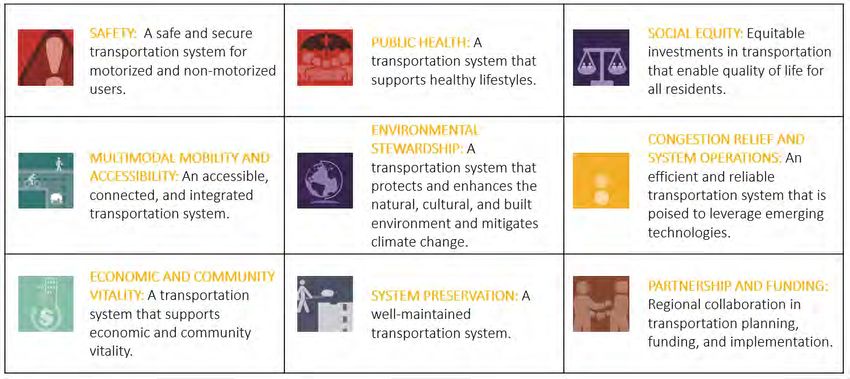
Executive Summary
On March 1, 2019, the Santa Fe Metropolitan Planning Organization (SFMPO) initiated steps to update
the 2015-2040 Metropolitan Transportation Plan (MTP). A major component of the MTP is the
development and implementation of a comprehensive public and stakeholder outreach program. The
outreach program was initiated on July 1, 2019, and during the course of five months, the SFMPO
conducted multiple individual stakeholder meetings, three strategic stakeholder meetings, a public open
house, and a comprehensive survey in English and Spanish, garnering 661 survey respondents.
In accordance with 23 CFR 450.316, a metropolitan planning organization is required to engage in a
metropolitan planning process that creates opportunities for public involvement, participation, and
consultation throughout the development of the Metropolitan Transportation Plan. Under this
requirement, SFMPOs must allow for:
       •   adequate public notice of public participation activities;
       •   review and comment at key decision points in the development of the MTP; and
       •   multiple, accessible participation formats, including electronic and in-person.
The SFMPO outreach team ensured that both grassroots communication and strategic online
communication were utilized to disseminate information about the community’s opportunity to
participate in the survey and public open house. Furthermore, the project team developed marketing
materials and advertisements in English and Spanish that were distributed on the SFMPO website, social
media channels, transit outlets, and in a number of public locations, as well as at the public open house.
Examples shown below.
Results from the stakeholder meetings, public open house, and survey are provided in the final section of
this document.

                                           Santa Fe MPO 2020–2045 Metropolitan Transportation Plan | 1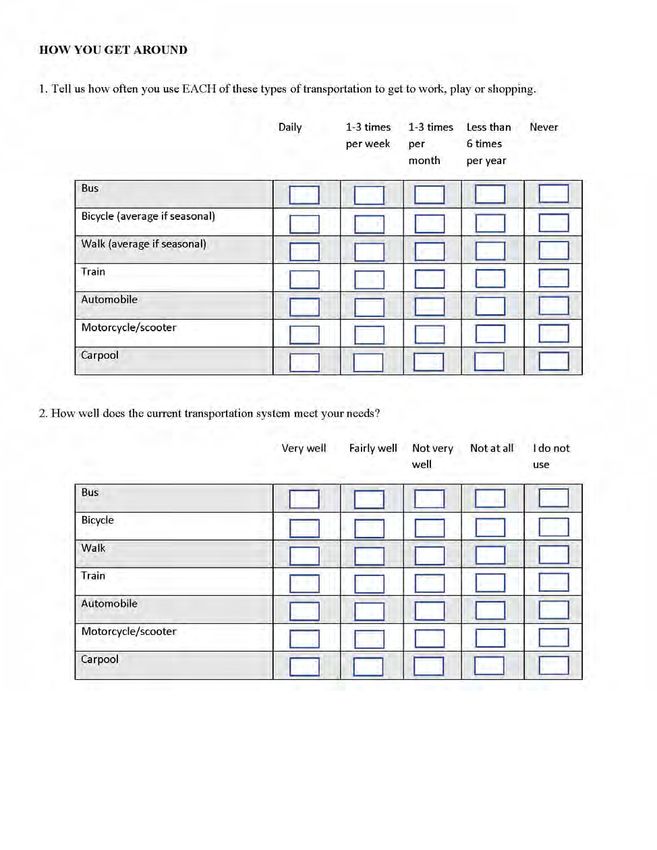
Targeted Outreach
Public and stakeholder outreach initiatives were planned in July 2019 and finalized in August 2019. The
plan began through an analysis of previous and identified outreach strategies to underserved
communities within the SFMPO planning area. Public engagement efforts met and surpassed the SFMPO
Public Participation Plan requirements provided on the following page.
Through the outreach planning process, the SFMPO and its consultant team, developed a Gantt chart to
identify each step within the outreach process. The Gantt chart is below.

2

Planning for Public Participation
                          Public Participation Plan: MTP Update Requirements

Plan Objectives:
       •   Be developed in consultation with all interested parties.
       •   Focus on environmental justice and equity, specifically engaging minority populations and
           low-income populations.
       •   Ensure that the planning process and planning work products employ innovative visualization
           and other public engagement techniques to the maximum extent practicable.
       •   Provide interested parties with ample opportunities to offer ideas, suggestions, and other
           input on both the planning process and the content of any planning products.
       •   A schedule for workshops and other meetings shall be developed in consultation with a team
           selected to support the process to give interested parties opportunities to provide input to
           the plan.
       •   Provide for consultation with Federal, State, and tribal wildlife, land management, and
           regulatory agencies regarding potential environmental mitigation activities and potential
           areas to carry out these activities, including activities that may have the greatest potential to
           restore and maintain the environmental functions affected by the plan.
       •   Provide for systematic documentation and archiving of any input received.
       •   Ensure that all public information is available in electronic, accessible formats and means, as
           appropriate, to afford reasonable opportunity for public consideration.
       •   Provide for holding all public meetings at convenient, accessible locations and times.

Outreach Deliverables
The SFMPO identified 10 key components for the outreach initiatives, which are outlined in the table
below.
                                              Deliverables
1      Project kick-off – Outlining of deliverables and metrics
2      Development of outreach approach
3      Independent research to identify important areas to conduct stakeholder and public meetings
       and identify locations to advertise the meetings and survey
4      Development of a website optimization plan for social medial engagement, along with
       advertisements and fliers
5      Identification of at least 35 organizations to exchange information and post online/cross
       pollinate MTP information
6      Conduct up to five conference calls with identified influencers such as restaurant and tourism
       associations and community groups
7      Conduct up to three stakeholder meetings with identified influencer groups
8      Conduct one public open house in an easily accessible area
9      Launch a comprehensive online and print survey in English and Spanish, while providing
       important communications throughout the SFMPO area to encourage participation.
10     Completion of a public and stakeholder outreach summary

                                           Santa Fe MPO 2020–2045 Metropolitan Transportation Plan | 3
Outreach Distribution
The strategic outreach plan for promotions and advertisements utilized diverse methods. A concerted
effort was made to leverage social media and grassroots promotion of the public open house and survey.
Online outreach included promotional postings on the SFMPO website and social media including
Facebook (SFMPO page, Santa Fe Bulletin Board, City of Santa Fe’s page, and Mayor Alan Webber’s page),
Instagram, LinkedIn, Twitter, Nextdoor (both citywide and for City of Santa Fe, District 3), Santa Fe County
Sustainability e-newsletter, and County Commissioner Anna Hansen’s e-newsletter.
The SFMPO office staffed various tables throughout the metropolitan area, including Southside Farmers
Market at Presbyterian Medical Center, Villa Theresa free clinic/SFPS Adelante, Southside Library, and
South Capital Rail Runner Station.
Print advertisements were used as well:
• Santa Fe Trails advertisements on the buses – English and Spanish
• Rail Runner advertisement on their screens
• Quarter page flyer drop on Rail Runner seats – English and Spanish
• Santa Fe Reporter
Print ad
Online/print calendar addition for the public meeting
• Santa Fe New Mexican
Print ad in the Sunday Paper
Online banner ad
• City of Santa Fe News Release
Flyers and surveys advertising the survey and public open house were distributed in English and Spanish
to the following locations:
• City Parking Customer Service Desk • La Familia (flyers only)
• City Water Office • Genoveva Chavez Center (flyers only)
• Southside Library • Schools (flyers only):
• La Farge Library El Camino Real Academy
• Southside WIC Clinic Ramirez Thomas Elementary
• Chainbreaker Collective Sweeney Elementary
• Sirius Cycles Nina Otero Elementary
• San Isidro Church Capital High
4Website Social Media Transit Posters / Advertisements
(Call-to-Action Banners and (18 Call-to-Action Content and Postcards
Dedicated Landing Page) Posts for Facebook and (Digital and Print)
Instagram)
The project team maintained consistency in branding and messaging throughout the process. Interactive
posters and guides were used to engage public open house participants.
Santa Fe MPO 2020–2045 Metropolitan Transportation Plan | 5Public Open House
(Interactive Posters and Open House Guide)
6Public and Stakeholder Engagement
The table below provides an overview of key stakeholder and public engagement activities.
Outreach Activity
Oct. 23 Stakeholder Meeting #1
9 a.m., Wednesday, October 23, 2019
Presbyterian Santa Fe Medical Center
4801 Beckner Road
Number of Stakeholders: 3
Oct. 23 Stakeholder Meeting #2
2 p.m., Wednesday, October 23, 2019
Presbyterian Santa Fe Medical Center
4801 Beckner Road
Number of Stakeholders: 5
Oct. 24 Stakeholder Meeting #3
10 a.m., Thursday, Oct. 24, 2019
SFMPO Office
500 Market Street, Suite 200
Number of Stakeholders: 12
Oct. 24 Public Open House
5:30 – 7:30 p.m., Thursday, Oct. 24, 2019
Presbyterian Santa Fe Medical Center
4801 Beckner Road
Number of Stakeholders: 14
Sept. – Nov. 10 Individual Stakeholder Meetings
Homewise, Chainbreaker Collective, Pueblo of Tesuque, NM Department of Health,
Restaurant/Lodging Associations, State Climate Change Task Force, State Elective
Vehicles, City ADA Coordinator, Christus St. Vincent Community Health, and Santa Fe
Prevention Alliance
Santa Fe MPO 2020–2045 Metropolitan Transportation Plan | 7Public and Stakeholder Meeting Locations The SFMPO held the three group stakeholder meetings and the public open house in accessible areas across the Santa Fe Metropolitan Planning Area as shown on the map below. 8
Stakeholder Identification
The project team created a stakeholder database
to identify public institutions, government
agencies, non-profit organizations, businesses, and
advocacy organizations that could be brought to
the table to provide input, and to distribute
information about the public open house and
survey to their networks. The assistance provided
by these organizations gave a necessary boost to
survey distribution and completion. A complete list
of entities in which the SFMPO reached out to is
provided on the following page.
Organizations that attended stakeholder meetings include:
       •   Individual meetings: Homewise,
           Chainbreaker, Pueblo of Tesuque,
           NMDOH, Restaurant/Lodging
           Associations, State Climate Change Task
           Force, State Electric Vehicles, City ADA
           Coordinator, Christus St. Vincent
           Community Health, Santa Fe Prevention
           Alliance
       •   Group meetings: Santa Fe Trails, SFPS
           Sustainability, County DWI, County
           Commissioners, County Community
           Services, County Sustainability, City of
           Santa Fe Economic Development, Villa
           Therese Free Clinic, Santa Fe
           Conservation Trust, City of Santa Fe
           Sustainability, St. Elizabeth’s Shelter,
           Falling Colors, City of Santa Fe Planning,
           Sierra Club

                                           Santa Fe MPO 2020–2045 Metropolitan Transportation Plan | 9
Stakeholder List Project information was distributed to the following organizations. 10
Survey implementation
The MTP public survey was open between
September 25, 2019, and November 21, 2019, in
English and Spanish. Hard copies of English and
Spanish surveys were available at the SFMPO
office, the City Water Office, the Southside and
La Farge Libraries, the Southside WIC Clinic,
Chainbreaker Collective, Sirius Cycles, and San
Isidro Church (Attachment A: Survey).

A total of 661 individuals participated in the
survey; 15 individuals submitted hard copies.

The online survey was advertised through the
SFMPO website, social media, and MPO
stakeholders. The MPO used unique stakeholder
sector bit.ly links to track how online survey
respondents accessed the survey based on the
link they used.

How Respondents Accessed the Survey
              Stakeholder Sectors                         Responses

Restaurant/Lodging Associations                        2.5%           16
Business                                               0.2%            1
Education                                              0.5%            3
Social Media and Print Advertisements                 74.1%           478
Public Sector/Government                              21.6%           139
Non-profit                                             1.2%            8

The survey also asked respondents how they heard about the survey. Several survey participants ended
the survey before reaching this question; the following chart reflects the 581 responses.

                                         Santa Fe MPO 2020–2045 Metropolitan Transportation Plan | 11
How Respondents Learned About the Survey
0.0% 5.0% 10.0% 15.0% 20.0% 25.0%
eMail/Listserv 23.8%
Nextdoor 18.8%
Facebook 16.2%
Local Organization or Agency 10.2%
Friend 9.8%
Word of mouth 7.4%
City, county or MPO website 6.9%
Print news 3.6%
Instagram 0.5%
Twitter 0.5%
LinkedIn 0.2%
Radio news 0.2%
Television news 0.0%
Other (please specify) 17.2%
Many survey respondents specifically described how they learned about the survey, including:
• Flyers dropped on the Rail Runner seats
• Advertisements on the Santa Fe Trails buses
• Their school or workplace
• Communication from elected officials and local stakeholders
• Flyers and posters in public places
Survey Demographics
The average survey participant may best be described as a white female between the ages of 50-69.
Although survey results indicate that approximately 65 percent of respondents are white and non-
Hispanic and that 18 percent are Hispanic or Latino, 74 survey respondents opted to not complete the
demographic portion of the survey. Demographic responses for gender, age, and race and ethnicity are
compared to City of Santa Fe demographics.
Gender
Answer Choices Survey Responses City of Santa Fe
Male 37.0% 213 47.6%
Female 57.5% 331 52.4%
I prefer not to answer 5.0% 29 -
Other (please tell us your preference) 0.6% 3 -
12Age
Answer Choices Survey Responses City of Santa Fe
Under 18 2.3% 13 22.0%
18-29 years old 5.6% 32 11.6%
30-39 years old 14.6% 84 12.9%
40-49 years old 13.2% 76 12.4%
50-59 years old 21.0% 121 13.8%
60-69 years old 25.7% 148 14.4%
70 years or older 13.7% 79 12.8%
I prefer not to answer 4.0% 23 -
Race and Ethnicity
Answer Choices Survey Responses City of Santa Fe
White, Non-Hispanic 65.4% 384 40.0%
Hispanic or Latino 19.3% 113 54.7%
Native American 2.2% 13 2.1%
Black or African American 0.7% 4 1.6%
Asian / Pacific Islander 1.0% 6 1.3%
I prefer not to answer 9.9% 58 -
Other (please specify) 1.5% 9 0.3%
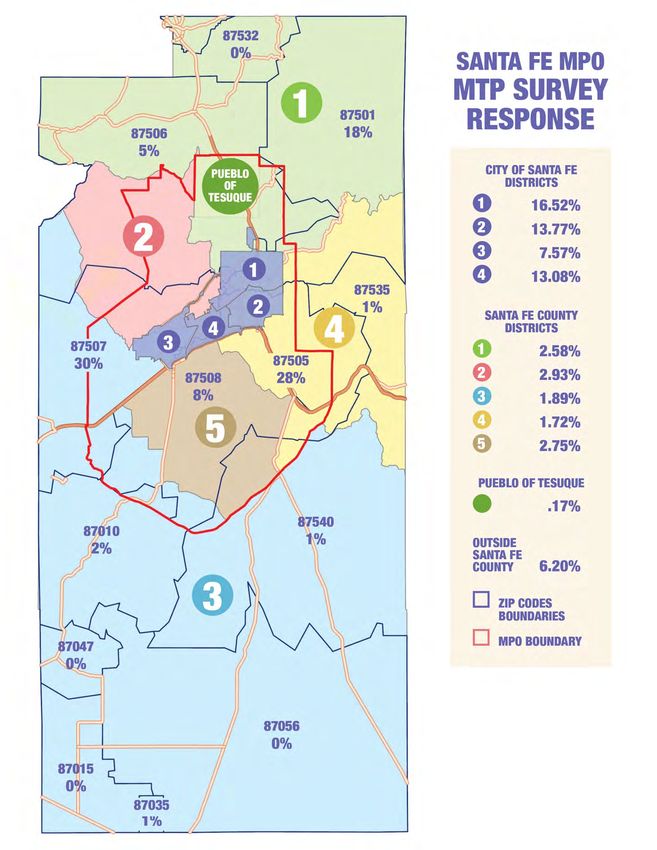
Santa Fe MPO 2020–2045 Metropolitan Transportation Plan | 13Respondents were asked in which city district and/or county district they reside. As predicted, many
(more than 30%) respondents did not know in which district they live. Therefore, we also asked in which
zip code they reside. Only three individuals stated that they did not know in which zip code they reside.
For those individuals who were able to identify their districts, an estimated 43 percent live in city districts
1, 2 and 4, as depicted in the chart, below.
District Responses
City of Santa Fe, District 1 17.9%
City of Santa Fe, District 2 14.8%
City of Santa Fe, District 3 8.4%
City of Santa Fe, District 4 13.8%
Santa Fe County, District 2 2.9%
Santa Fe County, District 3 2.4%
Santa Fe County, District 4 1.9%
Santa Fe County, District 5 3.1%
Pueblo of Tesuque 0.2%
Outside of Santa Fe County 6.4%
I do not know 25.6%
0.0% 5.0% 10.0% 15.0% 20.0% 25.0% 30.0%
14A majority of survey respondents live in the areas of 87501, 87505 and 87507, as shown in this chart.
Zip Code Responses
35%
30%
30%
28%
25%
20%
18%
15%
10%
8% 7%
5%
5%
2%
0% 0% 1% 1% 0% 1%
0%
87501 87505 87506 87507 87508 87010 87015 87532 87535 87540 87047 Other I do not
know
Six-point-two (6.2%) percent of respondents do not live in Santa Fe County, and the majority of
respondents live in the City of Santa Fe.
The Santa Fe Metropolitan Planning Area encompasses many overlapping geographic and political
boundaries. The map on the following page displays the boundaries with the MTP survey response.
Santa Fe MPO 2020–2045 Metropolitan Transportation Plan | 1516
Outreach Summary and Analysis
A primary purpose of the strategic outreach program was to accurately identify public perceptions and
needs related to the MTP goals. The nine goals and descriptions are provided below.

               Safety: A safe and secure                           Congestion Relief and System
               transportation system for                           Operations: An efficient and reliable
               motorized and non-motorized                         transportation system that is poised
               users.                                              to leverage emerging technologies.

               Public Health: A transportation
               system that supports healthy                        Economic and Community Vitality: A
               lifestyles.                                         transportation system that supports
                                                                   economic and community vitality.

               Social Equity: Equitable
               investments in transportation that                  System Preservation: A well-
               enable quality of life for all                      maintained transportation system.
               residents.

               Multimodal Mobility and                             Partnership and Funding: Regional
               Accessibility: An accessible,                       collaboration in transportation
               connected, and integrated                           planning, funding, and
               transportation system.                              implementation.

               Environmental Stewardship: A
               transportation system that
               protects and enhances the
               natural, cultural, and built
               environment and mitigates
               climate change.

                                          Santa Fe MPO 2020–2045 Metropolitan Transportation Plan | 17
This section is divided into three types of outreach: stakeholder meetings input, public open house input,
and survey input.
Stakeholder Meeting Input
This section is a summary of stakeholder perspectives from meeting transcripts and notes provided by the
stakeholders (Attachment B: Guiding Questions for Stakeholder Meetings).
Trends/Issues
• Incentives to use alternatives forms of transportation
• Engage institutions to help identify solutions
• More travel options needed in town for homeless
• Need more choices and options for public transportation
• Dependable, accessible transportation is not available for all.
• Greater availability of transit hours and stops
• Opportunity for on-demand service
• Contradicting policies (regarding transportation planning)
• Need more staff to drive city buses
• The stigma of public transportation
• Danger of riding bike
• Transportation flexibility for working parents
• The perception of bikes not being safe for children
• Urban sprawl
Where Should Funding Be Spent?
• Effective, efficient transportation
• Affordable housing
• On-demand transit system
• Public and private partnerships
• Pay increase for bus drivers
• Increase electric vehicles
• Invest in charging infrastructure
• Urban planning both mixed-use and green preservation
• Transform St. Michaels to a three-lane walkable or into Main Street
• Lending library with bikes for children
• Training for people who need help
• Connect all of Santa Fe with bikes
• More multimodal trails
18Takeaways
• Accessibility is a key to transportation service. Participants identified accessibility by the
number of stops, frequency of stops and location of stops by public transportation.
Accessibility also means infrastructure that allows for an ease of use of biking and walking and
the number of available parking spaces downtown.
• More transportation options need to be studied and considered.
• Transit system needs to increase either through on-demand services or additional stops and
frequency. Access to public transportation needs to be increased.
• Consideration of multi-modal trails
• Land use and transportation must go hand-in-hand.
• Participants recommended that the city and county consider the exploration of new
technologies that may improve public transportation and utilization.
• Improve or enhance the bikeway infrastructure to allow for ease of continuity.
• Enhanced coordination among existing resources and agencies – continued collaboration.
• Need public outreach education about existing transit availability and how to use it effectively.
• Need more free or discounted parking/shuttle services in downtown Santa Fe.
Analysis
Common themes emerged throughout each stakeholder meeting. A primary concern for business
owners, employees, and constituents alike, is that not all residents live near their places of employment;
therefore accessible and frequent public transportation is essential. Because the City of Santa Fe is a
tourism destination, many people are in the hospitality business. The tourism and lodging industries do
not operate on a traditional Monday through Friday, 8 a.m. to 5 p.m. workweek, so employees who do
not have dependable transportation cannot work the hours needed in this industry. Shift changes for
multiple restaurants and hotels occur at similar times, so there may be an opportunity to coordinate
transit service with these hours.
Some of the stakeholders were not at all familiar with the public transportation options, therefore
improved promotion for the services was recommended. Parking is a serious issue in downtown Santa Fe
for restaurant and lodging staff. A prevailing thought was that increased accessibility and frequency of
public transportation, combined with an increase in public transportation marketing, could provide great
benefit. In addition to expanding public transit, shuttles or additional parking spaces were recommended
for the downtown area.
There continues to be a concern among bikers with traveling along routes near busy interchanges and
roadways, such as Cerrillos Road. Furthermore, educators believe that young people should have
encouragement for bike utilization.
Goals of Primary Importance to Stakeholders
While Multimodal Mobility and Accessibility rose to the top of importance among the SFMPO goals, all
nine goals were identified at one level or another by stakeholders.
Santa Fe MPO 2020–2045 Metropolitan Transportation Plan | 19Public Open House Input
Information provided in this section is from written public commentary.
Trends/Issues
• Connectivity and safety for pedestrians, cyclists and transportation facilities
• Improved signal and traffic operations on major thoroughfares and highways
• Improved livability through better coordinated transportation and land use policies
• Big buses but small ridership due to lack of accessibility
• Funnel bikes directly to river path to keep bikes off road
• Need ways to entice people to walk, bike or use public transportation
• More connections for the train
• More promotion of the train/buses
• More trains southbound in the morning and northbound in the afternoon
• Additional, smaller zero emissions buses travelling more routes, more frequently
• Either make alternative modes of traffic easy and cheap or make auto traffic much worse and
expensive
• Alternative energy and better transit to get cars off the roads
• Encouragement to use pedestrian and bike for more trips
• More regulation/surveillance of industry and taxes on emissions
• Teach drivers best driving skill to save on vehicle expenses
• Climate change is an important issue for a majority of the public open house attendees.
Where Should Funding Be Spent?
A map was provided at the public open house so that
attendees could mark the areas in which funding
should be spent. Participants indicated that issues
need to be addressed along Agua Fria Street and in a
couple areas south of Cerrillos Road. Details are
provided in this image.
20Takeaways
• Roadway infrastructure is of key importance.
• Enhanced availability of public transportation during off-peak hours.
• Creation of ways to encourage people to walk, bike or use public transportation, more.
Analysis
As with the stakeholder groups, Multimodal Mobility and Accessibility emerged as key goals. The image
below captures more than 50 areas in which attendees currently walk/bike (green) or would like to bike
or walk (red).
Goals of Primary Importance to Stakeholders
Public open house participants were asked to rank the goals by importance from 1 to 9 with 1 being the
most important. The table on the following page summarizes their rankings. The most important goals
identified by the public open house participants are Social Equity, Multimodal Mobility and Accessibility,
and Congestion Relief. The numbers within the cells represent the number of people who selected and
identified a particular goal as being important followed by a weighted overall ranking. For example,
Multimodal Mobility and Accessibility was listed as the top goal by three people and has an overall
weighted score of 66.
Santa Fe MPO 2020–2045 Metropolitan Transportation Plan | 21Goal Identification by Public Open House Attendees
1 = Most Important 9 = Least Important
Goal 1 2 3 4 5 6 7 8 9 Score
Social Equity 1 4 1 3 1 1 73
Multimodal Mobility and
3 1 2 1 3 66
Accessibility
Congestion Relief and System
1 1 2 3 3 2 51
Operations
Safety 1 1 2 3 1 1 49
Economic and Community
2 1 1 2 1 1 44
Vitality
Partnership and Funding 2 2 4 2 1 35
Public Health 1 2 1 1 2 33
Environmental Stewardship 2 1 1 1 2 32
System Preservation 2 2 2 1 29
22Survey Results
Six-hundred and sixty-one (661) individuals answered at least one survey question and 581 completed the
survey. The following charts and graphs describe the survey responses.
Transportation Choices
Survey Question: Tell us how often you use EACH of these types of transportation to get to work, play or
shopping.
Automobile
Walk (average, if seasonal)
Bicycle (average, if seasonal)
Bus
Train
Carpool
Motorcycle/Scooter
0% 10% 20% 30% 40% 50% 60% 70% 80% 90% 100%
Daily 1-3 times per week 1-3 times per month Less than 6 times per year Never
Survey Question: How well does the current transportation system meet your needs?
Automobile
Walk
Bicycle
Train
Carpool
Bus
Motorcycle/Scooter
0% 10% 20% 30% 40% 50% 60% 70% 80% 90% 100%
Well Not Well I do not use
The above responses reveal that the automobile is the dominant form of transportation in Santa Fe and
the system performs well for automobiles. However, many people use forms of transportation other than
an automobile and are less satisfied with how well the system works for those modes.
As expected given the high level of satisfaction with automobile use, many of the challenges and
important issues identified in the following questions focus on multimodal options such as transit,
walking, and biking.
Santa Fe MPO 2020–2045 Metropolitan Transportation Plan | 23Survey Question: Which of the following barriers influence you the most when considering transportation
options? Check all that apply.
Public transportation schedules (bus and/or train) 60%
Safety 52%
Poor connectivity 47%
No (or not enough) sidewalks 44%
Lack of bike lanes and/or trails 43%
Crossing busy streets 37%
Pavement condition 36%
Cost of parking 33%
No public transportation (bus and/or train) 33%
Too much traffic 31%
Cost of public transportation (bus and/or train) 6%
None 5%
0% 10% 20% 30% 40% 50% 60% 70%
Survey Question: How important are these transportation improvements to you?
Traffic safety
Better road maintenance
Better/more sidewalks
Multi-use trails
More important
Reduce traffic congestion
Neutral
Bicycle lanes
Less important
Expand bus schedules
Expand train service
Expand bus routes
0% 20% 40% 60% 80% 100%
24Survey Question: If you had $5 million available to spend on the transportation network, where would
you spend it?
$0.58 , 12%
$0.41 , 8%
$1.58 , 31%
Transit
Bicycle/Pedestrian
Better Road Maintenance
$0.75 , 15% Reduce Traffic Congestion
Traffic Safety
$1.68 , 34%
Transit Satisfaction
A series of survey questions explored participant views and experiences with regional transit options.
Survey Question: Do you currently use one of these forms of public transportation?
Santa Fe Trails Bus System
Santa Fe Pick-UP
Rail Runner
NCRTD-blue bus
NMDOT Park&Ride
I do not use any of these
0% 5% 10% 15% 20% 25% 30% 35% 40% 45% 50%
Santa Fe MPO 2020–2045 Metropolitan Transportation Plan | 25Survey Question: Please describe your experience with regional transit systems. Please rate from 1=Poor
to 5=Excellent.
Good use of my money
Safe, comfortable, good amenities
I can trust it
Santa Fe Trails
Takes me where I want to go Rail Runner
NCRTD
Santa Fe Pick-Up
Good use of my time
Takes me when I want to go
Gives me freedom to change my plans
1 2 3 4 5
26Quality of Life
A series of questions solicited views on quality of life.
Survey Question: Would you consider yourself to be someone with special needs or disabilities, or do you
know someone with special needs or disabilities?
Yes
24%
No
76%
Participants that responded yes to the above question were asked: “How well does the transportation
network work for someone with special needs or disabilities?”
Automobile
Train
Carpool
Bus
Walk
Bicycle
0% 10% 20% 30% 40% 50% 60% 70% 80% 90% 100%
Well Not well Does not apply
Santa Fe MPO 2020–2045 Metropolitan Transportation Plan | 27Survey Question: How is your overall quality of life today?
0%
4%
Very good
39% Fairly good
Not very good
57%
Not good
Survey Question: Tell us which of the following contributes to your quality of life – your physical and
mental well being and enjoyment of the community you live in. Please rate from 1=Least Important to
5=Most Important.
Air quality
Safety
Ability to get around freely and easily
Access to necessary services and
resources
Noise pollution
Road/trail maintenance
Transparency in planning and
communications
Sidewalks
Multi-use trails
Bike lanes or trails
1 2 3 4 5
28Survey Question: Transportation is one of the leading contributors to greenhouse gases and climate
change. How concerned are you about climate change and the transportation choices available to you?
4%
7%
Very concerned
20% Fairly concerned
Not very concerned
69% Not concerned
Commuter Patterns
Survey Question: How far do you commute to your place of work or school?
Less than 1 mile
1-3 miles
4-6 miles
7-10 miles
11-15 miles
More than 15 miles
I work from home
Retired or not currently employed
0% 5% 10% 15% 20% 25% 30%
Santa Fe MPO 2020–2045 Metropolitan Transportation Plan | 29Respondents who responded that they commuted more than 15 miles were asked where they commute
to:
to Santa Fe
to Albuquerque
to Los Alamos
to Rio Rancho
to Espanola
to Las Vegas
Other (please specify)
0% 5% 10% 15% 20% 25% 30% 35% 40% 45% 50%
Communication Preferences
Survey Question: How do you prefer to receive information? Check all that apply.
eMail/Listserv
Mobile device
Print news
Online news feeds, i.e., CNN, Fox, etc.
Television news
Radio news
Facebook
Instagram
Twitter
Other (please specify)
LinkedIn
0% 10% 20% 30% 40% 50% 60%
30Survey Question: How do you utilize your smart phone/mobile device to aid your transportation choices?
Check all that apply.
Google or other Maps for Trip
Generation/Destinations
Purchase a Ticket - NM Rail Runner
Ride Share Apps – (Uber/Lyft)
I do not have/use mobile device
Find My Bus App – Santa Fe Trails
STRAVA – Bicycle/Run/Hike Tracking
Other (please specify)
ParkMobile App – City of Santa Fe Parking
Blue Bus Tracker – NCRTD
Rider Alerts - NMDOT Park&Ride
0% 10% 20% 30% 40% 50% 60% 70% 80%
Open-Ended Survey Response Summary
Many survey questions allowed a written open response and the final survey question gave survey
respondents an opportunity to share any additional comments. These open-ended responses can be
grouped into seven major areas of interest or concern as follows.
1. Rail Runner
Comments about the Rail Runner focused on the need for an expanded train schedule throughout the
day and on evenings and weekends and faster express service between Albuquerque and Santa Fe.
One respondent requested a pricing structure dedicated to locals, including a round-trip or day pass.
Another noted the need for working outlets for phone chargers at the stations. Several requested food
and beverage service/cart on the train.
2. Bus Routes and Stops
Respondents asked for more stops, citing long walks to their nearest stop; clear signage listing the bus
numbers that stop at a particular stop; and that trees near stops be trimmed. Another asked that more
trees be planted around bus stops. Safety was another concern, specifically the area along Cerrillos. One
respondent requested better lighting and shelters at bus stops.
The use of buses by minors for transportation to school was mentioned by several respondents, citing
concerns for safety and connections between routes. One respondent asked for bus bicycle racks that
accommodate wider bicycle tires, especially in winter. Another expressed concern for bus driver safety
and protection from harassment. Others requested an expanded schedule, including a night bus.
Santa Fe MPO 2020–2045 Metropolitan Transportation Plan | 313. Bicycles and Pedestrians
Bicycle and pedestrian lanes were requested for many areas of the city. Respondents cited concerns for
safety, traffic relief, and convenience of walkers, commuters and recreational bicyclists. Some requested
additional bicycle lanes on existing roads, while others requested multimodal lanes physically separate
from vehicular traffic. One respondent stated the ideas of many:
“Santa Fe needs more/better road maintenance and many more bike trails, particularly from the
southside into town.”
Respondents requested additional trails and bridges to connect more parts of the city.
Pedestrian concerns included safety, disrepair of sidewalks, weeds on medians, litter, and safe pedestrian
crosswalks, especially at busy intersections.
4. Safety
Safety was a major issue for many respondents. In addition to concerns about bicyclists and pedestrians
in heavy vehicular traffic, respondents had a varied list of safety concerns and possible solutions,
including:
• Reflective tape on poles in/near bike lanes
• Road repairs/improvements (Camino Tres Arroyos)
• Repairs to crumbling sidewalks
• Regular removal of goatheads (weeds) which can cause flat bicycle tires
• Homeless (pedestrian/bus rider concern at night)
Many respondents expressed concern about drivers being in such close proximity to pedestrians and
bicyclists and recommended:
• Stricter enforcement of speed limits
• Enforcement of hands-free device law for drivers (to increase attention to pedestrians and
bicyclists)
• Driver education campaigns
• Flashing yellow left turn lights
Many specific areas, roads, and intersections were identified by respondents as dangerous to people
walking, biking, and driving.
5. Accessibility
Accessibility and accommodations were requested for:
• Hearing-impaired
• Wheelchair access
• Senior citizens (need for accessible, safe transportation options)
• Minor children traveling alone (connecting bus routes)
• Language (Spanish, Native American, sign language interpreters/signage)
One respondent noted that some of the new curb cuts for wheelchairs are obstructed by telephone
poles.
32You can also read