Analysis and Evaluation of Ramp Metering: From Historical Evolution to the Application of New Algorithms and Engineering Principles - MDPI

Page created by John Mcdaniel
 
CONTINUE READING
Analysis and Evaluation of Ramp Metering: From Historical Evolution to the Application of New Algorithms and Engineering Principles - MDPI
sustainability

Review
Analysis and Evaluation of Ramp Metering: From Historical
Evolution to the Application of New Algorithms and
Engineering Principles
Salvatore Trubia 1 , Salvatore Curto 1 , Salvatore Barberi 1 , Alessandro Severino 2, * , Fabio Arena 1                                       and
Giovanni Pau 1

                                            1   Faculty of Engineering and Architecture, Kore University of Enna, 94100 Enna, Italy;
                                                salvatore.trubia@unikore.it (S.T.); salvatore.curto@unikorestudent.it (S.C.);
                                                ing.salvatorebarberi@gmail.com (S.B.); fabio.arena@unikore.it (F.A.); giovanni.pau@unikore.it (G.P.)
                                            2   Department of Civil Engineering and Architecture, University of Catania, 95123 Catania, Italy
                                            *   Correspondence: alessandro.severino@unict.it

                                            Abstract: In the modern era, characterized by intense urbanization and frequent travel between
                                            interconnected communities, the constant expansion of cities, associated with high densities and
                                            growing need for traveling, has led to a significant increase in road traffic volumes. More than ever,
                                            road traffic today requires effort to be managed effectively in order to improve performance and safety
                                            conditions, given the greater probability of unpleasant events such as accidents or road congestion
                                            with related delays and the increased stress levels of the user and infrastructure. Fortunately, there are
                                            already various engineering tools, such as ramp metering, that can be used for this purpose. Ramp
                                            metering allows for achieving the aforementioned desired benefits, including improving mobility,
                                            reliability, efficiency, and safety, and even reducing environmental impact. It also has been shown
         
                                     to be cost-effective from the existing literature. Further research will be necessary to strengthen the
                                            quality, efficacy, and efficiency of ramp metering, especially considering the fast-paced progress in
Citation: Trubia, S.; Curto, S.;
                                            technology (e.g., connected autonomous vehicles and drones used for surveys) and new challenging
Barberi, S.; Severino, A.; Arena, F.;
                                            scenarios (e.g., congested industrial areas and emergency vehicles). This review’s scope is to present
Pau, G. Analysis and Evaluation of
Ramp Metering: From Historical
                                            a general overview of principal ramp metering solutions, focusing on current research studies in the
Evolution to the Application of New         last couple of years and highlighting some of the main algorithms used for this purpose, depending
Algorithms and Engineering                  on diverse scenarios. With this article, the authors desire to present the subject of ramp metering,
Principles. Sustainability 2021, 13, 850.   providing a general overview of its story, evolution, and recent analytical models.
https://doi.org/10.3390/su13020850
                                            Keywords: freeway; ramp; traffic flow; traffic management; road safety
Received: 14 December 2020
Accepted: 9 January 2021
Published: 16 January 2021

                                            1. Introduction
Publisher’s Note: MDPI stays neutral
                                                  Vehicles attempting to access a busy freeway via an entry ramp might experience
with regard to jurisdictional claims in
                                            difficulty merging into traffic, struggling to find a gap between other drivers in the main-
published maps and institutional affil-
                                            stream due to intense traffic volumes. When this happens, vehicles tend to line up behind
iations.
                                            the stop line on the ramp, forming a queue and waiting until the first user in the queue
                                            can move forward and enter the freeway. Subsequent users may still have to wait on the
                                            stop line until they too find a gap to access. This circumstance is a cause of congestion
                                            with all the related consequences, such as delays, decreased driving comfort levels, and
Copyright: © 2021 by the authors.
                                            a higher risk of accidents. Ramp meters are traffic signals installed on freeway ramps to
Licensee MDPI, Basel, Switzerland.
                                            control the frequency at which vehicles enter the flow of traffic [1]. The primary approach
This article is an open access article
                                            today consists of a combined system of traffic lights (on-ramps) connected with traffic
distributed under the terms and
                                            sensors placed on the roadway (both on the freeway and the ramp) as showed in scheme in
conditions of the Creative Commons
                                            Figure 1. These traffic lights operate according to the intensity of the mainstream of traffic,
Attribution (CC BY) license (https://
creativecommons.org/licenses/by/
                                            signaling the ramp user when it is the right moment to enter the freeway. These specific
4.0/).
                                            traffic lights can be similar to standard ones (as in the Netherlands, where the background

Sustainability 2021, 13, 850. https://doi.org/10.3390/su13020850                                           https://www.mdpi.com/journal/sustainability
Analysis and Evaluation of Ramp Metering: From Historical Evolution to the Application of New Algorithms and Engineering Principles - MDPI
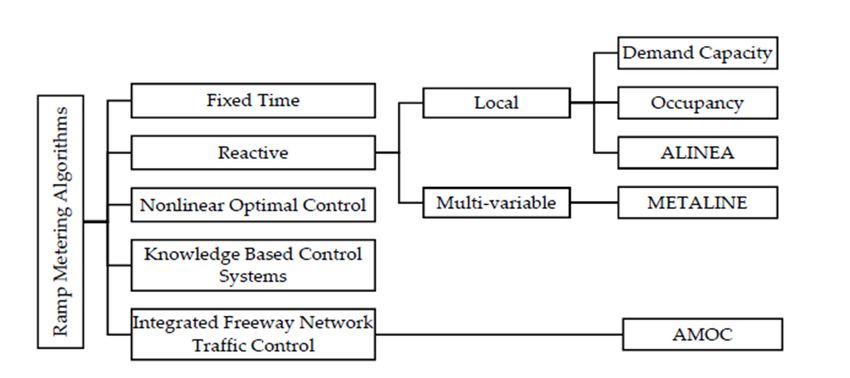
Sustainability 2021, 13, x FOR PEER REVIEW                                                                                                       2 of 20
 Sustainability 2021, 13, 850                                                                                                                     2 of 19

                                  specific traffic lights can be similar to standard ones (as in the Netherlands, where the
                                   color of lights
                                  background       is yellow
                                                color          instead
                                                       of lights         of black),
                                                                  is yellow         although
                                                                              instead         more
                                                                                      of black),      often more
                                                                                                 although   they will adopt
                                                                                                                  often theyexceptional
                                                                                                                             will adopt
                                   cases and   use  just red and    green   lights. When   amber    is used, its duration
                                  exceptional cases and use just red and green lights. When amber is used, its duration   after green
                                                                                                                                   afteris
                                   very brief, consisting   of  rapid  flashes  before transitioning   to red.
                                  green is very brief, consisting of rapid flashes before transitioning to red.

                            Figure
                             Figure1.1.Ramp
                                        Rampmetering
                                             meteringscheme
                                                      schemefor
                                                             foraageneric
                                                                   genericsite,
                                                                           site,Highway
                                                                                HighwayAgency,
                                                                                        Agency,UK
                                                                                               UK[2].
                                                                                                  [2].

                                           Rampmeter
                                         Ramp      metersystems
                                                             systemsare   areregulated
                                                                               regulatedby   bycontrol
                                                                                                controlalgorithms
                                                                                                          algorithmsusingusingtraffic-related
                                                                                                                                  traffic-relatedinput
                                                                                                                                                     input
                                   parameters,
                                  parameters, such such    as    traffic flow   density,   vehicle   speed,  travel  times,   and   crash
                                                                          flow density, vehicle speed, travel times, and crash and acci-   and   accident
                                   records
                                  dent         to name
                                          records   to name a few.     Many
                                                                    a few.      available
                                                                             Many            algorithms
                                                                                      available   algorithmshave   already
                                                                                                                 have   alreadybeen   described
                                                                                                                                   been   described in the
                                                                                                                                                        in
                                   literature,
                                  the            andand
                                       literature,     some  some willwill
                                                                        be described
                                                                             be describedin this
                                                                                               in paper.   The benefits
                                                                                                   this paper.             of ramp
                                                                                                                 The benefits      of metering
                                                                                                                                      ramp meteringconsist
                                   of a general
                                  consist          improvement
                                             of a general                of mobility,
                                                               improvement               reliability,
                                                                                    of mobility,      efficiency,efficiency,
                                                                                                    reliability,   and safety,and reducing
                                                                                                                                     safety,congestion
                                                                                                                                               reducing
                                  congestion (i.e., increasing traffic speed and volume) by breaking up the platoons ofoncars
                                   (i.e.,  increasing     traffic     speed    and    volume)    by   breaking    up   the  platoons     of  cars      on-
                                   ramps      and  reducing         demand.      Even    the  environmental       impact
                                  on on-ramps and reducing demand. Even the environmental impact is reduced; the Fed-        is reduced;     the  Federal
                                   Highway
                                  eral  Highway  Administration
                                                      Administration      of the
                                                                               of U.S.   Department
                                                                                   the U.S.   Department of Transportation
                                                                                                              of Transportation  reports,   for instance,
                                                                                                                                       reports,   for in-
                                   that   “Minneapolis        identified      a net   annual   savings   of  1160  tons
                                  stance, that “Minneapolis identified a net annual savings of 1160 tons of emissions”    of  emissions”     and “Other
                                                                                                                                                      and
                                   simulation
                                  “Other           analysis
                                             simulation           showsshows
                                                            analysis        ramprampmetering     to betoeffective
                                                                                          metering                  in reducing
                                                                                                          be effective   in reducing COCO emissions
                                                                                                                                              emissions by
                                   1195    t per year”   [1].    From    the  same    study,  in terms   of cost–benefit
                                  by 1195 tons per year” [1]. From the same study, in terms of cost–benefit analysis, “the   analysis,  “the   measured
                                   benefits ofbenefits
                                  measured        implementing           ramp metering
                                                             of implementing                  systems can
                                                                                       ramp metering          outweigh
                                                                                                          systems          the associated
                                                                                                                     can outweigh              costs by a
                                                                                                                                        the associated
                                   ratio   of 15 to  1, [ . . .   ] excellent   for  transportation     improvements”
                                  costs by a ratio of 15 to 1, […] excellent for transportation improvements” [1].           [1].
                                           Theprincipal
                                         The    principalthreatsthreatstotothe theadoption
                                                                                    adoption  of of  ramp
                                                                                                  ramp      metering
                                                                                                         metering    areare    usually
                                                                                                                           usually   of aoftechnical
                                                                                                                                              a technical
                                                                                                                                                       or
                                  financial nature, one being, for instance, the complexity of computer simulations andand
                                   or  financial   nature,      one    being,   for  instance,   the  complexity     of computer      simulations      al-
                                   algorithms and another being the required funding for application. Besides that, further
                                  gorithms and another being the required funding for application. Besides that, further
                                   constraints may also arise due to political and bureaucratic aspects. Gathering support
                                  constraints may also arise due to political and bureaucratic aspects. Gathering support
                                   from the public might constitute a challenge as well. This article aims to offer a general
                                  from the public might constitute a challenge as well. This article aims to offer a general
                                   overview of ramp metering, introducing its history briefly, describing the main engineering
                                  overview of ramp metering, introducing its history briefly, describing the main engineer-
                                   principles and algorithms, and proposing further considerations. The authors have selected
                                  ing principles and algorithms, and proposing further considerations. The authors have
                                   and cited several articles considered by them to be representative for covering the subject
                                  selected and cited several articles considered by them to be representative for covering
                                   on a general basis, focusing on research studies carried out over the last couple of years
                                  the subject on a general basis, focusing on research studies carried out over the last couple
                                   to describe some of the most recent algorithms and ramp metering models. Articles
                                  of years to describe some of the most recent algorithms and ramp metering models. Arti-
                                   were chosen to cover the main aspects of ramp metering, presenting different types of
                                  cles were chosen to cover the main aspects of ramp metering, presenting different types
                                   approaches (e.g., fixed time and local control), introducing some of the commonly used
                                  of approaches (e.g., fixed time and local control), introducing some of the commonly used
                                   computer algorithms (e.g., Asservissement Linéaire d’Entrée Autoroutière (ALINEA)) and
                                  computer algorithms (e.g., Asservissement Linéaire d’Entrée Autoroutière (ALINEA))
Analysis and Evaluation of Ramp Metering: From Historical Evolution to the Application of New Algorithms and Engineering Principles - MDPI
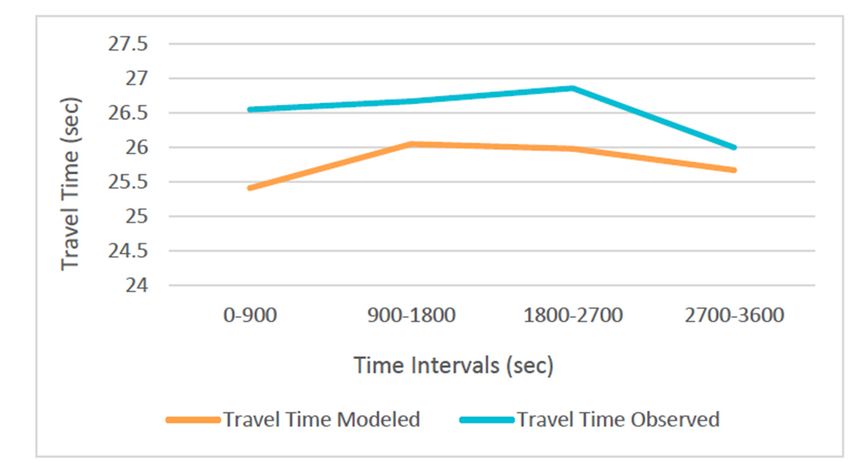
Sustainability 2021,13,
Sustainability2021,  13,850
                         x FOR PEER REVIEW                                                                                                   33of
                                                                                                                                               of19
                                                                                                                                                  20

                                  and software
                                  software   (e.g.,(e.g., VISSIM),
                                                    VISSIM),         reporting
                                                                reporting       traffic-related
                                                                           traffic-related       key performance
                                                                                            key performance           indicators
                                                                                                                 indicators      (KPIs)
                                                                                                                             (KPIs) for
                                  for comparison,     and   showing   how   ramp   metering   can  be applied    to different
                                  comparison, and showing how ramp metering can be applied to different scenarios (e.g.,      scenarios
                                  (e.g., geography,
                                  geography,    publicpublic   transport,
                                                        transport,         and automated
                                                                    and automated            vehicles).
                                                                                      vehicles).        Witharticle,
                                                                                                  With this   this article, the authors
                                                                                                                      the authors wish
                                  wish
                                  to     to contribute
                                     contribute   to ramp to ramp  metering
                                                              metering        by providing
                                                                        by providing          knowledge
                                                                                        knowledge     aboutabout    its general
                                                                                                             its general        aspects
                                                                                                                           aspects and
                                  and showing
                                  showing         the main
                                             the main         benefits
                                                        benefits       of ramp
                                                                  of ramp        metering,
                                                                            metering,       inhope
                                                                                       in the  the hope
                                                                                                    that that  it will
                                                                                                         it will  sparkspark
                                                                                                                         newnew   ideas
                                                                                                                              ideas for
                                  for future  research.
                                  future research.

                                  2.
                                  2. Background
                                        The first
                                               first form
                                                      form ofof ramp
                                                                ramp metering
                                                                       metering consisted
                                                                                   consisted of of aa police
                                                                                                       police officer
                                                                                                                officer manually
                                                                                                                        manually directing
                                                                                                                                     directing thethe
                                  traffic flow    from   a ramp   on the Eisenhower      Expressway       in  Chicago,
                                  traffic flow from a ramp on the Eisenhower Expressway in Chicago, and it was deployed  and   it was deployed     in
                                  the early   1960s.    Ramp    metering    then spread    on  an experimental       basis
                                  in the early 1960s. Ramp metering then spread on an experimental basis to other major      to other  major   cities
                                  in the in
                                  cities  United      StatesStates
                                             the United       (e.g., Detroit,  Los Angeles,
                                                                     (e.g., Detroit,            and Minneapolis–St.
                                                                                       Los Angeles,      and Minneapolis–St.   Paul)Paul)
                                                                                                                                      and became
                                                                                                                                             and be-
                                  more
                                  came andmoremore and tested    and advanced.
                                                         more tested   and advanced.It eventually      began
                                                                                           It eventually        to also
                                                                                                              began   to be
                                                                                                                         alsoadopted     in Europe
                                                                                                                                be adopted    in Eu-
                                  and
                                  ropeOceania.
                                         and Oceania. RampRampmetering   began
                                                                    metering     spreading
                                                                               began           in Europe
                                                                                        spreading             during
                                                                                                      in Europe        the 1980s,
                                                                                                                    during          when
                                                                                                                              the 1980s,     the UK
                                                                                                                                           when   the
                                  installed   it first on  the  M6  near Walsall  (later  updated)     in  1986.   The Netherlands
                                  UK installed it first on the M6 near Walsall (later updated) in 1986. The Netherlands in-             introduced
                                  ramp
                                  troducedmetering      in Amsterdam
                                               ramp metering               in 1989, and
                                                                   in Amsterdam            it then
                                                                                      in 1989,  andspread
                                                                                                       it thento   otherto
                                                                                                                spread     cities
                                                                                                                             otherlike  Rotterdam
                                                                                                                                    cities like Rot-
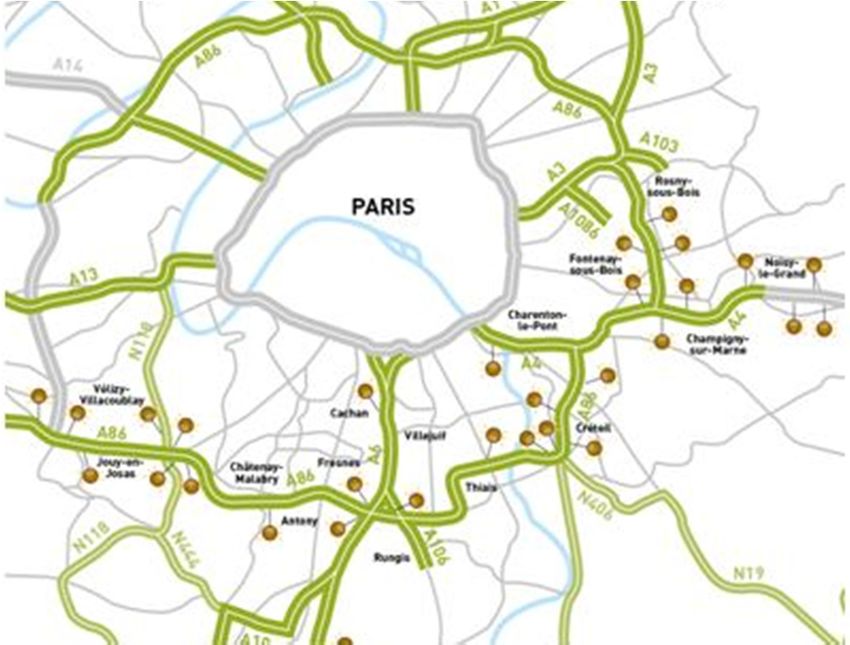
                                  and   Utrecht,     and  Paris  (Figure  2)  with more    recent   projects    like the
                                  terdam and Utrecht,and Paris (Figure 2) with more recent projects like the Praktijkproef Praktijkproef    Amster-
                                  dam   started     in 2013.   In Germany,    ramp    metering    can    be  found
                                  Amsterdam started in 2013. In Germany, ramp metering can be found on the Autobahn  on   the  Autobahn     around
                                  Hamburg,       Munich,     and  several   other areas   in  the Rhine-Ruhr        region.
                                  around Hamburg, Munich, and several other areas in the Rhine-Ruhr region. In Europe,        In  Europe,   interna-
                                  tional  researchresearch
                                  international        on the subject
                                                                 on thehas   been has
                                                                         subject   encouraged      in the lastin
                                                                                        been encouraged           two
                                                                                                                    thedecades,
                                                                                                                         last twowith     dedicated
                                                                                                                                    decades,    with
                                  funding
                                  dedicated funding for projects like the Network of Excellence for Advanced Road Traffic
                                             for   projects  like the Network    of  Excellence    for  Advanced      Road    Cooperative     Coop-
                                  Management
                                  erative TrafficinManagement
                                                         the Information     Society
                                                                        in the         (NEARCTIS)
                                                                                Information      Society  and  the European
                                                                                                             (NEARCTIS)        andRamp    Metering
                                                                                                                                    the European
                                  Project (EURAMP).
                                  Ramp Metering Project (EURAMP).

                                  Figure 2.
                                  Figure 2. Ramp
                                            Ramp metering
                                                 metering deployment
                                                          deployment on
                                                                     on Paris
                                                                        Paris peri-urban
                                                                              peri-urban motorways
                                                                                         motorways (AA2
                                                                                                   (AA2 Action,
                                                                                                        Action, France)
                                                                                                                France) [3].
                                                                                                                         [3].

                                           Australia, this
                                        In Australia,  this technology
                                                            technology is is widely
                                                                              widely used
                                                                                       used inin Melbourne.
                                                                                                  Melbourne. The The first
                                                                                                                       first form
                                                                                                                              form ofof similar
                                                                                                                                         similar
                                  traffic management
                                  traffic managementwas   wasdeployed
                                                               deployedinin1971,
                                                                               1971,evolving
                                                                                      evolving    into
                                                                                                into    more
                                                                                                      more      recent
                                                                                                            recent       solutions
                                                                                                                     solutions    likelike inte-
                                                                                                                                        integra-
                                  gration
                                  tion     with
                                        with the the  Sydney
                                                  Sydney       Coordination
                                                           Coordination         Adaptive
                                                                            Adaptive        Traffic
                                                                                        Traffic       System
                                                                                                 System        (SCATS)
                                                                                                           (SCATS)     [4].[4].
                                                                                                                             RampRamp    meter-
                                                                                                                                     metering
                                  ing eventually
                                  eventually        landed
                                               landed        in New
                                                        in New         Zealand
                                                                 Zealand    in theinearly
                                                                                     the early
                                                                                           1980s,1980s,
                                                                                                   beingbeing     gradually
                                                                                                           gradually            implemented
                                                                                                                         implemented       over
                                  over the years and representing the most extensive ramp metering system in the Southern
                                  the  years  and  representing     the  most  extensive    ramp    metering     system     in  the  Southern
                                  Hemisphere
                                  Hemisphere [5]. The  Theapplication
                                                            applicationofoframp
                                                                              ramp    metering
                                                                                    metering    to to  diverse
                                                                                                   diverse       cities
                                                                                                             cities  andand    countries
                                                                                                                           countries    has has
                                                                                                                                             sig-
                                  significantly  contributed
                                  nificantly contributed        to the
                                                            to the      evolution
                                                                    evolution       of this
                                                                                of this      technology,
                                                                                        technology,         as adaptation
                                                                                                        as adaptation          to the
                                                                                                                          to the        diverse
                                                                                                                                   diverse   city
                                  city layouts
                                  layouts  and and
                                                 roadroad   setups
                                                       setups  acrossacross  the globe
                                                                        the globe         is generally
                                                                                    is generally          necessary
                                                                                                    necessary           (the differences
                                                                                                                 (the differences            be-
                                                                                                                                       between
                                  tween
                                  AmericanAmerican    metropolises
                                              metropolises            and European
                                                              and European              cities,their
                                                                                cities, with     withdifferent
                                                                                                       their different    road systems
                                                                                                                 road systems               and
                                                                                                                                    and exten-
                                  extensions,  immediately
                                  sions, immediately      comecome   to mind).
                                                                 to mind).       Many
                                                                              Many      researchprojects
                                                                                      research      projectsrevolve
                                                                                                              revolve around
                                                                                                                         around elaborating
                                                                                                                                   elaborating
                                  and
                                  and improving algorithms, some of which will be reviewed in the followingchapters.
                                       improving    algorithms,   some   of  which   will  be reviewed    in  the  following     chapters.
                                        Despite the benefits of ramp metering, its diffusion is often hindered by various
                                  kinds of challenges. Agencies commonly complain about the lack of political and financial
Sustainability 2021, 13, 850                                                                                             4 of 19

                               support; the financial aspects include the costs for installation and maintenance, which
                               includes staff training. Moreover, funding requests might compete with other projects
                               having higher priority. Feasibility studies followed by cost–benefit analysis and perfor-
                               mance metrics can demonstrate these systems’ economic validity, proving the advantages
                               they can bring while reducing the expenses caused by their absence (e.g., costs related to
                               accidents and freeway queues). Other local agencies (including the public) might contend
                               the application of ramp metering due to a negative perception arising from a lack of both
                               technical knowledge and awareness of the benefits. Implementing communication plans
                               and information campaigns can be effective solutions, helping to gather consent and let the
                               public get familiar with ramp meters. The geometry of existing ramps, in many cases, is not
                               immediately compatible with ramp metering. It will not allow for easy installation, with
                               common problems being inadequate acceleration lengths, ramps being too short or too
                               close to each other, and visibility problems related to limited sight distances (vertical and
                               horizontal spotting sights). If funding for infrastructure improvement schemes is available,
                               this could represent an excellent opportunity to update the most strategically appropriate
                               ramps with refurbishment and modernization work. Where this is not possible—or can
                               be performed in conjunction—research for new solutions and technical approaches to be
                               implemented should be done.

                               3. General Technical Aspects
                                     The first ramp metering strategy consisted of a policeman directing traffic on a ramp
                               to a freeway. Nowadays, ramp metering commonly means a set of technological systems
                               that rely on electronics and are aimed to facilitate lane entries on freeways, optimizing
                               the timing between ramp users and freeway mainstream traffic. Some typical, essential
                               components constitute ramp metering systems, such as signal heads, detectors, and signage.
                               Signal heads are the heads of traffic lights with colored lights, and they can be two-section
                               or three-section signal heads, depending on the presence of the amber light. Detectors are
                               tools, usually sensors, aimed at monitoring vehicles’ positions and movements, detecting
                               the presence of a vehicle positioned at the stop line, and monitoring the queue length
                               on a ramp or the traffic flow of the mainstream. Road signage consists of road signs to
                               assist drivers in their operations. Signs may vary according to national regulations, but
                               the general good practice and logic behind them are to safely communicate information
                               and instructions to drivers soon enough to allow prompt reactions. In this case, road signs
                               should be placed at least at the beginning of the ramp and near the signal head, including
                               perhaps adaptive screens or warning lights.
                                     Furthermore, the three primary types of control strategies are fixed time, local control,
                               and system-wide control, and they are defined as follows:
                               •    Fixed Time: This is the easiest to be implemented, as it does not depend on traffic
                                    detection. On the other hand, due to its static nature, it is a relatively rigid approach
                                    and cannot adapt to real-time variations in traffic flow and roadway conditions;
                               •    Traffic Responsive: The control parameters are established in relation to the collected
                                    real-time data. However, such a method can occur only in specific time intervals
                                    during the day due to management or policy reasons;
                               •    Local Control: This approach considers the traffic flow intensity, thanks to the moni-
                                    toring sensors (which can be of various types) installed on the freeway and ramp. It
                                    focuses on a defined (local) area, and as it considers traffic variations, it can adjust and
                                    regulate itself, depending on the traffic flow, in real time. Its application is relatively
                                    simple, but it usually focuses on a ramp and its nearby area and ignores other nearby
                                    ramps’ influence;
                               •    System-Wide Control: This is similar to local control, but on a larger scale and for a
                                    broader system. If local control generally focuses on a ramp and its primary junction
                                    point on the freeway, system-wide control also takes into consideration adjacent
                                    ramps and a broader range of traffic flow across the freeway. The combined use of
                                    these two control methods allows, for instance, that if the system-wide control is
Sustainability 2021, 13, 850                                                                                                5 of 19

                                    offline or malfunctioning, it is possible to rely on local control as a backup measure.
                                    The advantage of this approach is that it is traffic responsive and can work toward
                                    freeway facility optimization. The disadvantage is that it can become very complex
                                    and expensive to implement and maintain as reported in Table 1 [6].

                                       Table 1. Comparison of control strategy types [6].

         Control Strategy                     Advantages                                      Disadvantages
            Fixed Time                   Easy implementation                 Difficult adaptations to unexpected traffic changes
           Local Control         Continuous monitoring, self-regulating                   Limits of a local approach
                                   Larger system application, traffic
       System-Wide Control                                                                       High costs
                                            responsiveness

                                      Modern systems rely on electronics and are fundamentally based on the interconnec-
                               tion between traffic lights installed on on-ramps and road sensors placed on on-ramps and
                               the freeway. This interaction is regulated through sophisticated algorithms that consider
                               the characteristic parameters of road transport, such as traffic intensity and vehicle speed.
                               These algorithms exploit the control theory, which will not be discussed in detail in this
                               paper. The best-fitting algorithm can be selected according to the outputs of computer-
                               based simulations and available data sets, wisely adapted to model and recreate a given
                               scenario. This approach can be time-consuming and possibly expensive. However, it is
                               relatively customizable and adaptable, and as technology becomes more refined by time
                               (e.g., machine learning), it gives them hope of getting more and more accurate results. As
                               one can imagine, these algorithms’ typical input parameters are road traffic-related and
                               typically include traffic volumes, vehicle speeds, travel times, crash and accident records,
                               and even roadway inventory, to name a few.
                                      Besides that, it is also understandable that the larger the database available, the better
                               the modeling and simulation results will be and, therefore, the more accurate the control
                               algorithms that will be selected. Volume data is collected in the form of video or loop
                               detection along the ramp and on the freeway mainline upstream and downstream of
                               the ramp. Furthermore, data analysis should be performed both before and after the
                               installation of ramp meters. In general, the classification of ramp metering strategies and
                               algorithms can be done according to several aspects: the extension of the interesting area
                               (i.e., number of operating lanes), the number of vehicles to pull onto the freeway for each
                               cycle, and the type of road connection (freeway-to-freeway). Ramp metering methods can
                               be classified into two primary categories: fixed time control and traffic flow responsive
                               control. Fixed time ramp metering methods consider historical traffic information to
                               determine the metering rates and establish the rates on a time-of-day basis [7]. These
                               methods seem to be more reliable in steady traffic flow conditions. Papageorgiou and
                               Kotsialos [8] provided a comprehensive classification for ramp metering methods, reported
                               below in Figure 3. ALINEA (Asservissement Linéaire d’Entrée Autoroutière), METALINE,
                               and AMOC (Advanced Motorway Optimal Control), as well as the others shown on the
                               chart below, are algorithms for determining metering rates.
                                      A comparative paper focusing on Australasia ramp meters was presented by Amini et al. [9],
                               considering state-of-the-art coordinated systems within a network-wide environment. The
                               paper offers many insights and an overview of some technical aspects, including a summary of
                               the foci of Ramp Metering evaluation studies and the relative algorithms in various world areas.
                               ALINEA (Asservissement Linéaire d’Entrée Autoroutière) is a local control type of algorithm,
                               probably one if not the most popular, being widely applied within ramp metering studies. We
                               suggest reading “ALINEA: A local feedback control law for on-ramp metering” [10], written by
                               M. Papageorgiou et al., to get an understanding of this system. In their work “A Ramp Metering
                               Method Based on Congestion Status in the Urban Freeway” [11], Zhi Liu et al. focused on the
                               concept of critical occupancy due to its difficulty to obtain and the low accuracy of the results.
                               Consider the scheme reported in Figure 4.
Sustainability 2021, 13, x FOR PEER REVIEW                                                                                             6 of 20
  Sustainability 2021, 13, 850                                                                                                            6 of 19
                                   Figure 3. Ramp metering algorithm classification proposed by Papageorgiou and Kotsialos [8].

                                         A comparative paper focusing on Australasia ramp meters was presented by Amini
                                   et al. [9], considering state-of-the-art coordinated systems within a network-wide environ-
                                   ment. The paper offers many insights and an overview of some technical aspects, includ-
                                   ing a summary of the foci of Ramp Metering evaluation studies and the relative algo-
                                   rithms in various world areas. ALINEA (Asservissement Linéaire d’Entrée Autoroutière)
                                   is a local control type of algorithm, probably one if not the most popular, being widely
                                   applied within ramp metering studies. We suggest reading “ALINEA: A local feedback
                                   control law for on-ramp metering” [10], written by M. Papageorgiou et al., to get an un-
                                   derstanding of this system. In their work “A Ramp Metering Method Based on Congestion
                                   Status in the Urban Freeway” [11], Zhi Liu et al. focused on the concept of critical occu-
                                   pancy due to its difficulty to obtain and the low accuracy of the results. Consider the
                                   scheme reported in Figure 4.

                                    Figure
                                  Figure    3. Ramp
                                         3. Ramp    metering
                                                  metering    algorithm
                                                           algorithm     classification
                                                                      classification    proposed
                                                                                      proposed byby Papageorgiou
                                                                                                  Papageorgiou   and
                                                                                                               and   Kotsialos
                                                                                                                   Kotsialos [8].[8].

                                        A comparative paper focusing on Australasia ramp meters was presented by Amini
                                  et al. [9], considering state-of-the-art coordinated systems within a network-wide environ-
                                  ment. The paper offers many insights and an overview of some technical aspects, includ-
                                  ing a summary of the foci of Ramp Metering evaluation studies and the relative algo-
                                  rithms in various world areas. ALINEA (Asservissement Linéaire d’Entrée Autoroutière)
                                  is a local control type of algorithm, probably one if not the most popular, being widely
                                  applied within ramp metering studies. We suggest reading “ALINEA: A local feedback
                                  control law for on-ramp metering” [10], written by M. Papageorgiou et al., to get an un-
                                  derstanding of this system. In their work “A Ramp Metering Method Based on Congestion
                                  Status in the Urban Freeway” [11], Zhi Liu et al. focused on the concept of critical occu-
                                  pancy due to its difficulty to obtain and the low accuracy of the results. Consider the
                                  scheme reported in Figure 4.

                                                         Schemeofofananon-ramp
                                              Figure4.4.Scheme
                                             Figure                     on-rampcontrol
                                                                                controllayout
                                                                                         layout[11].
                                                                                                 [11].

                                           As reported in [11], the control rate can be calculated normally with ALINEA through
                                         As reported in [11], the control rate can be calculated normally with ALINEA through
                                     Equation (1):
                                   Equation (1):                                                           
                                                                   R(k) = R(k − 1) + kr Ô − O(k − 1)                                 (1)
                                                                    ( ) = ( − 1) + [ − ( − 1)]                                      (1)
                                     where R(k) is the ramp metering rate related to the kth cycle; kr is the regulator parameter,
                                   where
                                     usuallyR(k) is the ramp
                                              determined     meteringtorate
                                                           according     empirical   to theÔkth
                                                                             relatedvalue;        cycle;
                                                                                              is the          is thedownstream
                                                                                                      occupancy      regulator parame-
                                                                                                                                from the
                                     flow–occupancy
                                   ter,                  chart, according
                                        usually determined      measured towhen   the flow
                                                                              empirical     is equalistothe
                                                                                          value;          theoccupancy
                                                                                                               capacity; and  O(k − 1) is
                                                                                                                          downstream
                                     the actual
                                   from           measured occupancy
                                          the flow–occupancy             value of the
                                                                 chart, measured      k −the
                                                                                   when    1thflow
                                                                                                cycleis detector.
                                                                                                        equal to the capacity; and O(k
                                   − 1) is the actual measured occupancy value of the k − 1th cycle algorithm
                                           The   authors  have  proposed   an updated    version   of  the  detector. and called it CS-
                                     ALINEA, which uses the traffic flow instead of the occupancy as the control parameter,
                                     while the control rate can be selected according to the congestion status and reclassified
                                     adaptively. This way, the control rate for Equation (2) will be

                                                                                                        ( L 0 − L1 )
                                                                                                                      
                                                           R0 (k) = R(k − 1) + K F q̂ − qeout (k − 1) +              λ                       (2)
                                             Figure 4. Scheme of an on-ramp control layout [11].
                                                                                                              µ

                                    where R’(k) is the control rate obtained with CS-ALINEA; L’ is the cumulative queue
                                         As reported
                                    length;    L1 is theincritical
                                                           [11], the control
                                                                   queue      rate can
                                                                          length;  KF isbethe
                                                                                            calculated
                                                                                               regulator normally   withq̂ ALINEA
                                                                                                           parameter;                through
                                                                                                                           is the mainstream’s
                                  Equation     (1):
                                    expected saturated flow; qeout (k − 1) is the flow from upstream the ramp to downstream
                                    in the k − 1 cycle; µ is the vehicle
                                                                       ( ) = headway
                                                                                ( − 1) +on the  [ − ramp( queuing;
                                                                                                            − 1)]     and λ is the number  (1)of
                                    lanes on the ramp.
                                  where R(k)This is the ramp
                                                  study         metering
                                                         also adopted   therate related to
                                                                             segmented        the kth
                                                                                           control     cycle; to consider
                                                                                                     method       is the regulator   parame-
                                                                                                                            the impact of ramp
                                  ter,overflow
                                        usuallyon  determined     according   to  empirical    value;      is the occupancy     downstream
                                                     ground road traffic, adjusting the signal timing scheme by selecting the control
                                  from
                                    ratetheto flow–occupancy
                                              avoid ramp overflow. chart,Ramp
                                                                         measured     when
                                                                                 control  wasthe    flow is equal
                                                                                                 simulated    with to
                                                                                                                   thethe
                                                                                                                       SUMOcapacity; and O(kof
                                                                                                                                 (Simulation
                                  − 1)  is the  actual measured     occupancy    value   of  the  k − 1th cycle detector.
                                    Urban Mobility) platform, which allowed for obtaining an intermodal traffic model of all
                                    vehicles and pedestrians, in addition to other tools for emission estimation, which was also
Sustainability 2021, 13, 850                                                                                              7 of 19

                                    used here to test the algorithm. The adopted car-following model was the intelligent driver
                                    model, and the selected parameters were among those types of road transportation, such
                                    as speed, acceleration, minimum distance, response time, and vehicle length. The results
                                    confirmed that this method can optimize the ramp queuing length and reduce vehicle
                                    waiting times, still guaranteeing the urban freeway’s efficiency. The results are reported
                                    below in Table 2, where it is possible to see that the mainstream’s travel time was reduced
                                    with the algorithm’s implementation, corresponding to an increase in ramp waiting time
                                    and average queue length, as well as improved mainstream average traffic throughout.

                                        Table 2. Four indicators at different control schemes [11].

                                                                                                         Mainstream Average
                               Mainstream Travel                                        Average Queue
      Controllers                                      Ramp Waiting Time (s)                             Traffic Throughout
                                   Time (s)                                               Length (m)
                                                                                                                (veh/h)
   No-signal control                 68.32                         0                            0                315
    Fixed timing                     57.88                       33.61                        8.97               432
      ALINEA                         56.36                       35.31                        9.24               434
     Q-learning                      53.25                       32.67                        8.61               436
    CS-ALINEA                        58.91                       27.79                        7.36               429

                                          The ramp waiting time and average queue length values for the no-signal scenario
                                    were 0 because vehicles, in this case, had no restrictions for entering the ramp; therefore,
                                    they merged in the mainstream without any waiting time and without forming queues on
                                    the ramp. At first glance, the fact that there were no queues and the waiting time was null
                                    on the ramp might induce one to think of a better mainstream. However, it must be noted
                                    how the related mainstream travel time was visibly higher, and the mainstream average
                                    traffic throughout was higher than in other scenarios, showing that the mainstream traffic
                                    performance was improved with the application of the chosen algorithms.
                                          Dadashzadeh and Ergun [12] have studied the combination of ALINEA with another
                                    merging congestion strategy: variable speed limits (VSLs). They analyzed the case of
                                    high volumes of bus transportation on the Istanbul Metrobus lane through a microscopic
                                    simulation with VISSIM and its vehicle actuated programming (VAP) feature called VisVAP.
                                    VISSIM is a widely used piece of simulation software oriented toward modelling and
                                    making forecasts on road traffic and studying ramp metering. Compared with the existing
                                    VSL+ALINEA model, this method offers improved average delays of mixed traffic and
                                    buses, fuel consumption, emissions, and average speeds, in addition to boosting bottlenecks.
                                    For instance, analysis of the results highlighted that the application of this algorithm
                                    produced a reduction of the total travel time, an increase in bottleneck throughput, and
                                    a decrease of average vehicle delays and some stops. Detailed tables with performance
                                    results are available for the study, with an excerpt of these results reported below in
                                    Tables 3 and 4, where it is also interesting to note how ramp metering brought benefits
                                    under the environmental aspect, helping by reducing polluting emissions.
                                          Indeed, although algorithms are a useful tool to facilitate the computational process,
                                    the implementation of road infrastructures often requires a study in the design phase
                                    that gives higher certainties on future impacts. In this regard, simulation software like
                                    VISSIM is helpful to carry out forecasting processes. Another exciting example of VISSIM
                                    application is the research study carried out by Mitkas and Politis [13].
Sustainability 2021, 13, 850                                                                                                             8 of 19

                                 Table 3. Average vehicle delays and stops across the examined scenarios [12].

                                                                                       Number of          Number of              Number of
      Scenario           Average Delay          Average Delay     Average Delay
                                                                                         Stops              Stops                  Stops
                         (All Vehicles)              (Car)         (Metrobus)         (All Vehicles)            (Car)            (Metrobus)
    No Control                   172                  174               96               31,479              30,727                 123
     ALINEA                      100                  102               51               21,417              20,997                  50
  t-test (p-value)             0.05394              0.06043          0.02918            0.648249             0.57029              0.00348
        VSL                       98                   99               39               15,813              15,360                  84
  t-test (p-value)             0.00085              0.00087          0.01634            0.009676             0.01038              0.04530
  VSL + ALINEA                    80                   81               48               18,980              18,536                  79
  t-test (p-value)             0.00865              0.00945          0.00220            0.549214             0.50991              0.00086
       VSL +
                                 57                   58                9                15,485              15,274                  6
    ALINEA/B
  t-test (p-value)             0.00186              0.00212          0.00004            0.211368             0.16400              0.00007

                                         Table 4. Fuel consumption and emissions across the examined scenarios [12].

                                                                                          FUEL
                                                Scenarios        LOS           VEHS                     CO              NOX          VOC
                                                                                         CONS.
                                                No Control      LOS F       5509.00        3770        69,613           13,544       16,133
                                                 ALINEA         LOS D       5759.00        2319        42,822            8332         9925
                                                   VSL          LOS D       5692.00        2140        39,511            7687         9157
                                              VSL + ALINEA      LOD D       5741.00        1902        35,114            6832         8138
                                             VSL + ALINEA/B     LOS C       5904.20         415        29,024            5647         6726

                                               The environment of analysis was a complex interchange at the Thessaloniki Ring
                                         Road in Greece. The authors surveyed traffic volumes via a drone (DJI Phantom 4) and
                                         then developed a model with VISSIM, analyzing several different scenarios including an
                                         increase of traffic volumes with and without ramp metering (i.e., traffic signals (fixed time
                                         and vehicle actuated). These were modeled thanks to VISSIM, as mentioned above, with
                                         an add-on called VisVAP. This procedure eventually led to the production of a flowchart,
                                         which was then used to program and activate the ramp’s signal light. Finally, the results
                                         produced from the scenarios were examined, and the KPIs (chosen to assess performance)
                                         were collected for a general evaluation, proving that ramp metering effectively brought to
                                         road traffic the many benefits reviewed so far in this article. The examined KPIs were the
                                         total travel time, average vehicle speed in entrance, average vehicle speed in exit, and level
                                         of service. A comparison between the selected KPIs led to these conclusions:
                                         •     The total travel time, measured in seconds, was longer after the traffic volume was
                                               increased (as expected) and then reduced once ramp metering was implemented;
                                         •     The average vehicle speed in entrance did not show relevant differences, due to this
                                               speed being measured before the ramp–freeway merging point from vehicles affected
                                               only by the mainstream;
                                         •     The average vehicle speed in exit showed a significant reduction in correspondence
                                               with traffic incrementation across the various scenarios. The difference between the
                                               exit and entrance speeds was reduced by a significant estimate of 35%, due to vehicles
                                               merging from the ramp into the mainstream and to a steeper road slope. When the
                                               presence of ramp metering was considered, the average vehicle speed in exit was
                                               higher, but still significantly lower (by about 30%) when compared with the average
                                               speed in entrance;
                                         •     The levels of service obtained from the simulation were A, B, C, and E, depending on
                                               the scenario. In particular, for one of the scenarios where the obtained level was E, the
                                               authors decided to drop it to F because the network was completely saturated, and
                                               eventually a large amount of entering vehicles could not complete their travel. (In fact,
                                               it seems that this collapsing network behavior could actually be seen for all the KPIs)
                                               The implementation of ramp metering again brought improvements to the network.
•     The levels of service obtained from the simulation were A, B, C, and E, depending on
                                     the scenario. In particular, for one of the scenarios where the obtained level was E,
                                     the authors decided to drop it to F because the network was completely saturated,
                                     and eventually a large amount of entering vehicles could not complete their travel.
Sustainability 2021, 13, 850         (In fact, it seems that this collapsing network behavior could actually be seen for9all
                                                                                                                          of 19
                                     the KPIs) The implementation of ramp metering again brought improvements to the
                                     network.
                                   It is interesting to see that the model was evaluated for accuracy by comparing the
                                      It is interesting to see that the model was evaluated for accuracy by comparing the
                               simulated
                                 simulated traffic with
                                              traffic    thethe
                                                      with    actual measured
                                                                 actual        data,
                                                                        measured     using
                                                                                 data,     a particular
                                                                                       using            statistical
                                                                                             a particular           index
                                                                                                           statistical     called
                                                                                                                       index called
                               GEH  (from    the initials of its inventor, Geoffrey E. Havers), used  in the traffic industry
                                 GEH (from the initials of its inventor, Geoffrey E. Havers), used in the traffic industry     to to
                               compare   two   sets of traffic load:
                                 compare two sets of traffic load:

                                                                                        2( − ) 2
                                                                                     s
                                                                            =            2( M − C )                                   (3)
                                                                         GEH =               +                                           (3)
                                                                                            M+C
                               where M is the modeled hourly traffic volumes and C is the measured hourly traffic vol-
                                 where M is the modeled hourly traffic volumes and C is the measured hourly traffic
                               umes.
                                  volumes.
                                     If more  than
                                        If more     85%
                                                 than     of the
                                                        85%       GEH
                                                              of the  GEHis less thanthan
                                                                              is less   5, then the simulation
                                                                                             5, then              was correct.
                                                                                                     the simulation             The val-
                                                                                                                        was correct.   The
                               uesvalues
                                    of theofGEH
                                              the obtained   in this in
                                                   GEH obtained      study
                                                                         thisranged     betweenbetween
                                                                               study ranged       0.050 and   0.872,
                                                                                                           0.050   anddepending  on the
                                                                                                                        0.872, depending
                               analyzed    road axis.road
                                  on the analyzed      Therefore,   the simulation
                                                            axis. Therefore,            could be considered
                                                                                  the simulation                 accurate. The
                                                                                                   could be considered          authors
                                                                                                                            accurate.  The
                               also  compared     the  measured    and    modeled     travel  times (from   10  simulation
                                  authors also compared the measured and modeled travel times (from 10 simulation            runs) forruns)
                                                                                                                                        a
                               predetermined       distance,  finding    that   the  deviation   was   less  than   5%  and,
                                  for a predetermined distance, finding that the deviation was less than 5% and, therefore,   therefore,
                               demonstrated
                                  demonstratedtheirtheirmodel’s
                                                         model’sreliability.     This situation
                                                                   reliability. This    situationhas
                                                                                                   hasalso
                                                                                                        also  been
                                                                                                           been      graphically
                                                                                                                  graphically     repre-
                                                                                                                              represented
                               sented
                                  in theinchart
                                           the chart  reported
                                                reported         in Figure
                                                           in Figure          5 below.
                                                                       5 below.

                               Figure 5. Deviation between the modeled and measured travel times [13].
                                 Figure 5. Deviation between the modeled and measured travel times [13].

                                    In In
                                       conclusion,  it was
                                          conclusion,       proven
                                                       it was proven once again
                                                                       once     how
                                                                            again   thethe
                                                                                  how    deployment
                                                                                           deploymentof of
                                                                                                        ramp
                                                                                                           rampmetering had
                                                                                                                 metering had
                               positive
                                 positiveeffects onon
                                            effects road  traffic
                                                       road       conditions.
                                                            traffic           Oskarbski
                                                                    conditions. Oskarbskiand Zarski
                                                                                           and      [14]
                                                                                               Zarski    also
                                                                                                      [14]     used
                                                                                                            also    VISSIM;
                                                                                                                 used VISSIM;
                                   their work was aimed to assess the impact of intelligent transport systems (ITSs) like ramp
                                   meters on the road networks adjacent to freeways and motorways, concerning traffic safety
                                   and efficiency, through the use of macroscopic, mesoscopic, and microscopic models and
                                   with the comparison of several related KPIs. The adopted simulation models and software
                                   were VISUM for the macroscopic level (to gather data related to traffic distribution), Saturn
                                   for the mesoscopic level, and VISSIM for the microscopic level (these last two were used to
                                   perform detailed analysis). It is interesting to note that ALINEA was the algorithm used to
                                   model the ramp metering system with a Python script.
                                         This study also considered different scenarios, according to the presence or absence of
                                   ramp metering in the simulation, and the case of a variable speed limit and the presence
                                   of road accidents. The selected KPIs were travel time reliability (average delays/vehicle),
                                   the smoothness of traffic flow in the road network, travel time reliability on the significant
                                   road, and efficient traffic control. The analytical results demonstrated that the deployment
                                   of ramp meters had a more significant impact in the case of high traffic volumes (above
                                   1700 veh/h/lane) and performed well if associated with other ITSs for average traffic
                                   (around 1010 veh/h/lane). In the case of low traffic volumes, other ITSs may be more
                                   suitable. Another example of VISSIM utilization can be found in a research study produced
Sustainability 2021, 13, 850                                                                                                    10 of 19

                                     by Abu-Bakr et al. [15], who evaluated the effects of ramp metering on three critical
                                     on-ramp sites in an urban expressway in the Greater Cairo region (GCR).
                                          The model was calibrated with data collected during peak periods, and three strategies
                                     were considered: fixed time, actuated control, and no control at all. The parameters used
                                     for calibration included maximum decelerations, minimum headways, and the safety
                                     distance reduction factor. Occupancy rates, obtained from installed sensors on both the
                                     mainstream and the on-ramps in correspondence with the upstream and merging points,
                                     were used as parameters when performing the actual control scenario design. Specifically,
                                     the adopted parameters for this scenario were the cycle update, mainline critical occupancy,
                                     and on-ramp critical occupancy. The chosen KPIs for comparison were the average speed,
                                     average vehicle delay, and on-ramp queue length. The GEH index was calculated, and
                                     since all its values in this study were lower than 5, the simulation could be considered
                                     correct, and the model, therefore, resulted in being well-calibrated and reliable. As could
                                     be expected, the implementation of ramp metering brought benefits to the simulated traffic
                                     flow, improving safety and efficiency conditions, with a visible increase of system speeds
                                     and a reduction of vehicle delays. As an example of the obtained findings, Table 5 below
                                     reports the performance results for the actuated signal strategy applied to one of the three
                                     analyzed sites (site n.2, the Abdel-Monem Riyadh on-ramp).

                                Table 5. Performance results for the fixed signal timing scenario at site-2 [15].

                                                                              Mainline            Mainline Down
                                                     Vehicle Delay                                                  Onramp Queue
    Control Logic              Speed (km/h)                                Upstream Speed         Stream Speed
                                                       (sec/veh)                                                     Length (m)
                                                                               (km/h)                 (km/h)
     No control                    8.2                    113.4                   6.5                     9.1           200.0
    Control logic-1                10.3                    101                    8.8                    12.1           129.9
    Control logic-2                 9.9                   102.1                   8.7                    12.9           122.1
    Control logic-3                 9.9                   101.9                   8.7                    11.4           117.2

                                           Several other authors have researched other different strategies. The model developed
                                     by Yu Han et al. [16] operated on two levels of control. An upper level was designed with
                                     a model predictive control (MPC) approach and considered the total traffic flow entering
                                     the freeway network via ramps in order to optimize the total network travel time. The
                                     lower level was instead designed to distribute the optimal total inflow to each ramp of
                                     the freeway, according to the feedback of local traffic conditions. The MPC approach has
                                     become more refined across the last few decades and includes a prediction model that can
                                     forecast the evolution of traffic dynamics and estimate the optimal control scheme for a
                                     specific given period. A well-conducted predictive analysis allows for making cost-effective
                                     decisions. Hence, at the upper level, the total traffic flow from ramps to the freeway is
                                     optimized through the MPC model, and traffic accessing a stretch of freeway is forecasted
                                     via a proposed macroscopic fundamental diagram (MFD) model. In contrast, the optimal
                                     total inflow is re-distributed to ramps at the lower level, according to the received feedback
                                     on local traffic. This control method was also tested with different models, such as CTM
                                     (cell transmission model) and METANET, and compared with other similar approaches. Its
                                     results have been shown to achieve desirable performance in reducing vehicles’ overall
                                     times. The authors also presented two case studies, the first where an extended CTM was
                                     used as the process model and the second using METANET instead. An extract of the
                                     obtained results is reported below in Table 6.
optimal total inflow is re-distributed to ramps at the lower level, according to the received
                                 feedback on local traffic. This control method was also tested with different models, such
                                 as CTM (cell transmission model) and METANET, and compared with other similar ap-
                                 proaches. Its results have been shown to achieve desirable performance in reducing vehi-
Sustainability 2021, 13, 850     cles’ overall times. The authors also presented two case studies, the first where an   11 ofex-
                                                                                                                              19

                                 tended CTM was used as the process model and the second using METANET instead. An
                                 extract of the obtained results is reported below in Table 6.
                      Table 6. An example of the performance values obtained with several control scenarios [16].
                      Table 6. An example of the performance values obtained with several control scenarios [16].
                               Total Time Spent (TTS) Considers Both the Freeway and All On-Ramps
                               Total Time Spent (TTS) Considers Both the Freeway and All On-Ramps
         Scenario
           Scenario              Without
                                   Without Control
                                              Control       System
                                                         System      Optimal
                                                                  Optimal                MFD-Based
                                                                                    MFD-Based               Extended
                                                                                                           Extended     CTM-Based
                                                                                                                      CTM-Based
   TTS
 TTS    (mainstream
      (mainstream       +
                     + onramp)   4341.2 (4263.3 + 77.8) 4143.5 (4020 + 123.5)   4163.7 (4018.4 + 145.3)    4619.2 (4012.7 + 606.5)
                               4341.2 (4263.3 + 77.8)     4143.5 (4020 + 123.5)    4163.7 (4018.4 + 145.3)   4619.2 (4012.7 + 606.5)
         onramp)
      Improvements     (%)                  0                    4.6                      4.1                        −6.4
   Improvements
 Computation   time(%)(s/control         0                         4.6                        4.1                     −6.4
   Computation     time                     -                   246.3                     3.0                        22.1
             step)                       -                        246.3                       3.0                     22.1
     (s/control step)
                                       A METANET-based macroscopic traffic model was also adopted by Wang and Niu
                                       A aMETANET-based
                                 [17] as   forecasting model,macroscopic
                                                                along withtraffic model was also
                                                                            microsimulation        adopted
                                                                                               tests         by Wang
                                                                                                     performed   with and  Niu [17]
                                                                                                                       VISSIM   and
                                 as a forecasting
                                 Visual           model,
                                         C++ for the       along with
                                                     evaluation    and microsimulation  tests performed
                                                                       comparison of different            with
                                                                                                 scenarios,     VISSIM and
                                                                                                             considering     Visual
                                                                                                                           both iso-
                                 C++ for
                                 lated  andthe evaluation
                                            integrated      and
                                                        cases  forcomparison  of different
                                                                   ramp metering           scenarios,
                                                                                   and a variable      considering
                                                                                                   speed  limit (VSL).both
                                                                                                                       Theisolated
                                                                                                                            study’s
                                 and was
                                 site  integrated  casesoffor
                                           the section     an ramp
                                                              urbanmetering     and a variable
                                                                      corridor named   Whitemud  speed  limit
                                                                                                     Drive     (VSL).inThe
                                                                                                            (WMD)           study’s
                                                                                                                        Edmonton,
                                 site was  the section of  an urban  corridor  named   Whitemud      Drive  (WMD)
                                 Canada (Figure 6). The microsimulation setup flowchart is also reported below in   in  Edmonton,
                                 Canada7.(Figure 6). The microsimulation setup flowchart is also reported below in Figure 7.
                                 Figure

                                 Figure 6. Layout of the study corridor (Whitemud Drive, Edmonton, Canada) [17].

                                     The authors examined the problem of bottlenecks arising during peak periods, caused
                                 by excessive demand from both ramps and mainstream traffic, and reported three main
                                 conclusions:
                                 •    A proactive use of ramp metering and VSLs significantly improves freeway mobility;
                                 •    The control performances between ramp metering and VSLs within the same demand
                                      scenario are different, suggesting that ramp metering may help alleviate the congestion
                                      caused by on-ramp flows, whereas VSLs fit better when controlling the mainstream
                                      traffic flow, bringing a greater level of benefit in this case;
                                 •    In the case of the integrated use of ramp metering and VSLs, the former reacts first,
                                      and the latter takes control as the demand grows. The two control systems work
                                      together during the highest congestion level, and ramp metering is deactivated in
                                      the case of a long ramp queue. Finally, when congestion is over, ramp metering is
                                      activated occasionally to manage the last strains of traffic.
Sustainability  2021,
      Sustainability    13,13,
                     2021,  x 850
                               FOR PEER REVIEW                                                                                           12 of 19

                                     Figure 7. Simulation setup [17].
                                      Figure 7. Simulation setup [17].
                                            Another research study on ramp metering was published in October 2020 by Xiaobo
                                     Ma et The       authors
                                               al. [18].  The study examined
                                                                         highlightedthetheproblem      of bottlenecks
                                                                                             lack of knowledge                arising
                                                                                                                     about data             during peak
                                                                                                                                    requirements
                                     (i.e., referring   to  the  data  collection   duration   for users’
                                      caused by excessive demand from both ramps and mainstream traffic,   accommodation       times    (to become
                                                                                                                                                 and report
                                     acquainted with the new circumstance)) and evaluation times. The proposed approach
                                      main conclusions:
                                     was statistical and non-parametric, and the model accuracy was not affected by data
                                      •       A proactive
                                     distribution     and random  use of   ramp metering
                                                                        variables.               and VSLs
                                                                                     For the extent    of the significantly
                                                                                                                data required for improves
                                                                                                                                       assessment, freeway m
                                      •
                                     the  authors’    case    study   considered    three  active  ramps    on  State
                                              The control performances between ramp metering and VSLs within the s    Route   51  of  the   Phoenix
                                     metropolitan area (Arizona, USA), as the Arizona Department of Transportation (ADOT)
                                              mand scenario are different, suggesting that ramp metering may help allev
                                     was switching from a fixed time strategy to a responsive ramp control strategy. From the
                                     results,congestion          caused by
                                                and for this particular     caseon-ramp       flows, found
                                                                                 study, the authors    whereas       VSLs
                                                                                                               that two      fit better
                                                                                                                         months    of data when
                                                                                                                                             should contro
                                              mainstream
                                     be collected    to possess   traffic
                                                                    enough  flow,   bringing
                                                                              information    for a greater
                                                                                                 ramp         levelassessment
                                                                                                       metering       of benefit     in this
                                                                                                                                  (Table    7). case;
                                      •     As  ramp   meters     work   with  the  help  of algorithms,   this also  happens
                                              In the case of the integrated use of ramp metering and VSLs, the former rea        with   automated
                                     vehicles, a technology that is expected to become more and more widespread in everyday
                                              and the latter takes control as the demand grows. The two control systems w
                                     life. The interactivity between ramp metering and automated vehicles has been covered
                                     recently gether     during
                                                 by Tajdari    et al.the
                                                                      [19],highest    congestion
                                                                            specifically              level,
                                                                                          regarding the        and ramp
                                                                                                          integration         metering
                                                                                                                        between               is deactivate
                                                                                                                                   lane changing
                                              case   of  a   long    ramp     queue.    Finally,    when     congestion
                                     and ramp metering. Based on a simplified traffic flow model and formulated as a linear  is  over,     ramp      meterin
                                     quadraticvated    occasionally
                                                   integral    regulator, atofeedback
                                                                               manage       the lastisstrains
                                                                                         controller    intended  oftotraffic.
                                                                                                                       optimize traffic flows in
                                     motorway bottlenecks. The feedback controller’s optimal setpoints are processed by an
                                              Another research study on ramp metering was published in October 2020 by
                                     extremum seeking algorithm introduced by the authors. This method is evaluated through
                                      Ma et al. [18].
                                     simulation      with aThe     study highlighted
                                                               macroscopic,                   the lack
                                                                               multi-lane model      that of  knowledge
                                                                                                          considers            aboutdrop
                                                                                                                       the capacity       data    requireme
                                                                                                                                               effect.
                                      referring
                                     The             to the
                                            final result   is adata     collection
                                                                  methodology      thatduration     for users’
                                                                                        permits efficient          accommodation
                                                                                                             integrated   control between    timesthe (to bec
                                     lane-changing       and    ramp   metering   technologies.
                                      quainted with the new circumstance)) and evaluation times. The proposed appro
                                      statistical and non-parametric, and the model accuracy was not affected by data d
                                      tion and random variables. For the extent of the data required for assessment, the
                                      case study considered three active ramps on State Route 51 of the Phoenix metr
                                      area (Arizona, USA), as the Arizona Department of Transportation (ADOT) was sw
                                      from a fixed time strategy to a responsive ramp control strategy. From the results
                                      this particular case study, the authors found that two months of data should be c
                                      to possess enough information for ramp metering assessment (Table 7).
Sustainability 2021, 13, 850                                                                                                  13 of 19

                                  Table 7. Minimum amount of data for ramp metering evaluation [18].

 Site    Time Performance Measures                                                  Aggregation Level
                                             Detector
                                              Based              Detector Based Speed                Probe Vehicles Based Speed
                                            Flow Rate
                                             15-min      1-min      5-min   10-min 15-min      1-min      5-min    10-min   15-min
                   Minimum Evaluation
   1     AM                                     6          9          9       10         8      11          11       12       13
                       Time (Days)
                     KS test statistic         0.02       0.01       0.02    0.02       0.03   0.01        0.01     0.02     0.02
                   KS test critical value      0.21       0.04        0.1    0.13       0.18   0.04        0.09     0.12     0.14
                   Minimum Evaluation
         PM                                     7          6          7       7          8       6          8         8           8
                       Time (Days)
                     KS test statistic         0.03       0.01       0.03    0.04       0.03   0.01        0.01     0.01     0.02
                   KS test critical value      0.17       0.05        0.1    0.14       0.16   0.05        0.09     0.13     0.16
                   Minimum Evaluation
   2     AM                                     7          13        13       12        13      10          8        10           8
                       Time (Days)
                     KS test statistic         0.02       0.04       0.04    0.05       0.04   0.01        0.03     0.03     0.04
                   KS test critical value       0.2       0.04       0.08    0.12       0.14   0.04        0.11     0.13     0.18
                   Minimum Evaluation
         PM                                     6          6          8       8          8       8          8         8           8
                       Time (Days)
                     KS test statistic         0.03       0.02       0.05    0.06       0.06   0.01        0.02     0.02     0.03
                   KS test critical value      0.19       0.05       0.09    0.13       0.16   0.04        0.09     0.13     0.16
                   Minimum Evaluation
   3     AM                                     8          8          9       10         8       8          10        8           8
                       Time (Days)
                     KS test statistic         0.02       0.02       0.02    0.01       0.03   0.02        0.02     0.02     0.04
                   KS test critical value      0.18       0.05        0.1    0.13       0.18   0.05        0.09     0.15     0.18
                   Minimum Evaluation
         PM                                     6          6          6       6          6       8          8         8           9
                       Time (Days)
                     KS test statistic         0.04       0.01       0.02    0.04       0.06   0.01        0.02     0.02     0.03
                   KS test critical value      0.19       0.05       0.11    0.15       0.19   0.04        0.09     0.13     0.15

                                         This solution does not require excessive computational effort, as its parameters are
                                    insensitive to the selected parameters and therefore easily applicable without resource-
                                    consuming calibration processes. The study also offers many interesting insights for future
                                    research by mentioning, for example, micro-simulation, incorporation into a larger picture
                                    within mainstream control strategies altogether with VSL or multiple bottlenecks, or ex-
                                    tending the research to more complex networks. Table 8 represents the total time spent
                                    across the various examined scenarios, along with the total number of lane changes, accord-
                                    ing to the penetration rate η (expressed as a percentage; a value of η = 100% corresponds to
                                    100% connected and automated vehicles).
                                         Yongheng Chen et al. analyzed the behavior of “Coordinated Ramp Metering Based
                                    on Real-Time OD Information” [20]. With the advancement of Internet of Vehicles (IoV)
                                    technology, information about the origin–destination of vehicles will become available
                                    in real time shortly. By using a system of real-time OD (origin destination) traffic flow
                                    information together with sets of coordinated ramp metering (CRM), it will be possible
                                    eventually to develop a new strategy in order to reduce the total travel time and bottleneck
                                    breakdowns on freeways during rush hour. Starting from a quantitative hierarchical model
                                    (QHM) algorithm, the authors determined the flow priorities according to real-time OD
                                    information and developed a new algorithm called OD-QHM. This algorithm prioritizes
                                    on-ramps with short total travel distances. The results obtained from simulation analysis
                                    confirmed this algorithm’s validity and stability. Additionally, a comparison between the
                                    non-control case and the ALINEA algorithm application was carried out. Table 9 reports
                                    some network performance indicators returned by the OD-QHM algorithm.
Sustainability 2021, 13, 850                                                                                                                14 of 19

                   Table 8. Total time spent (TTS) and TNLC (total number lane change) across different scenarios [19].

                                                                                                    Total Number of
                               Penetration Rate                                       TTS                                           N-LC
                                                           TTS (Veh.h)                               Lane Change
                                     (%)                                         Improvement (%)                               Improvement (%)
                                                                                                         (N-LC)
   No control Case                                             1060                                      15,210
                                      25                        795                    25                15,163                       0.3
       Without                        50                        783                   26.1               11,926                      21.6
   activation logic                   75                       779.9                  26.4               10,969                      26.8
                                     100                       777.9                  26.6                9938                       34.6
                                      25                        821                    22                 5648                       62.9
       Without                        50                        810                   23.6                4769                       68.6
   activation logic                   75                       806.6                  23.9                4474                       70.6
                                     100                       802.7                  24.2                4143                       72.8
       ALINEA                        100                       901.2                   15                129.82                      14.6

      Table 9. Overview of network performance indicators. Conditions (a), (b,) and (c) refer to 0.5×, 1.0×, and 1.5× flow,
      respectively [20].

                                                                           (a)
                                                 300 s                                                          600 s
   Scenario
                     TTS (%)          TD (%)             TTD (%)         ADR (%)        TTS (%)      TD (%)             TTD (%)      ADR (%)
  No control            2003            1731              23,438           266              2005      1728               23,592         264
   ALINEA           1409 (−30)       1124 (−35)          25,247 (8)    160 (−40)       1793 (−11)   1512 (−13)          24,494 (4)   222 (−16)
  OD-QHM             779 (−61)       488 (−72)           25,138 (7)      70 (−74)      1394 (−30)   1111 (−36)          24,013 (2)   167 (−37)
                                                                           (b)
                                                 300 s                                                          600 s
   Scenario
                     TTS (%)          TD (%)             TTD (%)         ADR (%)        TTS (%)      TD (%)             TTD (%)      ADR (%)
  No control            2233            1959              23,404           301              2325      2051               22,487         328
   ALINEA           1820 (−18)       1532 (−22)          25,245 (8)    219 (−27)       2200 (−5)    1917 (−7)           23,993 (7)   288 (−12)
  OD-QHM            1183 (−47)       881 (−55)       25,838 (10)       123 (−59)       1945 (−16)   1646 (−20)      24,691 (10)      240 (−27)
                                                                           (c)
                                                 300 s                                                          600 s
   Scenario
                     TTS (%)          TD (%)             TTD (%)         ADR (%)        TTS (%)      TD (%)             TTD (%)      ADR (%)
  No control            2266            1977              24,758           287              2355      2062               23,838         311
   ALINEA           1886 (−17)       1606 (−19)      24,534 (−1)       236 (−18)       2211 (−6)    1930 (−6)       23,543 (−1)       295 (−5)
  OD-QHM            1181 (−48)       865 (−56)           26,957 (9)    116 (−60)       1975 (−16)   1671 (−19)          24,907 (4)   242 (−22)

                                       4. Economical Aspects and Critical Issues
                                            As shown above, ramp metering represents an efficient technique that, with minimum
                                       economic impact, can affect a traffic volume management strategy positively on the freeway
                                       so that general traffic flow can occur without creating disease in minor roadways [21].
                                       However, like any other engineering artifact, it is necessary to analyze the economic
                                       aspects deeply. Two main phases are fundamental: deployment and maintenance. From
                                       an economic point of view, they represent the immediate impact. The main obstacle of
                                       ramp metering system implementation regards the institution’s interests. With recent
                                       innovations, such as autonomous vehicles and smart cars [22], they are more likely to
                                       allocate funds to other transportation infrastructure upgrades concerning smart roads
                                       environments (SREs) [23] and intelligent transportation systems (ITSs), considering that
                                       future perspectives of communities are leading to the gradual implementation of smart
You can also read