An Empirical Assessment of Factors Influencing Injury Severities of Motor Vehicle Crashes on National Highways of Pakistan - Hindawi.com
←
→
Page content transcription
If your browser does not render page correctly, please read the page content below
Hindawi
Journal of Advanced Transportation
Volume 2021, Article ID 6358321, 11 pages
https://doi.org/10.1155/2021/6358321

Research Article
An Empirical Assessment of Factors Influencing Injury
Severities of Motor Vehicle Crashes on National
Highways of Pakistan

 Hanif Ullah ,1 Asim Farooq ,1 and Akhtar Ali Shah 2

 1
 Department of Civil Engineering, CECOS University of IT and Emerging Sciences, Peshawar, Pakistan
 2
 Department of Urban and Regional Planning, University of Peshawar, Peshawar, Pakistan

 Correspondence should be addressed to Hanif Ullah; hanifullah755@yahoo.com

 Received 13 April 2021; Revised 2 June 2021; Accepted 17 June 2021; Published 23 June 2021

 Academic Editor: Elżbieta Macioszek

 Copyright © 2021 Hanif Ullah et al. This is an open access article distributed under the Creative Commons Attribution License,
 which permits unrestricted use, distribution, and reproduction in any medium, provided the original work is properly cited.
 Road transport is the dominant mode of transport in Pakistan carrying 91% of the country’s passenger traffic and 96% of freight
 traffic. National highways, being 3.7% of the entire road network, carry 80% of commercial traffic. Due to the high number of road
 traffic crashes and resulting fatalities, a random parameters logit model was estimated to determine the risk factors that influence
 the severity of injuries caused by motor vehicle crashes on national highways. The effects of driver characteristics, crash
 characteristics, highway characteristics, temporal characteristics, and environmental characteristics were considered for the
 analysis. From the results, it was revealed that many factors such as overspeeding, driver dozing, driver carelessness, driver age
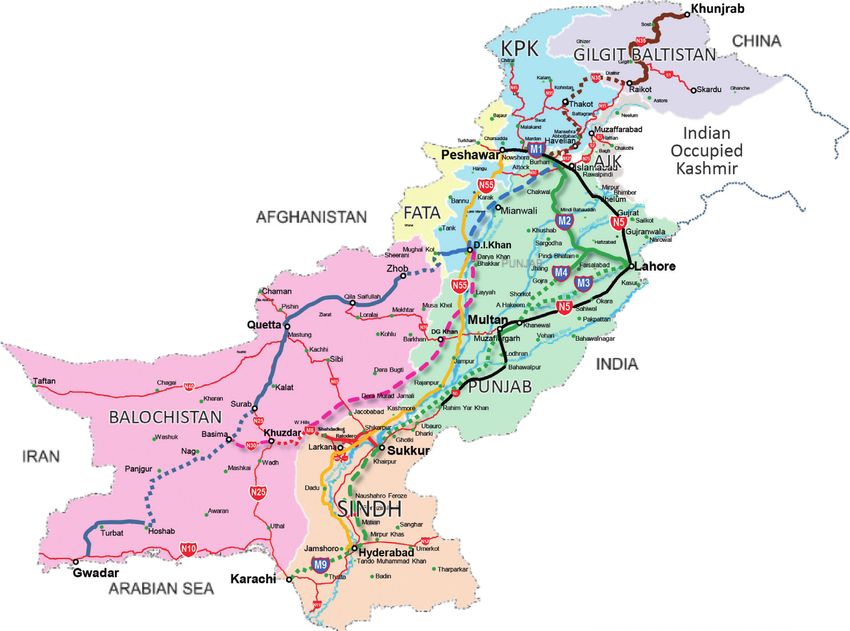
2 Journal of Advanced Transportation

behavior of road users are the major characteristics of road 3. Data Description
environment in Pakistan. Thus, the factors that significantly
affect the injury severities of MVCs along national highways The route selected for the study was the 953 km section of
of Pakistan are unknown and a fundamental bottleneck in N-5 (North Zone from Peshawar to Lahore and central zone
improving road safety in Pakistan. So, it is necessary to from Lahore to Rahim Yar khan Khan) as shown in Figure 1.
comprehensively understand the impact of various risk N-5 is an 1819 km long major arterial connecting Karachi
factors contributing to the injury severities of MVCs on with the Torkham (Afghan Border). Crash information for
national highways of Pakistan so that appropriate safety the examination was obtained from NH and MP Rawalpindi
interventions can be identified and implemented to reduce office for a five years’ time frame from January 2015 to
the frequency and severity of these crashes. The current December 2019. NH and MP is a police force responsible for
study investigated injury severity of MVCs on national the safety and security of national highways and motorways.
highways of Pakistan. Crash data for N-5 were obtained It also maintains the record of RTCs by filling a crash in-
from National Highways and Motorway Police (NH and vestigation form at the site immediately after the occurrence
MP) for the development of a random parameters logit of the crash. For recording crash minutiae, a four-page crash
model with the purpose to determine major contributing Proforma is utilized by the NH and MP which is called
factors to injury severities caused by MVCs. Microcomputer Accident Analysis Proforma (MAAP).
 MAAPs for 2023 crashes were obtained from NH and MP
2. Literature Review Rawalpindi office. MAAP records victim and driver’s de-
 mographics (age and gender), temporal details (time, date,
From the precedent research efforts, a vast array of factors month, and year of the crash), environmental details
were determined to be related to RTCs of various injury (weather and visibility characteristics), type of vehicle,
severity levels [18–23]. Common factors revealed by the victim’s injury severity level sustained during the crash, and
literature as associated with increased injury severity of the dominant crash cause. Injury levels based on severity are
RTCs are speeding [24, 25], increased driver or rider age classified into four categories: fatal injury, major injury,
[26], driving under the influence of alcohol [27–30], road minor injury, and no injury.
alignment [26, 28], darkness [31–35], crashes involving In our dataset, 2023 crashes had complete information, out
heavy commercial vehicles and motorcycles [18, 24, 36], and of which 122 (6.03%) were no injury, 140 (6.93%) were minor
head-on-collisions [20, 28]. Diverse modeling approaches injury (crashes in which the victims sustain injuries that are not
have been utilized by researchers in earlier studies for the life-threatening like abrasions or minor cuts with little or no
estimation of road crash injury severities. These methods bleeding), 602 (29.75%) were major injury (crashes in which at
include artificial neural networks [37, 38], Bayesian ordered least one of the injured persons is admitted in hospital, e.g.,
probit [26], classification and regression tree [19, 39], log- head, neck, or spinal injury and excessive bleeding), and 1159
linear model [39], Bayesian hierarchical binomial logit [40], (57.29%) were fatal injury crashes (crashes in which at least one
Markov switching multinomial logit [41], binary logit and injured person die on the same day). It was also revealed from
binary probit [18, 42–45], mixed generalized ordered logit the crash information statistics that the majority of the sufferers
[20], multinomial logit [46], nested logit [28, 47], ordered were drivers (78.35%) contrasted with pedestrians and pas-
logit, and ordered probit [38, 48, 49] models. sengers. As female driving on national highways is very rare
 These conventional models are unable to allow variation due to social and cultural constraints, male victims are
in explanatory variables across individual outcomes. It is the dominant (92.98%) while females’ share in fatalities and in-
main limitation of these models. In reality, the response of juries is very less (7.02%). Crashes in dry weather were much
individual outcome to an explanatory variable is different more in numbers (92.24%) than crashes in wet weather
and thus cannot be considered as fixed. Also, the injury (7.76%). The frequency of crashes during the daytime was high
severity of MVCs could potentially be affected by some (68.41%) as compared to the crashes during the night (31.59%).
unobserved factors for which the data is either impossible or It was noticed that RTCs frequency was higher during
very difficult to obtain. Overpassing these factors may cause the spring and summer seasons (March to August) (65.59%).
erroneous inferences and biased estimates of parameters In most of the crashes (87.70%), driver age was between 25
[50]. To resolve the issue of unobserved heterogeneity, re- and 50 years. Likewise, crash frequency was higher during
searchers have been constantly trying to use models with dry weather (60.15%) and in the off-peak period (66.74%).
unbiased parameter estimates and accurate inferences. Such The majority of crashes occurred in urban sections (61.65%)
models include latent-class models with random parameters compared to rural sections (38.35%). The dataset revealed
[51], Markov switching model with random parameters [52], that the frequency of multivehicle collision is more (65.65%)
random parameters with heterogeneity in means [22, 53], as compared to single-vehicle collision (34.35%). Table 1
and random parameters with heterogeneity in means and shows descriptive statistics of variables.
variances [15]. Mixed logit models, that is, random pa-
rameters logit models, are the most popular and frequently 4. Methodology
used models in injury severity studies [53–55]. These models
are capable of capturing unobserved heterogeneity in the Following the recent works [15, 54, 55], a random parameters
crash data and discovering complex relationships between (mixed) logit model was estimated considering heterogeneity
injury severities and crash contributing factors. in means and variances to determine critical factors
Journal of Advanced Transportation 3

 N

 Figure 1: Segment of national highway-5 selected for the study.

 Table 1: Descriptive statistics of variables.
Variables Percentage
Crash injury severity
No/minor/major/fatal 6.03/6.93/29.75/57.29
Month
January/February/March/April/May/June 6.26/4.41/10.43/11.22/9.14/9.39
July/August/September/October/November/December 14.68/10.73/7.99/5.16/5.38/5.21
Day
Monday/Tuesday/Wednesday/Thursday/Friday/Saturday/Sunday 16.26/11.9/11.41/13.34/14.73/17.59/14.6
Weekday/weekend 69.25/30.75
Weather conditions
Sunny/cloudy/rainy 60.15/22.85/17.00
Season
December–February (winter)/March–May (spring) 15.88/30.79
June–August (summer)/September–November (autumn) 34.80/18.53
Time of the day
12 a.m.–3 a.m./3 a.m.–6 a.m./6 a.m.–9 a.m./9 a.m.–12 p.m. 6.12/8.50/14.58/14.43
12 p.m.–3 p.m./3 p.m.–6 p.m./6 p.m.–9 p.m./9 p.m.–12 p.m. 16.36/17.30/14.33/8.35
(AM peak: 7 : 30 a.m. to 10 : 30 a.m., PM peak, 4 : 30 p.m. to 7 : 30 p.m., off-peak hours) 16.75/16.51/66.74
Driver age
4 Journal of Advanced Transportation

influencing injury severity of MVCs on national highways of Table 4. Some discussion about the significant variables has
Pakistan. Lack of some variables in our data set (driving been carried out in the subsequent paragraphs.
license, operating speed, and traffic condition during crash
occurrence) could potentially affect the impact of observed
variables on crash severity by inducing unobserved hetero- 6. Discussion
geneity and may result in biased estimates of parameter and
wrong inferences [50]. The model estimated allows variation Some discussion about the significant variables has been
in mean and variance of random parameters across obser- carried out in the succeeding paragraphs.
vations so that observation-specific variation in the effect of
independent variables may be captured in the best possible
manner [15, 55]. Crash severity function is defined as [56] 6.1. Driver Characteristics. Overspeeding was found to be
 associated with decreased probability of no injury crashes
 Min � βi Xin + εin , (1) and increased probability of injury crashes. A similar finding
 has been revealed by many studies conducted in the past
where Min determines injury severity for category i for crash
 [62–64]. The level of police enforcement on national
n; Xin is the explanatory variable vector, βi is the estimable
 highways is relatively low as compared to the motorways;
parameter vector for discrete outcome i; and εin is the error
 that is why overspeeding by the drivers is common on these
term.
 highways. Further, the speeding penalties are low and there
 To account or unobserved heterogeneity, βi is allowed to
 is no legislation such as a demerit points system for repeat
vary across crashes and is defined as [15, 55, 56]
 offenders.
 βi � β + Θi Zi + σ i EXP ωi Wi υi, (2) To reduce the number and severity of crashes, over-
 speeding violations need to be reduced. This is possible by
where β represents the mean parameter estimate across all using behavior modification techniques to drivers based on
observations and Zi and Wi are attribute vectors used for the theory of planned behavior [65], thorough monitoring
capturing heterogeneity in the mean and standard deviation through speed cameras, an increase in violation penalties
σ i, with corresponding parameter vector ωi. and by introducing demerit points and license suspension
 The estimable parameters vector is Θi and the distur- system.
bance term is υi. The error term εin is assumed as generalized Driver age less the 25 years was found to be associated
extreme value distributed that results in model probabilities with an increased likelihood of minor injuries and a de-
allowing for parameters to vary across crashes and are de- creased likelihood of other injury categories. Being inex-
fined as [57] perienced and careless, there are more chances for younger
 β drivers to be involved in crashes, but being in healthy
 Pn(i) � βi Xin f i dβi condition without any deterioration of physical and mental
 φi
 (3) abilities, they can perceive the risk and cope with the sit-
 uation better than the aged drivers [66, 67]. Contrarily, older
 EXP βI Xin ,
 drivers, when injured in crashes, have an increased risk of
where Pn(i) represents the probability of crash severity fatality [68, 69] and experience more severe injuries even in
outcome i for specified crash n and I represents set of injury nonfatal crashes.
severity categories. f(β/φ) is the density function of β with φ Drivers’ dozing at wheel was found to be associated with
referring to a vector of density function parameters. To a lesser possibility of minor injury crash causation and
account for unobserved heterogeneity, β is determined greater possibility of major or fatal injury crash causation.
using the density function f(β/φ) [56]. The probabilities are Driving for many hours without taking any rest can lead the
estimated by drawing values of β from the density function driver to drowsiness. It reduces the judgment and decision-
(f(β/φ)) for given values of f. Model estimation was done making capabilities of the driver, thus increasing his/her
utilizing the maximum likelihood approach and using response time to cope with a certain situation. This increases
Halton draws. Increased effectiveness of Halton draws over the risk of high severity RTCs. Due to the lack of hours-of-
random draws is frequently cited in the literature [58]. service regulations for commercial vehicle drivers in Paki-
 For estimation of the model, 500 Halton draws were used stan, dozing-related crashes are common in these heavy
which are enough for accurate parameter estimation as vehicles, which in turn is a major factor, increasing injury
indicated by some previous studies [56, 58, 59]. Normal severity of crashes. Dozing at wheel has been recognized as
distribution was used as it provided the best statistical fit for one of the key crash risk factors in past research [10, 63, 70].
the functional form of parameter density function which is Crashes in which driver carelessness was reported as the
also indicated by some prior studies [60, 61]. cause of the crash were found less likely to cause minor
 injury to the victims and more like to cause injuries of other
5. Results severity levels. Carelessness of drivers may be in many forms
 that mainly include either distraction or not following traffic
Model estimation results are presented in Table 2, marginal control. Some past studies [25, 71] also revealed that care-
effects of the significant variables are presented in Table 3, lessness of drivers substantially increases the chances of
and goodness-of-fit of the estimated model is presented in crash occurrence and the resulting injury severities.
Journal of Advanced Transportation 5

 Table 2: Estimated model results for crash severity outcomes.
 Parameter
Variable t-stat
 estimate
Fatal injury
 −3.071
Constant (standard error of parameter distribution) −11.57 (4.050)
 (2.572)
July indicator (1 if crash occurred in the month of July, 0 otherwise) 0.60685 2.24
Weekday indicator (1 if crash occurred during weekday, tractor or truck, 0 otherwise) −0.53878 −2.82
Truck indicator (1 if truck was involved in crash, 0 otherwise) 0.52432 2.70
Night without road lights indicator (1 if crash occurred at night without road lights, 0 otherwise)
 0.93067 (1.524) 4.92 (2.849)
(standard error of parameter distribution)
Major injury
Constant −0.870 −6.645
November indicator (1 if crash occurred in the month of November, 0 otherwise) 0.41588 2.31
Cloudy weather indicator (1 if crash occurred in cloudy weather, 0 otherwise) 1.02062 3.37
Curve indicator (1 if crash occurred at horizontal curve, 0 otherwise) 0.33802 2.76
Tuesday indicator (1 if crash occurred on Tuesday, 0 otherwise) 0.26790 1.80
Pothole indicator (1 if potholes were present in road, 0 otherwise) (standard error of parameter −1.73
 −0.47476 (1.524)
distribution) (2.849)
Minor injury
AM peak indicator (1 if crash occurred during AM peak hours, 0 otherwise) −0.43013 −2.56
Driver dozing indicator (1 if crash cause was driver dozing, 0 otherwise) −0.70923 −2.28
Driver age
6 Journal of Advanced Transportation

 Table 3: Estimated marginal effects of the model.
Variable Fatal injury Major injury Minor injury No injury
Fatal injury
July indicator −0.0004 −0.0015 −0.0029 0.0048
Weekday indicator 0.0014 0.0057 0.0112 −0.0183
Truck indicator −0.0013 −0.0060 −0.0115 0.0189
Night without road lights indicator −0.0017 −0.0074 −0.0133 0.0225
Major injury
November indicator −0.0012 −0.0047 0.0069 −0.0010
Cloudy weather indicator −0.0013 −0.0038 0.0058 −0.0007
Curve indicator −0.0113 −0.0455 0.0664 −0.0097
Tuesday indicator −0.0012 −0.0046 0.0067 −0.0009
Pothole indicator 0.0005 0.0022 −0.0032 0.0005
Minor injury
AM peak indicator 0.0010 −0.0084 0.0070 0.0005
Driver dozing indicator 0.0005 −0.0039 0.0031 0.0004
Driver age < 25 years indicator −0.0012 0.0122 −0.0100 −0.0011
Driver carelessness indicator 0.0032 −0.0312 0.0251 0.0029
Wet road surface indicator∗ −0.0010 0.0075 −0.0057 −0.0007
No injury
Overspeeding −0.0023 0.0008 0.0014 0.0001
May indicator −0.0015 0.0005 0.0009 0.0001
Rickshaw indicator 0.0080 −0.0025 −0.0050 −0.0004
Clear weather indicator −0.0323 0.0102 0.0199 0.0022
Single-vehicle indicator 0.0020 −0.0006 −0.0013 −0.0001
Normal visibility indicator −0.0030 0.0010 0.0018 0.0002

 Table 4: Goodness-of-fit of the competing models.
Model statistics Model with no heterogeneity in means Model with heterogeneity in means
Number of parameters 24 25
Restricted log-likelihood −2804.47349 −2804.47349
Log-likelihood at convergence −2039.10251 −2037.46155
Akaike information criteria (AIC) 4126.2 4124.9
Bayesian information criteria (BIC) 4265.23 4260.901
Number of observations 2023 2023

thus more likely to cause crashes of other severities. From major and/or fatal injury crashes. It may be due to the fact
the previous literature, the relationship between road surface that motor vehicle drivers tend to drive faster in the early
conditions and crash occurrence or injury severity is not morning [83] striving to reach their workplaces in time and
very clear [80]. A study by Li et al. [81] revealed that poor faster speeds are associated with higher injury severity [25].
road surface condition increases the probability of more Also, the fog in the winter season prevails in some rural
severe crashes compared to fair surface conditions while sections of the selected route where traffic volume is rela-
very poor pavement conditions do not contribute signifi- tively less and the drivers are free to move faster which may
cantly to more severe crashes. Another study revealed that, contribute to higher levels of injury severity. Another reason
for pavements in poor condition, the surface condition may be that many commercial vehicle drivers drive alone for
variable has a significant random parameter [82]. The the whole night without rest and thus, during morning
presence of potholes may increase the chances of crash hours, their reflexes slow down due to drowsiness that leads
occurrence as the drivers sometimes abruptly change the to the causation of higher injury crashes. Crashes involving
lane to avoid a pothole. But, the speed of the vehicle at the trucks and dozing at wheel are also significant factors in our
badly maintained road is usually slower than that on the study. Some prior investigations also revealed the same
road with good ride quality. Further, on a divided highway, finding [50, 84, 85].
the crashes are usually side collisions at less than 90° angle, Crashes that occurred in the month of May are found
thus decreasing the chances of major injuries to the victims. more likely to cause injury crashes and less likely to cause no
 injury crashes. No significant evidence has been found in the
 previous literature about the positive relationship between
6.5. Temporal Characteristics. Crashes that occurred during injury severities and the month of May. This finding may be
AM peak hours (07 : 30 a.m. to 10 : 00 a.m.)) were found less attributed to the medium temperature and clear weather in
likely to cause minor injury crashes and more likely to cause the month of May that encourage people to travel more.
Journal of Advanced Transportation 7

Clear weather and more miles travel are frequently revealed night without road lights may result in impaired hazard
by the researchers as positively associated with injury se- perception and reaction time of the driver [80, 93, 94].
verity of crashes [86–88]. The summer months of June, July, Despite driving in darkness, the low traffic volume at night
and August are extremely hot in most areas of Pakistan, time may motivate some drivers for aberrant driving such as
specifically along our study route and the fact about more speeding or traffic light violations [95]. These errors done by
miles travel in summer months in the colder regions is not the drivers are associated with an increased possibility of
applicable to our indigenous climate. severe injury crashes.
 Crashes that occurred in the month of November are The road surface condition variable wet was found as a
found more likely to cause major injury crashes. November random significant variable. Mixed results have been
is the start of winter and so the start of fog along the route. demonstrated about the wet pavement surface indicator
The causation of major injury may be attributed to the fog [96]. If the road is wet, the chances of crash occurrence are
prevailing at various road segments of the selected highway increased due to hydroplaning. This is consistent with past
section. Previous studies also indicated that fog is associated research [97], but at the same time, cautious driving is more
with severe injuries [88–90]. likely in bad weather, decreasing the severity outcome of the
 Crashes that occurred in the month of July are found crashes [26].
more likely to cause major injury crashes. It is also evident
from past studies that high atmospheric temperature is 7. Conclusions
associated with crashes of severe injuries [28]. The same
finding was revealed by another study on motorways of The focal point of this study was the determination of factors
Pakistan [16]. Another study in the US showed that summer influencing severities of injuries induced to the victims by
months experience more fatal crashes, probably due to more motor vehicle crashes on national highways of Pakistan. A
vehicle travel [83]. But in Pakistan, it may be attributed to random parameters logit model was estimated considering
the hydroplaning phenomenon due to wet road surfaces as heterogeneity in means and variances. For the analysis
the monsoon season begins in early July. purpose, crash data obtained from NH and MP was utilized.
 One of the unique results of our study is that crashes that Mainly, the effect of driver demographics and behavior,
occurred on Tuesday are more likely to cause major injury. crash characteristics, roadway characteristics, and envi-
In contrast, one of the past studies showed that Tuesday is ronmental characteristics were considered for the analysis.
the safest day of the week to drive with lesser crashes and From the model estimation results, it was revealed that
lower injury severities [91]. This finding may be due to the the probability of fatal injury to the crash victims increases
weekly cattle markets at different locations held on road- when trucks are involved and when the crashes occur during
sides, mostly on Tuesday, which increase the traffic and the night without road lights while the probability of fatal
pedestrian volume. Most of the people in cattle markets are injury to the crash victims decreases when the crashes occur
cattle owners or buyers with no or less sense in regard to during weekdays. The probability of major injury to the
traffic rules. This may enhance injury severity of victims victims increases when the crash occurs on a horizontal
when the crash occurs at or near such places. curve, in the months of July and November, on Tuesday, and
 The weekday indicator is found less likely to cause fatal during cloudy weather, while the probability of major injury
injury crashes. It might be due to the lower operating speeds to the victims decreases when potholes are present in road
of vehicles on weekdays owing to high traffic volume, re- surface. The probability of occurrence of minor injury to the
ducing the chances of fatal injuries to the victims. Some prior victims increases when young drivers (age < 25 years) are
studies also revealed the same finding [37, 92]. involved in crashes and for single-vehicle crashes, while it
 decreases for driver dozing at wheel, carelessness of driver,
 and when crash occur during AM peak hours. Probability of
6.6. Environmental Characteristics. The weather indicator occurrence of no injury to the victims increases when a
clear is another significant variable that is associated with an rickshaw (motorized three-wheeler) is involved in the crash
increased possibility of injury crashes and decreased pos- while it decreases for crashes that are caused by over-
sibility of no injury crashes. One of the past studies indicated speeding, occurring in the month of May, occurring during
that crashes that occurred during daytime and good weather clear weather, and occurring during normal visibility
conditions are more likely to cause major or fatal injuries conditions.
[77]. Crashes that occurred in cloudy weather are found The eventual contribution of this study is to provide
more likely for the causation of major injury crashes. This insight for prioritizing road sections for improvements and
may be attributed to the ideal weather condition for ag- developing evidence based safety interventions for the
gressive driving that is being exhibited by the drivers. This country.
result is consistent with prior investigations [40]. In view of the above findings, various safety measures are
 Crashes that occurred in normal visibility conditions are suggested to eliminate the injuries caused by motor vehicle
found associated with decreased possibility of no injury crashes on national highways of Pakistan. These measures
crashes and increased possibility of injury crashes as in case are based on the traditional 4Es (Engineering, Enforcement,
of clear weather. This finding is also evident from earlier Education, and Emergency services) approach. Engineering
studies [90]. Crashes that occurred at night without road measures include the provision of a separate lane for heavy
lights are more likely to cause fatal injury crashes. Driving at commercial vehicles, ensuring a proper geometric design of
8 Journal of Advanced Transportation

horizontal curves, installation of road lights on dangerous References
segments, and proper maintenance of roads. Enforcement
measures include speed laws enforcement, introduction and [1] World Health Organization, Global Status Report on Road
implementation of hour of service regulations for com- Safety 2018, World Health Organization, Geneva, Switzerland,
 2018.
mercial vehicles, and discouraging wrong-way driving.
 [2] World Health Organization, Global Status Report on Road
Education measures include road safety awareness cam-
 Safety 2015, World Health Organization, Geneva, Switzerland,
paigns utilizing various forms of media, distributing pam- 2015.
phlets, and organizing seminars on road safety. Emergency [3] A. Ahmed, B. A. Khan, M. B. Khurshid, M. B. Khan, and
measures include the establishment of trauma centers along A. Waheed, “Estimating national road crash fatalities using
the highways and ensuring the provision of immediate first aggregate data,” International Journal of Injury Control and
aid to the injured persons. Moreover, behavior modification Safety Promotion, vol. 23, no. 3, pp. 249–254, 2016.
programs need to be introduced for drivers exhibiting ab- [4] A. Ahmed, Road Safety in Pakistan, National Road Safety
errant behavior. Secretariat, Islamabad, Pakistan, 2007.
 The present study has some limitations. Crash data were [5] Z. Batool, Attitudes towards Road Safety and Aberrant Be-
obtained from reports prepared by the National Highways haviour of Drivers in Pakistan, University of Leeds, Leeds, UK,
and Motorway Police. Despite the potential underreporting 2012.
of minor and no injury crashes [98], the data used in the [6] A. Rafiq, Information and Services, National Highway Au-
study are the only available data for crashes on national thority, Islamabad, Pakistan, 2014, http://nha.gov.pk/.
highways in Pakistan. Moreover, crash data for only N-5 (the [7] A. A. Hyder, Abdul Ghaffar, and T. I. Masood, “Motor vehicle
 crashes in Pakistan: the emerging epidemic,” Injury Preven-
longest national highway of Pakistan) were used in the study
 tion, vol. 6, no. 3, pp. 199–202, 2000.
as such data is not available for other highways. Crash data
 [8] I. Hafeez and M. A. Kamal, “Accidents black spots on
for other highways need to be collected and used in the highways and their low cost remedial measures,” WIT
injury severity analysis in future studies. Transactions on The Built Environment, vol. 101, pp. 691–700,
 2008.
 [9] A. Kayani, J. J. Fleiter, and M. J. King, “Achieving safe road use
Data Availability in a rapidly motorising country: the influence of longstanding
 beliefs on risky driver behaviour in Pakistan,” in Proceedings
All the data supporting the results of our study are available
 of the International Conference of Applied Psychology (ICAPP
and will be provided on request (hanifullah755@ 2012), Kampala, Uganda, November 2012.
yahoo.com). [10] K. Azam, “Comparison of fatigue related road traffic crashes
 on the national highways and motorways in Pakistan,” Journal
 of Engineering and Applied Sciences, vol. 33, no. 2, 2014.
Conflicts of Interest [11] Z. Batool and O. Carsten, “Attitudinal segmentaion of drivers
 in Pakistan: the potential for effective road safety campaigns,”
The authors declare no conflicts of interest.
 Accident Analysis & Prevention, vol. 114, pp. 48–54, 2018.
 [12] H. M. Hammad, M. Ashraf, F. Abbas et al., “Environmental
 factors affecting the frequency of road traffic accidents: a case
Authors’ Contributions study of sub-urban area of Pakistan,” Environmental Science
Conceptualization was performed by H. U. and A. A. S.; and Pollution Research, vol. 26, no. 12, pp. 11674–11685, 2019.
 [13] H. M. Rashid, A. Ahmed, B. Wali, and N. A. Qureshi, “An
methodology was prepared by H. U. and A. F.; software was
 analysis of highway work zone safety practices in Pakistan,”
provided by H. U.; validation was carried out by A. A. S.;
 International Journal of Injury Control and Safety Promotion,
formal analysis and investigation were performed by H. U.; vol. 26, no. 1, pp. 37–44, 2019.
resources were provided by H. U. and A. A. S.; data curation [14] F. Outay, H. A. Mengash, and M. Adnan, “Applications of
was conducted by H. U. and A. A. S.; the original draft was unmanned aerial vehicle (UAV) in road safety, traffic and
prepared by H. U.; reviewing and editing were done by A. F. highway infrastructure management: recent advances and
and A. A. S.; visualization was conducted by H. U.; su- challenges,” Transportation Research Part A: Policy and
pervision was carried out by A. F. and A. A. S. All authors Practice, vol. 141, pp. 116–129, 2020.
have read and agreed to the published version of the [15] M. Waseem, A. Ahmed, and T. U. Saeed, “Factors affecting
manuscript. motorcyclists’ injury severities: an empirical assessment using
 random parameters logit model with heterogeneity in means
 and variances,” Accident Analysis & Prevention, vol. 123,
Acknowledgments pp. 12–19, 2019.
 [16] N. Ahmad, “Exploring factors associated with crash severity
The authors would like to thank Mr. Ishfaq Ahmed, DIG on motorways in Pakistan,” Proceedings of the Institution of
Motorways, NH and MP, for extending his help during crash Civil Engineers-Transport, Thomas Telford Ltd., London, UK,
data collection. 2020.
Journal of Advanced Transportation 9

[17] G. Jacobs, A. Aeron-Thomas, and A. Astrop, Estimating urban roadways,” Accident Analysis & Prevention, vol. 108,
 Global Road Fatalities, TRL Limited, Crowthorne, UK, 2000. pp. 44–55, 2017.
[18] T. Yamamoto and V. N. Shankar, “Bivariate ordered-response [34] A. Ariannezhad and Y.-J. Wu, “Effects of heavy rainfall in
 probit model of driver’s and passenger’s injury severities in different light conditions on crash severity during Arizona’s
 collisions with fixed objects,” Accident Analysis & Prevention, monsoon season,” Journal of Transportation Safety & Security,
 vol. 36, no. 5, pp. 869–876, 2004. vol. 11, no. 6, pp. 579–594, 2019.
[19] L.-Y. Chang and H.-W. Wang, “Analysis of traffic injury [35] Z. Li, C. Chen, Q. Wu et al., “Exploring driver injury severity
 severity: an application of non-parametric classification tree patterns and causes in low visibility related single-vehicle
 techniques,” Accident Analysis & Prevention, vol. 38, no. 5, crashes using a finite mixture random parameters model,”
 pp. 1019–1027, 2006. Analytic Methods in Accident Research, vol. 20, pp. 1–14, 2018.
[20] N. Eluru, C. R. Bhat, and D. A. Hensher, “A mixed generalized [36] N. Casado-Sanz, B. Guirao, and M. Attard, “Analysis of the
 ordered response model for examining pedestrian and bi- risk factors affecting the severity of traffic accidents on
 cyclist injury severity level in traffic crashes,” Accident Spanish crosstown roads: the driver’s perspective,” Sustain-
 Analysis & Prevention, vol. 40, no. 3, pp. 1033–1054, 2008. ability, vol. 12, no. 6, 2020.
[21] A. Behnood, A. M. Roshandeh, and F. L. Mannering, “Latent [37] D. Delen, R. Sharda, and M. Bessonov, “Identifying significant
 class analysis of the effects of age, gender, and alcohol con- predictors of injury severity in traffic accidents using a series
 sumption on driver-injury severities,” Analytic Methods in of artificial neural networks,” Accident Analysis & Prevention,
 Accident Research, vol. 3-4, pp. 56–91, 2014. vol. 38, no. 3, pp. 434–444, 2006.
[22] A. Behnood and F. Mannering, “The effect of passengers on [38] D. Chimba and T. Sando, “Neuromorphic prediction of
 driver-injury severities in single-vehicle crashes: a random highway injury severity,” Advances in Transportation Studies,
 parameters heterogeneity-in-means approach,” Analytic vol. 19, pp. 17–26, 2009.
 Methods in Accident Research, vol. 14, pp. 41–53, 2017. [39] W.-H. Chen and P. P. Jovanis, “Method for identifying factors
[23] A. Behnood and F. Mannering, “Time-of-day variations and contributing to driver-injury severity in traffic crashes,”
 temporal instability of factors affecting injury severities in Transportation Research Record: Journal of the Transportation
 large-truck crashes,” Analytic Methods in Accident Research, Research Board, vol. 1717, no. 1, pp. 1–9, 2000.
 vol. 23, 2019. [40] H. Huang, H. C. Chin, and M. M. Haque, “Severity of driver
[24] C. Lee and M. Abdel-Aty, “Comprehensive analysis of vehicle- injury and vehicle damage in traffic crashes at intersections: a
 pedestrian crashes at intersections in Florida,” Accident
 Bayesian hierarchical analysis,” Accident Analysis & Preven-
 Analysis & Prevention, vol. 37, no. 4, pp. 775–786, 2005.
 tion, vol. 40, no. 1, pp. 45–54, 2008.
[25] S. Boufous, C. Finch, A. Hayen, and A. Williamson, “The
 [41] N. V. Malyshkina and F. L. Mannering, “Markov switching
 impact of environmental, vehicle and driver characteristics on
 multinomial logit model: an application to accident-injury
 injury severity in older drivers hospitalized as a result of a
 severities,” Accident Analysis & Prevention, vol. 41, no. 4,
 traffic crash,” Journal of Safety Research, vol. 39, no. 1,
 pp. 829–838, 2009.
 pp. 65–72, 2008.
 [42] M. F. Ballesteros, P. C. Dischinger, and P. Langenberg,
[26] Y. Xie, Y. Zhang, and F. Liang, “Crash injury severity analysis
 “Pedestrian injuries and vehicle type in Maryland, 1995-
 using Bayesian ordered probit models,” Journal of Trans-
 1999,” Accident Analysis & Prevention, vol. 36, no. 1,
 portation Engineering, vol. 135, no. 1, pp. 18–25, 2009.
[27] J.-K. Kim, G. F. Ulfarsson, V. N. Shankar, and S. Kim, “Age pp. 73–81, 2004.
 and pedestrian injury severity in motor-vehicle crashes: a [43] S. M. Rifaat and R. Tay, “Effects of street patterns on injury
 heteroskedastic logit analysis,” Accident Analysis & Preven- risks in two-vehicle crashes,” Transportation Research Record,
 tion, vol. 40, no. 5, pp. 1695–1702, 2008. vol. 2102, pp. 61–67, 2009.
[28] P. Savolainen and F. Mannering, “Probabilistic models of [44] A. V. Moudon, L. Lin, J. Jiao, P. Hurvitz, and P. Reeves, “The
 motorcyclists’ injury severities in single- and multi-vehicle risk of pedestrian injury and fatality in collisions with motor
 crashes,” Accident Analysis & Prevention, vol. 39, no. 5, vehicles, a social ecological study of state routes and city
 pp. 955–963, 2007. streets in King County, Washington,” Accident Analysis &
[29] K. Tsui, N. Sze, F. So, and S. Wong, “Association between Prevention, vol. 43, no. 1, pp. 11–24, 2011.
 drink driving and severity of crash injuries to road users,” [45] M. de Lapparent, “Willingness to use safety belt and levels of
 Hong Kong Journal of Emergency Medicine, vol. 17, no. 1, injury in car accidents,” Accident Analysis & Prevention,
 pp. 34–39, 2010. vol. 40, no. 3, pp. 1023–1032, 2008.
[30] P. Liu and W. Fan, “Modeling head-on crash severity with [46] N. V. Malyshkina and F. L. Mannering, “Empirical assessment
 drivers under the influence of alcohol or drugs (DUI) and of the impact of highway design exceptions on the frequency
 non-DUI,” Traffic Injury Prevention, vol. 21, no. 1, pp. 7–12, and severity of vehicle accidents,” Accident Analysis & Pre-
 2020. vention, vol. 42, no. 1, pp. 131–139, 2010.
[31] R. C. Gray, M. A. Quddus, and A. Evans, “Injury severity [47] K. Haleem and M. Abdel-Aty, “Examining traffic crash injury
 analysis of accidents involving young male drivers in Great severity at unsignalized intersections,” Journal of Safety Re-
 Britain,” Journal of Safety Research, vol. 39, no. 5, pp. 483–495, search, vol. 41, no. 4, pp. 347–357, 2010.
 2008. [48] M. A. Quddus, R. B. Noland, H. C. Chin, and H. C. Chin, “An
[32] M. S. Shaheed, K. Gkritza, A. L. Carriquiry, and analysis of motorcycle injury and vehicle damage severity
 S. L. Hallmark, “Analysis of occupant injury severity in winter using ordered probit models,” Journal of Safety Research,
 weather crashes: a fully Bayesian multivariate approach,” vol. 33, no. 4, pp. 445–462, 2002.
 Analytic Methods in Accident Research, vol. 11, pp. 33–47, [49] S. Jung, X. Qin, and D. A. Noyce, “Rainfall effect on single-
 2016. vehicle crash severities using polychotomous response
[33] M. Uddin and N. Huynh, “Truck-involved crashes injury models,” Accident Analysis & Prevention, vol. 42, no. 1,
 severity analysis for different lighting conditions on rural and pp. 213–224, 2010.
10 Journal of Advanced Transportation

[50] F. L. Mannering, V. Shankar, and C. R. Bhat, “Unobserved [67] Y. Xie, K. Zhao, and N. Huynh, “Analysis of driver injury
 heterogeneity and the statistical analysis of highway accident severity in rural single-vehicle crashes,” Accident Analysis &
 data,” Analytic Methods in Accident Research, vol. 11, pp. 1–16, Prevention, vol. 47, pp. 36–44, 2012.
 2016. [68] R. B. Hanrahan, P. M. Layde, S. Zhu, C. E. Guse, and
[51] Y. Xiong and F. L. Mannering, “The heterogeneous effects of S. W. Hargarten, “The association of driver age with traffic
 guardian supervision on adolescent driver-injury severities: a injury severity in Wisconsin,” Traffic Injury Prevention,
 finite-mixture random-parameters approach,” Transportation vol. 10, no. 4, pp. 361–367, 2009.
 Research Part B: Methodological, vol. 49, pp. 39–54, 2013. [69] G. Li, E. R. Braver, and L.-H. Chen, “Fragility versus excessive
[52] Y. Xiong, J. L. Tobias, and F. L. Mannering, “The analysis of crash involvement as determinants of high death rates per
 vehicle crash injury-severity data: a Markov switching ap- vehicle-mile of travel among older drivers,” Accident Analysis
 proach with road-segment heterogeneity,” Transportation & Prevention, vol. 35, no. 2, pp. 227–235, 2003.
 Research Part B: Methodological, vol. 67, pp. 109–128, 2014. [70] A. Bener, “The relationship between four-wheel drives and
[53] H. Zhou, C. Yuan, N. Dong, S. C. Wong, and P. Xu, “Severity risky driving behaviours,” International Journal of Medicine
 of passenger injuries on public buses: a comparative analysis
 and Public Health, vol. 4, p. 3, 2014.
 of collision injuries and non-collision injuries,” Journal of
 [71] A. Bener, E. Yildirim, T. Özkan, and T. Lajunen, “Driver
 Safety Research, vol. 74, pp. 55–69, 2020.
 sleepiness, fatigue, careless behavior and risk of motor vehicle
[54] F. Chen and S. Chen, “Injury severities of truck drivers in
 crash and injury: population based case and control study,”
 single- and multi-vehicle accidents on rural highways,” Ac-
 Journal of Traffic and Transportation Engineering (English
 cident Analysis & Prevention, vol. 43, no. 5, pp. 1677–1688,
 2011. Edition), vol. 4, no. 5, pp. 496–502, 2017.
[55] F. Chen, S. Chen, and X. Ma, “Analysis of hourly crash [72] L. Evans, Traffic Safety and the Driver, Science Serving Society,
 likelihood using unbalanced panel data mixed logit model and Washington, DC, USA, 1991.
 real-time driving environmental big data,” Journal of Safety [73] Z. Zheng, P. Lu, and B. Lantz, “Commercial truck crash injury
 Research, vol. 65, pp. 153–159, 2018. severity analysis using gradient boosting data mining model,”
[56] C. F. Manski and D. McFadden, Structural Analysis of Discrete Journal of Safety Research, vol. 65, pp. 115–124, 2018.
 Data with Econometric Applications, MIT Press, Cambridge, [74] X. Zhu and S. Srinivasan, “A comprehensive analysis of
 MA, USA, 1981. factors influencing the injury severity of large-truck crashes,”
[57] J. C. Milton, V. N. Shankar, and F. L. Mannering, “Highway Accident Analysis & Prevention, vol. 43, no. 1, pp. 49–57, 2011.
 accident severities and the mixed logit model: an exploratory [75] G. Fountas, A. Fonzone, N. Gharavi, and T. Rye, “The joint
 empirical analysis,” Accident Analysis & Prevention, vol. 40, effect of weather and lighting conditions on injury severities of
 no. 1, pp. 260–266, 2008. single-vehicle accidents,” Analytic Methods in Accident Re-
[58] K. E. Train, Discrete Choice Methods with Simulation, Cam- search, vol. 27, 2020.
 bridge University Press, Cambridge, UK, 2009. [76] U. Schmucker, R. Dandona, G. A. Kumar, and L. Dandona,
[59] P. T. Savolainen, “Examining driver behavior at the onset of “Crashes involving motorised rickshaws in urban India:
 yellow in a traffic simulator environment: comparisons be- characteristics and injury patterns,” Injury, vol. 42, no. 1,
 tween random parameters and latent class logit models,” pp. 104–111, 2011.
 Accident Analysis & Prevention, vol. 96, pp. 300–307, 2016. [77] M. Kamruzzaman, “Analysis of traffic injury severity in a
[60] M. S. B. Shaheed, K. Gkritza, W. Zhang, and Z. Hans, “A mega city of a developing country,” in Proceedings of the 4th
 mixed logit analysis of two-vehicle crash severities involving a Road Safety International Conference, Sydney, Australia,
 motorcycle,” Accident Analysis & Prevention, vol. 61, March 2013.
 pp. 119–128, 2013. [78] C. J. O’donnell and D. H. Connor, “Predicting the severity of
[61] A. Behnood and F. L. Mannering, “An empirical assessment of motor vehicle accident injuries using models of ordered
 the effects of economic recessions on pedestrian-injury multiple choice,” Accident Analysis & Prevention, vol. 28,
 crashes using mixed and latent-class models,” Analytic no. 6, pp. 739–753, 1996.
 Methods in Accident Research, vol. 12, pp. 1–17, 2016. [79] K. Obeng, “Injury severity, vehicle safety features, and in-
[62] L. Aarts and I. Van Schagen, “Driving speed and the risk of tersection crashes,” Traffic Injury Prevention, vol. 9, no. 3,
 road crashes: a review,” Accident Analysis & Prevention,
 pp. 268–276, 2008.
 vol. 38, no. 2, pp. 215–224, 2006.
 [80] C. Y. Chan, B. Huang, X. Yan, and S. Richards, “Investigating
[63] T. Abegaz, Y. Berhane, A. Worku, A. Assrat, and A. Assefa,
 effects of asphalt pavement conditions on traffic accidents in
 “Effects of excessive speeding and falling asleep while driving
 Tennessee based on the pavement management system
 on crash injury severity in Ethiopia: a generalized ordered
 logit model analysis,” Accident; Analysis and Prevention, (PMS),” Journal of Advanced Transportation, vol. 44, no. 3,
 vol. 71, 2014. pp. 150–161, 2010.
[64] P. Vayalamkuzhi and V. Amirthalingam, “Influence of geo- [81] Y. Li, C. Liu, and L. Ding, “Impact of pavement conditions on
 metric design characteristics on safety under heterogeneous crash severity,” Accident Analysis & Prevention, vol. 59,
 traffic flow,” Journal of Traffic and Transportation Engineering pp. 399–406, 2013.
 (English Edition), vol. 3, no. 6, pp. 559–570, 2016. [82] S. Chen, T. U. Saeed, and S. Labi, “Impact of road-surface
[65] I. Ajzen, “The theory of planned behavior,” Organizational condition on rural highway safety: a multivariate random
 Behavior and Human Decision Processes, vol. 50, no. 2, parameters negative binomial approach,” Analytic Methods in
 pp. 179–211, 1991. Accident Research, vol. 16, pp. 75–89, 2017.
[66] M. Castro, R. Paleti, and C. R. Bhat, “A spatial generalized [83] W. Hao, C. Kamga, and D. Wan, “The effect of time of day on
 ordered response model to examine highway crash injury driver’s injury severity at highway-rail grade crossings in the
 severity,” Accident Analysis & Prevention, vol. 52, pp. 188– United States,” Journal of Traffic and Transportation Engi-
 203, 2013. neering (English Edition), vol. 3, no. 1, pp. 37–50, 2016.
Journal of Advanced Transportation 11

[84] J. R. Klop and A. J. Khattak, “Factors influencing bicycle crash
 severity on two-lane, undivided roadways in North Carolina,”
 Transportation Research Record, vol. 1674, pp. 78–85, 1999.
[85] J.-K. Kim, “Bicyclist injury severities in bicycle–motor vehicle
 accidents,” Accident Analysis & Prevention, vol. 39, no. 2,
 pp. 238–251, 2007.
[86] N.-N. Sze and S. C. Wong, “Diagnostic analysis of the logistic
 model for pedestrian injury severity in traffic crashes,” Ac-
 cident Analysis & Prevention, vol. 39, pp. 1267–1278, 2007.
[87] C.-W. Pai, “Motorcyclist injury severity in angle crashes at
 T-junctions: identifying significant factors and analysing what
 made motorists fail to yield to motorcycles,” Safety Science,
 vol. 47, pp. 1097–1106, 2009.
[88] M. A. Quddus, C. Wang, and I. Stephen, Impact of Road
 Traffic Congestion On Crash Severity Using Ordered Response
 Models. No. 09-0793, American Society of Civil Engineers,
 Reston, VA, USA, 2009.
[89] M. Abdel-Aty, “A study on crashes related to visibility ob-
 struction due to fog and smoke,” Accident Analysis & Pre-
 vention, vol. 43, pp. 1730–1737, 2011.
[90] C. M. Farmer and A. F. Williams, “Temporal factors in motor
 vehicle crash deaths,” Injury Prevention, vol. 11, pp. 18–23,
 2005.
[91] S. Islam and S. L. Jones, “Pedestrian at-fault crashes on rural
 and urban roadways in Alabama,” Accident Analysis & Pre-
 vention, vol. 72, pp. 267–276, 2014.
[92] A. K. Jägerbrand and S. Jonas, “Effects of weather conditions,
 light conditions, and road lighting on vehicle speed,”
 SpringerPlus, vol. 5, pp. 1–17, 2016.
[93] F. Fylan, “Why do people drive when they can’t see clearly?”
 Transportation Research Part F: Traffic Psychology and Be-
 haviour, vol. 56, pp. 123–133, 2018.
[94] E. de Bellis, “Blind haste: as light decreases, speeding in-
 creases,” PLoS One, vol. 13, Article ID e0188951, 2018.
[95] F. Malin, I. Norros, and S. Innamaa, “Accident risk of road
 and weather conditions on different road types,” Accident
 Analysis & Prevention, vol. 122, pp. 181–188, 2019.
[96] B. Dong, X. Ma, F. Chen, and S. Chen, “Investigating the
 differences of single-vehicle and multivehicle accident
 probability using mixed logit model,” Journal of Advanced
 Transportation, vol. 2018, Article ID 2702360, 9 pages, 2018.
[97] V. Shankar, F. Mannering, and W. Barfield, “Statistical
 analysis of accident severity on rural freeways,” Accident
 Analysis & Prevention, vol. 28, pp. 391–401, 1996.
[98] J. A. Bhatti, “Differences in police, ambulance, and emergency
 department reporting of traffic injuries on Karachi-Hala road,
 Pakistan,” BMC Research Notes, vol. 4, pp. 1–7, 2011.
You can also read