Amplification of downstream flood stage due to damming of fine-grained rivers
←
→
Page content transcription
If your browser does not render page correctly, please read the page content below
ARTICLE
                  https://doi.org/10.1038/s41467-022-30730-9                 OPEN

                  Amplification of downstream flood stage due to
                  damming of fine-grained rivers
                  Hongbo Ma 1 ✉, Jeffrey A. Nittrouer 2 ✉, Xudong Fu3 ✉, Gary Parker4,5, Yuanfeng Zhang                                                 6,

                  Yuanjian Wang6, Yanjun Wang3, Michael P. Lamb 7, Julia Cisneros 4, Jim Best 4,5,8,9,
                  Daniel R. Parsons 10 & Baosheng Wu3
1234567890():,;

                  River dams provide many benefits, including flood control. However, due to constantly
                  evolving channel morphology, downstream conveyance of floodwaters following dam closure
                  is difficult to predict. Here, we test the hypothesis that the incised, enlarged channel
                  downstream of dams provides enhanced water conveyance, using a case study from the
                  lower Yellow River, China. We find that, although flood stage is lowered for small floods,
                  counterintuitively, flood stage downstream of a dam can be amplified for moderate and large
                  floods. This arises because bed incision is accompanied by sediment coarsening, which
                  facilitates development of large dunes that increase flow resistance and reduce velocity
                  relative to pre-dam conditions. Our findings indicate the underlying mechanism for such flood
                  amplification may occur in >80% of fine-grained rivers, and suggest the need to reconsider
                  flood control strategies in such rivers worldwide.

                  1 Department of Civil and Environmental Engineering, University of California at Irvine, Irvine, CA, USA. 2 Department of Geosciences, Texas Tech University,

                  Lubbock, TX, USA. 3 State Key Laboratory of Hydroscience and Engineering, Tsinghua University, Beijing, China. 4 Department of Geology, University of
                  Illinois, Urbana-Champaign, IL, USA. 5 Department of Civil and Environmental Engineering, Ven Te Chow Hydrosystems Laboratory, University of Illinois,
                  Urbana-Champaign, IL, USA. 6 Yellow River Institute of Hydraulic Research, Zhengzhou, Henan, China. 7 Division of Geological and Planetary Sciences,
                  California Institute of Technology, Pasadena, CA, USA. 8 Department of Geography and Geographic Information Science, University of Illinois, Urbana-
                  Champaign, IL, USA. 9 Department of Mechanical Science and Engineering, University of Illinois, Urbana-Champaign, IL, USA. 10 Energy and Environment
                  Institute, University of Hull, Hull, UK. ✉email: bigmatton@gmail.com; jeffrey.nittrouer@ttu.edu; xdfu@tsinghua.edu.cn

                  NATURE COMMUNICATIONS | (2022)13:3054 | https://doi.org/10.1038/s41467-022-30730-9 | www.nature.com/naturecommunications                                   1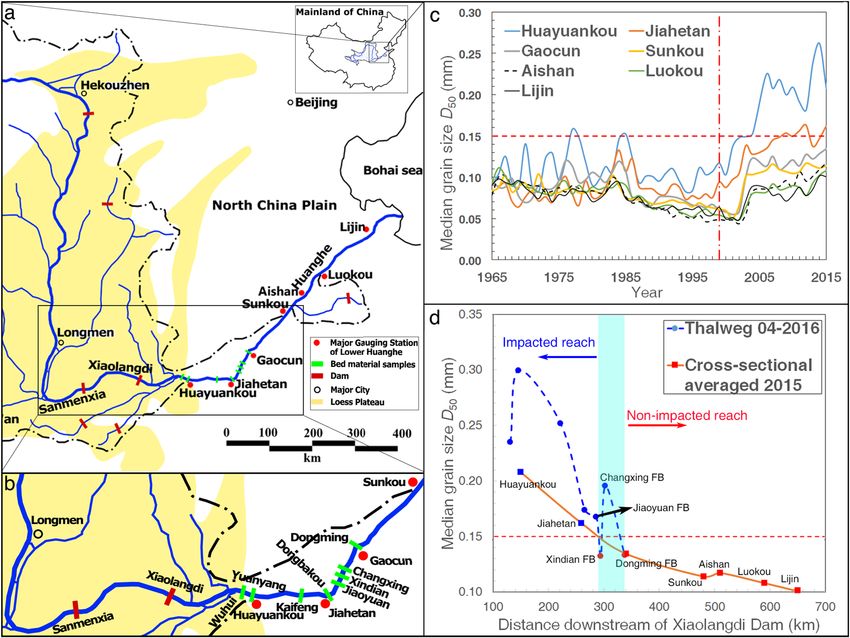
ARTICLE                                                                NATURE COMMUNICATIONS | https://doi.org/10.1038/s41467-022-30730-9

S
       ince the beginning of human civilization, society has                    Bed coarsening after dam construction is a common phe-
       maintained a history of life alongside rivers1, manipulating          nomenon, and found in multiple dammed large rivers worldwide,
       them through installation of dams and reservoirs. This has            e.g., the Missouri-Mississippi River4,19, Colorado River4, and
arisen to control floods, generate energy (e.g., mills, hydropower),          Yellow River18. After dam closure, a wave of bed-coarsening is
facilitate navigation, and secure water resources2. Although there           initiated at the dam site and propagates downstream. The typical
are currently >45,000 large dams (height > 15 m) distributed over            propagation rates of this coarsening wave are estimated to be
140 countries3, the geomorphic disturbances wrought by dams                  10–70 km/yr4,18,19. The time-dependent nature of this process
are not fully understood1,4–6. Moreover, flood-risk evaluations of            allows for testing of rivers currently in a state of transition. The
dammed rivers are difficult to perform, since the fluvial channel is           study site considered herein is the Xiaolangdi Dam (XLD) on the
constantly evolving5,7,8. For the same reason, despite studies               lower Yellow River (LYR), China (Fig. 1), where rapid morpho-
showing river engineering (e.g., built levees, dikes, and other              logical changes since dam closure (1999) have been
impedances to natural flow) can have adverse impacts, including               documented22,31, primarily due to the fine bed material size
a greater flood risk, some of the underlying mechanisms are still             (median grain size < 0.150 mm i.e., silt to fine sand) (Fig. 1b), and
in doubt8–11. This is a non-trivial problem because river flooding            high sediment transport rates32,33. The LYR provides an ideal
is a devastating natural hazard, with the size and frequency of              case study, as it is currently in the process of transitioning in its
events predicted to increase due to climate change (e.g., extreme            grain-size response to damming, and its extensive records provide
precipitation, changing landscape and vegetation coverage1,12–17).           both pre- and post-dam data that include bed material size,
It is thus increasingly necessary to evaluate the safety and stability       channel geometries, and flow depth, stage and discharge—data
of river channels subject to extreme floods, and assess how to                that are not readily available for most of the world’s large rivers.
mitigate risk.                                                               These data enable estimates of changes in bed roughness and flow
   Flood risk is typically evaluated by the flood-water stage:                resistance, and their impact on river stage (see Supplementary
Z = Zb + H [L], where Zb is channel bed elevation [L] and H is               Table S1). We augment these data with multibeam and para-
water depth [L] (Supplementary Fig. S1a). If Z surpasses the                 metric echo sounding bathymetric surveys collected at the upper-
elevation of a levee top, this may lead to the levee being breached,         and lowermost locations on the LYR, which provide direct and
which for large rivers could unleash a potentially devastating               contrasting evidence for changes in bed roughness and flow
flood. One of the benefits of damming river channels is that the               resistance. Lastly, using a global database, we derive a threshold
erosional capability of sediment-depleted flow works to lower Zb              that accounts for water stage amplification, extending to other
downstream of dams5 and thus may decrease water stage and                    fine-grained rivers worldwide.
flood risk6,7. Along with bed degradation, selective entrainment
drives bed sediment coarsening, whereby finer material is dis-
                                                                             Results
proportionally entrained18, and coarser material gradually dom-
                                                                             Bed material coarsening due to dam installation. The median
inates the bed grain-size distribution. In turn, resistance to
                                                                             bed material grain size at seven gauging stations on the LYR
degradation improves over time, and the bed may eventually
                                                                             (Fig. 1a) was measured from samples collected annually over a
reach a quasi-equilibrium elevation4,18–20. In addition to dee-
                                                                             50-yr period beginning in 1965 (i.e., 34 years pre-dam, and 16
pening, c. 46% of dam-impacted rivers exhibit channel
                                                                             years post-dam; see Supplementary Table S1 and Text
widening4,21 due to bank collapse (Supplementary Fig. S1b). It
                                                                             “Hydraulic, cross-section and bed material database” in Meth-
has also been documented that 26% of deepening channels
                                                                             ods). Pre-dam, the variation in median grain-size ranged from
develop a narrower width4, whereby the abandoned channel bed
                                                                             0.04 to 0.15 mm (Fig. 1c), but after completion of the XLD, bed
reverts to floodplain (Supplementary Fig. S1c). Thus, the cross-
                                                                             material size coarsened rapidly at all stations (Fig. 1c). At the
sectional area of the channel enlarges by both deepening and
                                                                             uppermost station, Huayuankou (~150 km downstream of the
widening21 (Supplementary Fig. S1c).
                                                                             XLD), the measured median bed grain size increased to ~0.3 mm.
   The hypothesis that an incised and enlarged channel down-
                                                                             Grain size becomes finer downstream: at Jiahetan, 125 km from
stream of a dam results in lower flood stage, and therefore
                                                                             Huayuankou, median grain size is ~0.15 mm, and stations
reduces downstream flood risk, has been utilized to justify the
                                                                             downstream have beds finer than 0.15 mm (Fig. 1c, d).
development of large dams22,23. However, the fact that channel
                                                                                We focused on thalweg samples for the reach from upstream of
enlargement can trigger changes in flow resistance between pre-
                                                                             Huayuankou to downstream of Gaocun (see Fig. 1b and Text
and post-dam periods is often not considered, but yet can also
                                                                             “Refined bed material surveys” in Methods). The location where
impact the flood-stage elevation. For instance, the water depth
                                                                             thalweg grain size is greater than 0.15 mm is between the
(H) for a given flood discharge (qw) can be formulated in terms of
                                                                             Jiaoyuan Floating Bridge (~290 km from the XLD dam) and
a resistance coefficient (Cf):
                                                                             Gaocun station (~340 km from the XLD). The reach upstream of
                                                                             this is hereafter termed the “impacted reach” (i.e, XLD to
                       H ¼ ðCf =gSÞ1=3 qw 2=3 ;                       ð1Þ    Jiaoyuan Floating Bridge), and also corresponds to where
                                                                             significant changes in pre- and post-dam river morphology and
                                                                             flood characteristics are expected. The reach downstream of
where S is the water surface slope [−], g is gravitational accel-
                                                                             Gaocun remains within the range of pre-dam grain-size variation
eration [LT−2] and qw is flow discharge per-unit width [L2T−1].
                                                                             and is thus termed the “non-impacted reach”, where pre- and
Equation 1 has a mechanistic derivation24–26 where Cf is highly
                                                                             post-dam river morphology and flood characteristics are expected
dependent on bed roughness; specifically, bedform size plays a
                                                                             to be similar. Therefore Huayuankou (the uppermost gauging
key role27–30. Herein we test the hypothesis that the installation of
                                                                             station of LYR), and Lijin (the lowermost gauging station of LYR;
a dam on a fine-grained river (silt-bedded and sand-bedded rivers
                                                                             Fig. 1a) represent impacted and non-impacted reaches respec-
with median bed grain size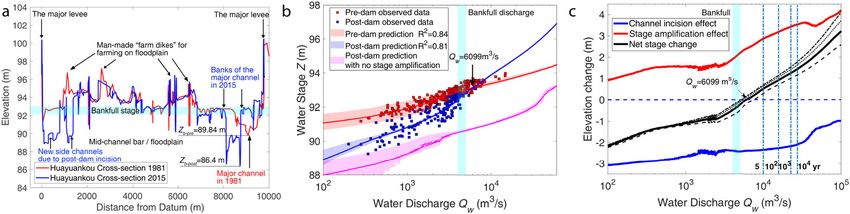
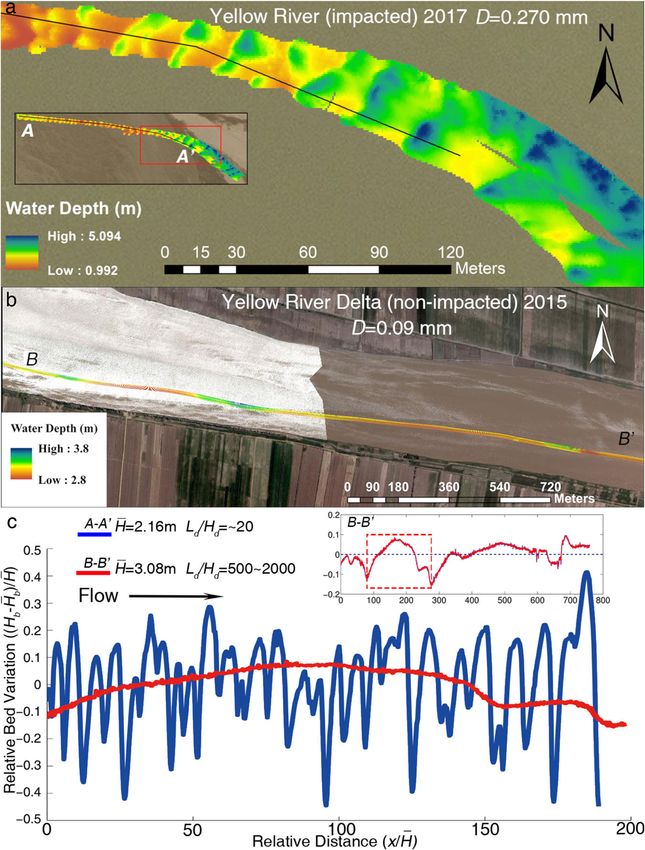
NATURE COMMUNICATIONS | https://doi.org/10.1038/s41467-022-30730-9                                                                         ARTICLE

Fig. 1 Maps of the lower Yellow River (Huanghe), China, and trends in spatio-temporal evolution of bed material grain size. a Map of the lower Yellow
River; b Detailed view of box shown in (a) illustrating locations for sampling of thalweg bed material; c Cross-sectionally averaged bed material grain size,
surveyed at the seven major gauging stations, over a 50-yr period (see locations in (a). Vertical dot-dashed line demarcates the time when the Xiaolangdi
Dam became operative. Horizontal dashed line demarcates the upper bound of bed material (0.15 mm) under pre-damming conditions; d Bed material
grain size for the thalweg of the upper reach of the LYR. The transition between the non-impacted and impacted reaches of the LYR (blue shading) is
located between Jiaoyuan Floating Bridge and the Gaocun gauge station; red markers indicate where median grain-size drops below 0.15 mm.

rivers represent an important, yet still unresolved problem28.                  facts that grain size usually responds first to the disturbance to the
Observations from both natural channels and laboratory experi-                  fluvial system41,42 and that the settling velocity (vs) is sensitive to
ments indicate that as flow strength increases from the initiation               grain size changes (vs ∝ D502~0.5)43. Therefore, for fine-grained
of grain mobility, a lower-stage plane bed or rippled bed (char-                rivers, bed sediment size is a more important factor than potential
acterized by relatively little sediment transport) develops; addi-              change in shear velocity after damming.
tional bed shear stress produces dunes34, and eventually, with                     The relation developed from the analysis of bedform height
sufficient stress, the bed transitions from a dune field (with                    and suspension number (Fig. 2) predicts that the bed grain-size
maximum bedform heights of ~1/3 of the flow depth) to an upper                   differences measured at Huayuankou and Lijin should corre-
stage plane bed, passing through a stage of dune washout (i.e.,                 spond to different bedform geometries, and in turn, variable bed
bedform height much  0.8) for reasons discussed below. This                   large dunes, thus leading to an upper stage plane bed. In addition,
quantitative relation shows convincing predictability compared to               the high Froude number (Fr) may also result in such a transition,
existing models (Supplementary Fig. S2 and Supplementary                        which represents the effect of the interaction between surface
Table S4). The database has a grain size range 0.13–36 mm, with a               waves and bedform geometry. Both factors exert significant
focus on finer-grained channels (D50 < 2 mm), which comprise                     controls on bedform shapes40,44,45. Recent studies, including
~80% of the data. We assess that bed coarsening after damming                   flume experiments27,35,46, field observations47, and theoretical
leads to a drop in the suspension number (u*/vs), based on the                  analyses48, demonstrate that sediment suspension represented by

NATURE COMMUNICATIONS | (2022)13:3054 | https://doi.org/10.1038/s41467-022-30730-9 | www.nature.com/naturecommunications                                   3
ARTICLE                                                                                               NATURE COMMUNICATIONS | https://doi.org/10.1038/s41467-022-30730-9

                               100                                                                        abrupt change; see Supplementary Fig. S2) between silt- and
                                                                      Max bedform height u*/vs =1.1
                                                                                                          sand-bedded rivers. It is possible that the bedforms with large
                                                                                                          aspect ratio in silt- and sand-bedded rivers maintain very long
    Relative Roughness Hd /H

                                                                                                          wavelengths (Fig. 3) that cannot be captured by experimental
                                                                                                          studies. The development of an extensive dune field at
                                                                                                          Huayuankou, compared to the relatively flat bed at Lijin,
                                                                                                          therefore supports the hypothesis that dam-induced bed
                               10-1                                                                       coarsening can play an important role in establishing large dune
                                                                                                          fields, which ultimately change the roughness structure and alter
                                                                                                          flow resistance and depth.
                                              Global database
                                                2
                                              R =0.6; RMSE=1.64

                                                                                                          Changes in the resistance relation and flood stage after dam-
                                              Non-impacted reach
                                              Impacted reach             Bed coarsening
                                              PI 50%
                                              PI 90%
                                                                                                          ming. As the resistance relation (Eq. 1) pertains to steady and
                               10-2
                                                                                                          uniform (normal) flow50,51, a dataset of normal flow and equi-
                                 10-1                           100                             101       librium sediment transport conditions was selected from
                                              Suspension Number u*/vs                                     hydraulic data collected by local hydrological stations (Supple-
                                                                                                          mentary Table S1 and Text “Equilibrium database on hydraulic
Fig. 2 Relation between relative bedform (roughness) height and                                           and sediment transport” in Methods), and used to establish a
suspension number. A comprehensive database (gray squares), including                                     reference value for flow resistance (Fig. 4a). The change in the
both laboratory and field data, is compiled to determine the hump-shaped                                   resistance coefficient (Cf) between pre- and post-dam conditions
relation (solid line) between relative bedform height and suspension                                      at Huayuankou (Fig. 4a) shows a mean post-damming Cf value of
number, where Hd is dune height [L], H is water depth [L], u* is shear                                    0.0046 (reaching as high as 0.01), which is three-fold greater than
velocity [LT−1], and vs is the sediment settling velocity [LT−1]. Although                                the pre-dam value of 0.0015. Notably, the post-damming Cf at
such hump-shaped relations are well recognized27,29,30, a well-tested                                     Huayuankou is comparable to values for typical sand-bedded
quantitative relation remains lacking heretofore. The proposed relation,                                  rivers52. Uncertainty in the resistance coefficient may result from
based on a parabolic equation in logarithmic space,                                                       the multi-threaded channel pattern at Huayuankou. When
log10Y = −0.87(log10X − 0.03)2 − 0.53, shows a good fit and covers a wide                                  examined together, the pre- and post-damming resistance coef-
range of laboratory and field data. The comparison among the proposed                                      ficients agree with the hump-shaped curve resulting from the
relation, the compiled database and other relations are given in                                          compiled global database (Fig. 4b). It is prudent to note that, due
Supplementary Fig. S2. Field observations of bedform heights in the dam-                                  to a lack of data in the range of suspension number from 3 to 10,
impacted (blue squares) and non-impacted reach (red squares) of the                                       the empirical relation developed from the global database could
lower Yellow River (LYR) agree with the proposed relation very well. The                                  not claim applicability to this range until data from the LYR are
squares represent the mean value of relative bedform height and error bars                                used to confirm it. Independently verified data from the LYR thus
represent one standard deviation. In particular, the observed data from the                               quantify a previously-untested region of the relation up to a
non-impacted reach of the LYR quantify a previously-untested region of the                                suspension number of 10. There is a strong similarity in the
proposed relation. As shown in Supplementary Table S3, the difference in                                  hump-shaped relations for relative bedform height (Fig. 2) and
suspension number (and thus bedform geometry) in the impacted and non-                                    resistance coefficient (Fig. 4b). The threshold suspension number
impacted reaches results mainly from bed coarsening. The hump-shaped                                      corresponding to maximum relative dune height (1.1) and max-
relation indicates that if the bankfull suspension number is greater than a                               imum resistance (0.9) are also very close, again supporting the
suspension number corresponding with the dune-size maximum (~1.1 via                                      hypothesis that the change in bedform geometry impacts channel
present model; vertical blue dashed line), bed coarsening induced by                                      resistance significantly.
damming on the river will result in larger dunes during floods. Dashes and                                    The mean values of Cf are used to represent the average
dashed-dotted lines represent the 50% and 90% prediction intervals (PI)                                   resistance conditions for pre- and post- damming. Substituting
of the present model, respectively.                                                                       mean Cf values into Eq. 1 and using the average channel slope at
                                                                                                          Huayuankou (S = 3 × 10⁻⁴), the theoretical predictions agree well
                                                                                                          with field measurements of water depth at Huayuankou (Fig. 4c).
the suspension number in fine-grained rivers is the predominant                                            Importantly, the post-damming water depth for a given flood
control on bedform geometry and their state transition, because                                           discharge (per-unit-width) qw, increases on average by a factor of
these systems typically maintain low Fr (Fr ≪ 0.8).                                                       1.4. In the extreme scenario (i.e., Cf = 0.01), the increase is a
   To further test the assessment that bedform morphology varies                                          factor of 2.0, which is an occurrence that will become more
significantly with suspension number in the dammed river, we                                               frequent as the bed continues to coarsen (i.e., relation in Fig. 4b).
measured bedform geometry at Huayuankou (Figs. 3a, S3) and                                                Meanwhile, the water depth in the non-impacted reach of the
Lijin (Figs. 3b, S3) (see Text “Channel bathymetric surveys” in                                           LYR (Lijin), where grain size remains similar to the pre-dam
Methods). While the channel bed at Lijin (non-impacted) is                                                condition, shows no change (Supplementary Fig. S4). Bed
relatively flat (maintaining a bedform height relative to flow                                              coarsening thus coincides with increasing dune size and rough-
depth much
NATURE COMMUNICATIONS | https://doi.org/10.1038/s41467-022-30730-9 ARTICLE
Fig. 3 Bedform geometry for the present-day Yellow River. a Multibeam echosounder (MBES) map of periodic, high-relief dunes (Ld/Hd ~ 20 and
Hd =H ~ 40.81% ± 12.72%, where Ld and Hd are wavelength and wave height of bedforms [m], respectively and H is the average water depth [m]). These
bedforms are found in abundance at Huayuankou, just downstream of Xiaolangdi Dam (see Supplementary Fig. S3 and Supplementary Table S3); b Low-
relief bedforms (Ld/Hd ~ 500–2000 and Hd =H ~ 5.51% ± 3.26%) near Lijin, where bed sediment size is not impacted by the XLD dam; c Longitudinal profiles
through the bedforms from the two studied reaches derived from the MBES maps. Hb and H represent the bed elevation along the transect and average
b
bed elevation of the survey area, respectively. The fine-grained channel of the non-impacted downstream reach is characterized by low-relief bedforms,
while the channel bed of the dam-impacted reach possesses high-relief dunes typical of sand-bedded rivers. The presence of low-relief bedforms is the
primary reason for a lower flow resistance.
than 20 years of cross-section data (1981–1990 for pre-dam and If it is assumed that the relation H(qw) is unchanged (i.e., no
2006–2015 for post-dam) were collected to assess stage change flood-stage amplification effect), then bed degradation would
pre- and post-damming. Flood stages of each event were produce ~3.0 m lowering of flood stage (i.e., pink line in Fig. 5b).
computed based on measured cross-sectional shape for each However, the field data (blue) indicate that flood stage for the
year, using the theoretical resistance relation (Text “Hydraulic post-dam condition fell little for small flood events (e.g., pre-dam
prediction for the flow stage based on observed cross-sections” in bankfull discharge 4000 m3 s−1). Furthermore, for moderate and
Methods). The model has no adjustable parameters, nor are Qw or large floods, the post-damming stage is amplified, surpassing the
Z used to calibrate any parameter. Figure 5b shows theoretical pre-damming stage at a discharge of Qw = 6099 m3 s−1 (95% CI
predictions and observed data for different flood flow discharges [4847, 7889]), which represents a flood event less than the 5-yr
(see Fig. S6 for a one-by-one comparison). The general trends of recurrence interval flood (10,000 m3 s−1) at Huayuankou53.
the Qw–Z relations are shown as pre-dam (red) and post-dam Channel bed degradation, as a long-term accumulative effect
(blue). The post-dam Qw–Z relation without any effects of stage induced by dams, lowers flood stage by a slowly-varying value
amplification produced by resistance enhancement is also with respect to water discharge (blue line in Fig. 5c), whereas
indicated (pink). Cross-section variations are included via the enhanced resistance works as a multiplier (Eq. 1) to amplify flood
flood-stage confidence intervals corresponding to flood discharge. stage (e.g., red line in Fig. 5c). Hence, as the net result of both
NATURE COMMUNICATIONS | (2022)13:3054 | https://doi.org/10.1038/s41467-022-30730-9 | www.nature.com/naturecommunications 5ARTICLE NATURE COMMUNICATIONS | https://doi.org/10.1038/s41467-022-30730-9
a b 10-1 c 6
Max Resistance u*/vs =0.9 Cf =0.0015
10-2 Bed coarsening
Cf =0.0046
5 Cf =0.01
Resistance Coefficient Cf
Resistant Coefficient Cf
Pre-dam at Huayuankou
Water depth H (m)
Post-dam at Huayuankou
10-2 4
3
10-3 Cf=(4.6 3.1) 10-3
10-3 2
-3 Global
2
database
Cf=(1.5 0.86) 10 R =0.44; RMSE=1.55
PI 95% 1
PI 50%
Huayuankou post-damming
Huayuankou pre-damming
10-4 10-4 0
Pre-dam Post-dam 10-1 100 101 100 101
Suspension Number u*/vs Flow discharge per unit width qw (m2 /s)
Fig. 4 Adjustment of flow resistance coefficient Cf at the impacted reach of the Yellow River, before and after construction of the XLD dam, and its
subsequent impact on flood-water depth. a The average value of Cf in the post-damming bed roughness state is three times that for the typical pre-damming
state at Huayuankou, the impacted reach of the Yellow River. Elements of the box-plot include: center line, mean value; box limits, upper and lower quartiles;
whiskers, max and min values; b Relation between resistance coefficient and suspension number. The resistance coefficient at Huayuankou under pre- and post-
damming conditions agrees well with the proposed hump-shaped relation, e.g., log10Y = −1.75(log10X + 0.066)2 − 1.91; c Comparison of H-qw relations at the
impacted reach of the Yellow River before and after dam construction. The figure illustrates the theoretical relation H = (Cf/gS)1/3qw2/3 with Cf values inferred in
(a), and independent field data collected at Huayuankou, for both pre- and post- dam conditions. The blue solid line, using averaged post-damming Cf = 0.0046,
shows H is 1.4 times greater than pre-damming; blue dashed line, using the maximum post-damming Cf = 0.01, illustrates H is 2.0 times greater than pre-damming.
Comparison of H-qw relations at the non-impacted reach of the Yellow River (Lijin) before and after dam construction is shown in Supplementary Fig. S4.
Fig. 5 Evaluation and comparison of the overall flood stage for pre-dam and post-dam conditions. a Cross-sectional profiles for pre-dam and post-dam
conditions at the Huayuankou gauging station; b Pre- and post- dam flood stage and flood discharge. The red solid line is the theoretical prediction for the
pre-dam flood stage based on observed cross-sections and Eq. 1 with Cf from Fig. 4b (see Text “Hydraulic prediction for the flow stage based on observed
cross-sections” in Methods), and the red shaded area indicates the 95% confidence interval of the prediction uncertainty induced by the pre-dam cross-
section variation. The blue solid line is the theoretical prediction for the post-dam flood stage, with the blue shaded area indicating the 95% confidence
interval of the prediction uncertainty induced by the post-dam cross-section variation. The pink solid line is the theoretical prediction for the post-dam
flood stage based on the post-dam cross-sections (including considerations of channel widening and bed incision) without consideration of the stage
amplification effect (grain size and bedform size unchanged). c Water stage elevation changes produced by various effects. The blue solid line represents
the stage elevation change induced solely by channel incision (enlargement) without consideration of the stage amplification effect. The red solid line
represents the stage amplification effect. The black solid line represents the net effect of stage amplification effect and channel enlargement effect
(D50 = 0.30 mm). The black lines from right to left (dash, solid, dot, dot-dash) represent D50 = 0.25, 0.30, 0.35, 0.40 mm, respectively. Correspondingly,
the crossing-point discharges, where post-dam stages surpass the pre-dam values, are 7571, 6099, 5469, and 5164 m3 s−1, respectively. Coarser beds lead
to a smaller crossing-point discharge. Dot-dash vertical lines represent the flood discharges at different recurrence intervals (5, 102, 103, 104 yr).
effects, with increasing water discharge, flood stage (post- future bed coarsening will exacerbate the post-dam channel
damming) gradually catches up with, and ultimately surpasses, conveyance. Specifically, as D50 = 0.25, 0.30, 0.35, 0.40 mm, the
the pre-damming discharge stage (black line in Fig. 5c). It is corresponding crossing-point discharges are 7571 m3 s−1 (95% CI
because of this multiplier effect that, despite the magnitude of bed [5696, 9550]), 6099 m3 s−1 (95% CI [4847, 7889]), 5469 m3 s−1
incision, resistance enhancement generated by larger dunes (95% CI [4408, 7022]) and 5164 m3 s−1 (95% CI [4165, 6618]),
formed in a coarser-grained bed will generate a “crossing point”, respectively. Hence, as the bed of the LYR continues to coarsen,
whereby post-damming flood discharge exceeds the flow stage of any flood discharge greater than the 5-yr recurrence interval
the equivalent discharge pre-damming condition. Continuous (10,000 m3/s) will generate a river stage that surpasses the pre-
bed degradation will further enhance bed coarsening. Therefore, damming value, despite 3.44 m of bed degradation (as measured
we perform a sensitivity analysis (Fig. 5c) to test the impact of a at Huayuankou) since completion of the XLD. We acknowledge
continuously coarsening bed. The crossing-point water discharge, that XLD water regulation causes flood discharges greater than
whereby the post-dam stage surpasses the pre-dam stage, the pre-dam bankfull value (4000 m3 s−1) to be relatively rare.
decreases consistently with the coarser bed grain size due to the However, such events do occur, as was demonstrated recently
intensification of the stage amplification effect, suggesting that (October, 2021). It is only a matter of time before the LYR
6 NATURE COMMUNICATIONS | (2022)13:3054 | https://doi.org/10.1038/s41467-022-30730-9 | www.nature.com/naturecommunicationsNATURE COMMUNICATIONS | https://doi.org/10.1038/s41467-022-30730-9 ARTICLE
properly documented, whereby data beyond simple mean values
are reported, including for example, standard deviation (as used
in Fig. 2) or, preferably, full distributions of dune height28
(Supplementary Fig. S3). Existing relations between bedform size
and hydraulic/transport parameters, including Froude number,
suspension number and/or shear stress, are also subject to large
uncertainties, partially due to the complexity of bedform geo-
metry in natural rivers28. These factors also underline the chal-
lenge of reproducing silt-bedded bedforms in laboratory
experiments32. A relation with less uncertainty would be facili-
tated by better documentation of bedform geometry (e.g., leeface
angle)28,39,57–60, incorporating physically the surface wave effect
(Froude number) and water depth variation40, and/or by asses-
sing the impact of high sediment concentration61,62 and bedform
superimposition59. Our observations (Figs. 2, 4b), combined with
previous studies27,40, show that uncertainties can be constrained
for a specific setting, and that the performance of the relation is
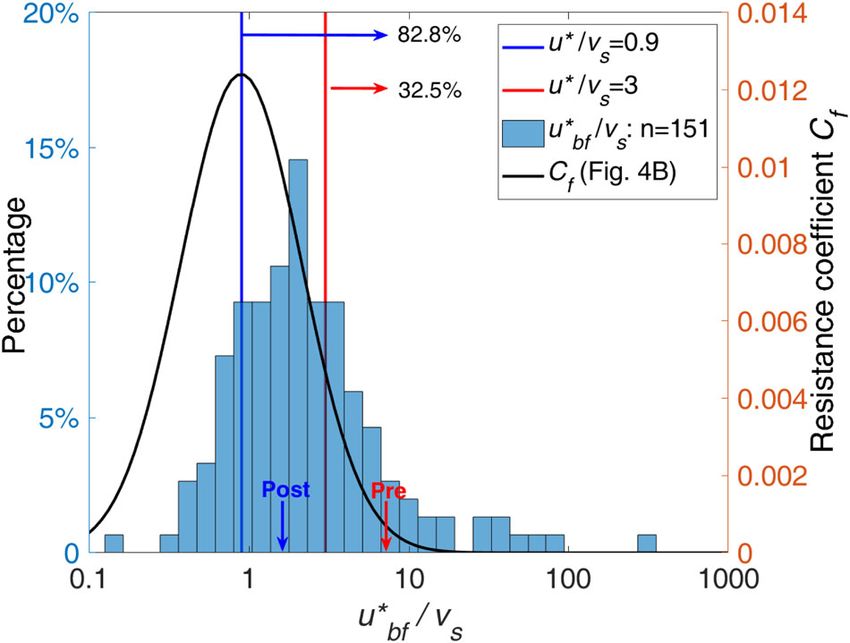
Fig. 6 Distribution of bankfull suspension numbers for fine-grained rivers improved by additional field data.
worldwide. The vertical blue solid line represents the suspension number Previous studies have reported the possibility of both reduc-
corresponding to the maximum resistance coefficient/dune size, obtained tions and increases in flood stage due to fluvial morphological
in the present study. This shows that 82.8% of fine-grained rivers maintain changes caused by human activities63,64. Studies showing an
a bankfull suspension number greater than 0.9, indicating that for the increase in flood stage have attributed this to the reduction in
majority of fine-grained rivers worldwide, bed coarsening will enhance dune cross-sectional flow area due to loss of the channel-floodplain
size and thus flow resistance, so as to amplify flood stage. The vertical red complex8,63, as well as to the addition of spur dikes and other
solid line represents the suspension number (3.0) corresponding to infrastructure that could contribute to channel roughness64,65.
borderline of silt-sand-bedded rivers (32.5% of fine-grained rivers For the lower Yellow River, however, river training projects were
worldwide), such as the Yellow River, where a bed coarsening process can implemented before construction of the XLD66,67 and therefore
act far more quickly over a short time scale, indicating a quick and strong do not explain the sudden change in bed material grain size
flood amplification effect. Arrows on the x-axis indicate pre- and post- (Fig. 1b, d), the development of bed roughness (Fig. 3), or
damming conditions of the lower Yellow River. increase in resistance (Fig. 4). Moreover, the implementation of
river training projects such as spur dikes are relatively non-
intrusive, with the aim to protect the bank and guide flow. In
experiences sufficiently large floods, during which the down- addition, the cross-sectional area of the channel increases due to
stream stage is unintentionally amplified, surpassing the pre-dam bed erosion, so that neither loss of cross-sectional area nor the
flood stage. construction of river training projects necessarily contributes to
the increase in flood stage. The analysis herein thus demonstrates
that damming is the independent factor resulting in increased
Discussion flood stage, because it drives bed coarsening, development of
The model proposed herein for bedform height and suspension dunes, and enhanced overall flow resistance. It should be noted
number, developed from extensive data collected from flume and that dune fields can develop over the entire channel bed49, so
field settings, is substantiated and extended by data from one of that they may exert more flow resistance than river training
the world’s largest dam-impacted fine-grained rivers, the lower projects, indicating a potentially stronger control on flood-stage
Yellow River (LYR). Furthermore, the new model quantitatively amplification. Amplification of flood stage due to damming
outperforms other similar relations (Figs. 2, 4b, S2; Supplemen- has rarely been considered in flood-risk assessment, and thus
tary Tables S4, S5)27,29,30. The insight gained from this model is our findings call for a careful evaluation of dam-impacted
that for rivers where u*/vs > 0.9, bed sediment coarsening is rivers where incremental increases in flood stage have been
expected to produce adjustments in dune size and increase flow observed, but nevertheless could have been attributed to other
resistance, which leads to an amplified flood stage. For u*/vs factors8,11,64,65.
values slightly greater than 0.9, the flood amplification effect will It is difficult to overstate the importance of dams in terms of
not be as obvious, or emerge as quickly, as compared to the LYR flood control. In many river basins, reservoirs are of critical
example. A global database of river bankfull hydraulic geometry importance for attenuating flood waves, and thus reducing flood
(see Text “Global Bedform Database” in Methods)54–56 is used to peaks. Despite the fact that dams and reservoirs may reduce flood
demonstrate that ~83% of fine-grained rivers are susceptible to magnitude, the unanticipated loss of the flood-retaining capacity
amplification of flood stage (Fig. 6). Moreover, ~32.5% of fine- of the channel due to resistance enhancement can partially or
grained rivers are expected to behave similarly to the LYR, completely offset efforts to reduce flood risk. Specifically, bed
whereby bed coarsening due to damming could evolve rapidly material coarsening and associated enhancement of flow resis-
due to the erosion of silt and very-fine sand32,33 (Fig. 6). These tance may worsen flood risk by amplifying flood stages when
results indicate the possible widespread existence of the phe- water impoundment in the reservoir is less effective during
nomenon of degradation-induced flood-stage amplification. extreme floods. In the case of the lower Yellow River, if the
Uncertainties remain surrounding field observations used to resistance coefficient, Cf, increases by a factor of three (Fig. 4a),
generate the predictive relation for bedform size, particularly for this necessitates that the Xiaolangdi Dam pffiffiffibe operated so as to
silt-sand-bedded rivers28 (Fig. 2). For example, bedforms of silt- reduce its peak discharge by 57.7% (1= 3) to achieve a flood
and sand-bedded rivers are irregular32, so proper coverage in the control similar to the pre-damming condition. The stark impli-
longitudinal direction is necessary to capture accurate wavelength cation of this finding is that, during large floods, fine-grained
and height information. Additionally, uncertainties should be channels downstream of dams should not be expected to operate
NATURE COMMUNICATIONS | (2022)13:3054 | https://doi.org/10.1038/s41467-022-30730-9 | www.nature.com/naturecommunications 7ARTICLE NATURE COMMUNICATIONS | https://doi.org/10.1038/s41467-022-30730-9
as effectively as the corresponding pre-dam channel in terms of flood mitigation near many large, lowland rivers, depends on the
routing flood water. ability of dams to attenuate, and not amplify, river floods.
It is fortunate that the effect of flood-stage amplification has
not yet created a major flood on the LYR. For the past two Methods
decades, the Yellow River catchment has been unusually dry68 S1. Hydraulic, cross-section and bed material database. Since the 1950s,
and the Xiaolangdi Reservoir has worked to effectively damp hydrologic surveys have been conducted routinely on the lower Yellow River (LYR),
whereby substantial hydraulic data are collected, including water depth, surface slope,
floods. However, climate models predict that precipitation in the and flow velocity, as well as cross-sectional geometry and bed material grain size. At
Yellow River catchment will increase by 10 to 30% in the coming present, the hydrological stations operated by the Hydrological Bureau of the Yellow
century69. Since our analysis shows an intensification of flood- River Conservancy Commission collect water discharge and sediment concentration
stage amplification during large and extreme floods (Fig. 5b, c), as daily. Water surface slope is collected based on the stage differences at two referenced
precipitation increases, such effects may emerge as a significant stage recorder stations on a relatively straight reach of the river, but the frequency of
collections is lower than daily. Bed material samples are collected monthly, with a
unintended consequence of damming. Meanwhile, the large greater frequency during the flood season. Cross-sectional surveys are conducted at
amount of sediment input from the Loess Plateau has reduced least twice per year, with one before and one after the flood season. Water velocity and
capacity of the Xiaolangdi Reservoir to below 25% in just 20 sediment concentration measurements are collected at approximately 5 profiles or
years. For the coming decades, large floods combined with a lack more per cross-section; for each profile, 3–5 velocity and water-sediment samples are
taken to estimate the average velocity and sediment concentration. An acoustic
of storage capacity could render the 88 million people living Doppler current profiler (ADCP) is used for water discharge measurements when the
alongside the lower Yellow River at risk of severe flooding. sediment concentration is low; otherwise, a mechanical velocimeter is used for
The effect of water and sediment from river tributaries on bed velocity measurements (which are subsequently converted to discharge). Multiple bed
coarsening and flood amplification is not explicitly considered material samples are taken from the channel bed at the hydrologic station cross-
sections; the reported grain size is the average value over the cross-section. Daily
herein. However, the relevant analyses are straightforward within water discharge, average sediment concentration, water surface slope, cross-section
the proposed framework. The variation of bed grain size depends geometry, and average bed grain size are published by the Hydrological Bureau of
on the competition between fine-grained sediment supply from Ministry of Water Resources of China. The detailed standards can be found in ref. 71;
tributaries (or the reservoir itself) and bed coarsening caused by these generally comply with those used internationally72.
We used hydraulic and cross-section information from the 1980s, because in
clear-water releases. With appropriate constraints on bed grain the 1990s extensive water usage by communities along the LYR, for agricultural,
size and modeling efforts18,19, the relation in Fig. 4b can be used industrial and municipal purposes, greatly reduced river runoff, triggering fine
to quantitatively determine potential flood amplification due to sediment deposition and associated bed aggradation. As a consequence, the data
changes in bed grain size. One scenario that requires particular from the 1990s are not an accurate representation of natural pre-damming states,
attention is bed coarsening combined with a large flood from and are thus purposely excluded. We instead use the hydraulic and cross-sectional
data from the 1980s to represent pre-dam conditions, so enabling a fair
downstream tributaries, whereby the reservoir has no ability to comparison.
attenuate the flood wave. Such a scenario is not out of the realm
of possibility: in the summer of 2020, the lower Yangtze River, S2. Refined bed material surveys. Since only cross-sectionally averaged grain size
China, experienced an unprecedented monsoon season70, is published, and since the hydrologic stations are distant from each other
whereby a major flood originated from tributaries downstream of (~100 km), bed material surveys based on a refined grid were conducted to
the Three Gorges Dam. A similar scenario occurred along the determine the location where the Xiaolangdi Dam has impacted the bed. These
surveys were conducted on floating bridges over the lower Yellow River, which are
lower Yellow River in the summer of 2021, whereby an unfore- typically spaced 10–20 km apart. For each cross-section, 3–5 cores are collected
seen flood formed from the tributaries downstream of the Xiao- with a tripod deployed from a survey boat or from the floating bridges. The core
langdi Dam due to extreme local precipitation (historically, the lengths range from 0.7 to 2.0 m, and samples along each core were taken every
second largest). The contribution of tributary water input to 0.1 m. For the purpose of our study, we only use the sediment samples collected
from the bed surface of the channel thalweg, whose location is roughly determined
flood-stage amplification, and associated risk factors, merits fur- by the line of greatest water surface flow velocity. The bed-surface sediment sample
ther studies. from the channel thalweg is usually the coarsest among those of all cores across one
We summarize our findings hereinafter. Coarsening of the bed cross-section. The median grain sizes of the surface sediment samples in the
material in the lower Yellow River has developed due to erosion thalweg are presented in Fig. 1d. In a dynamic river such as the LYR, local grain
size of the bed material may fluctuate due to changing contributions from eroded
of the channel bed downstream of the Xiaolangdi Dam (XLD). in-channel bars and banklines, as well as due to varying upstream/tributary sedi-
This coarsening coincides with a fundamental change in the ment input. The grain-size variability from Xindian, via Changxing, to Dongming
stable state of bedforms on the riverbed, yielding dune config- may be associated with these conditions, which would temporarily supply fine
urations with heights and aspect ratios akin to other large, low- sediment to the thalweg at Xindian.
land sand-bedded rivers. This, in turn, increases bed roughness
and raises the resistance coefficient by a factor of 3 (i.e., from S3. Equilibrium database on hydraulic and sediment transport. The equili-
brium database was selected from the extensive hydrologic data collected from the
0.0015 to 0.0046), which amplifies the flood-water depth for a LYR using the follow criteria: (1) water discharge, sediment concentration, water
given water discharge (per-unit width) by a factor of 1.4 to 2.0. surface slope, and the grain-size distribution of both suspended sediment load and
This is evidenced by field data collected downstream of the XLD: bed material must be available at the same time (i.e., temporally consistent); (2) the
despite 3.44 m of channel bed degradation (and channel widen- water surface elevation, water discharge and sediment concentration must be stable
ing), the flood stage of the impacted channel bed at Huayuankou for at least 2 h, so as to be deemed in equilibrium (i.e., steadiness); and (3) at
similar discharges, sediment concentration and hydraulic factors must be com-
has decreased minimally for small (yearly) flood events. However, parable (i.e., repeatability). When these conditions were found to be satisfied, the
for moderate to large floods (i.e., >5-yr recurrence interval), flood pre-damming and post-damming databases were compiled and used to compare
stage is predicted to be greater than the pre-dam channel, despite changes in hydraulic conditions32,33.
substantial bed erosion, and thus flood risk is also higher.
A simple model shows that this phenomenon of dam-induced S4. Channel bathymetric surveys. A Multibeam Bathymetric Echo Sounder
flood-stage amplification exists in ~80% of fine-grained rivers (MBES)49 and Parametric Echo Sounder (PES) were used for channel bed surveys
on the LYR73,74. At Lijin, two MBES surveys were conducted during a flood flow in
(bed grain sizeNATURE COMMUNICATIONS | https://doi.org/10.1038/s41467-022-30730-9 ARTICLE achieve complete coverage (for example, in order to produce the bed topography by the effect of an increase in post-damming resistance caused by bed coarsening data presented herein, we suffered multiple strandings with damage to our boat and and enhancement of roughness (Supplementary Fig. S9). This indicates that the instruments). Besides, the need for additional coverage in portions of the river flood conveyance is only increased for small floods, but significantly reduced by the
ARTICLE                                                                          NATURE COMMUNICATIONS | https://doi.org/10.1038/s41467-022-30730-9

27. Bradley, R. W. & Venditti, J. G. Transport scaling of dune dimensions in           58. Lefebvre, A., Paarlberg, A. J. & Winter, C. Characterising natural
    shallow flows. J. Geophys. Res. Earth Surf. 124, 526–547 (2019).                        bedform morphology and its influence on flow. Geo-Mar. Lett. 36, 379–393
28. Cisneros, J. et al. Dunes in the World’s big rivers are characterized by low-          (2016).
    angle leeside slopes and a complex shape. Nat. Geosci. 13, 156–162 (2020).         59. Best, J. et al. Why do large, deep rivers have low-angle dune beds?: comment.
29. Karim, F. Bed configuration and hydraulic resistance in alluvial-channel flows.          Geology 48, e50 (2020).
    J. Hydraul. Eng. ASCE 121, 15–25 (1995).                                           60. Hendershot, M. L. et al. Response of low-angle dunes to variable flow.
30. van Rijn, L. C. Sediment transport, part III: bed forms and alluvial roughness.        Sedimentology 63, 743–760 (2016).
    J. Hydraul. Eng. 110, 1733–1754 (1984).                                            61. Moodie, A. J. et al. Suspended-sediment induced stratification inferred from
31. Ma, Y. X., Huang, H. Q., Nanson, G. C., Li, Y. & Yao, W. Y. Channel                    concentration and velocity profile measurements in the lower Yellow River,
    adjustments in response to the operation of large dams: the upper reach of the         China. Water Resour. Res. 56, e2020WR027192 (2020).
    lower Yellow River. Geomorphology 147, 35–48 (2012).                               62. Baas, J. H., Best, J. L. & Peakall, J. Predicting bedforms and primary current
32. Ma, H. et al. The exceptional sediment load of fine-grained dispersal systems:          lamination in cohesive mixtures of mud and sand. J. Geol. Soc. 173, 12–45
    example of the Yellow River, China. Sci. Adv. 3, e1603114 (2017).                      (2016).
33. Ma, H. et al. Universal relation with regime transition for sediment transport     63. Pinter, N. One step forward, two steps back on U.S. floodplains. Science 308,
    in fine-grained rivers. Proc. Natl Acad. Sci. 117, 171–176 (2020).                      207–208 (2005).
34. Guy, H. P., Simons, D. B. & Richardson, E. V. Summary of alluvial channel          64. Pinter, N. & Heine, R. A. Hydrodynamic and morphodynamic response to
    data from flume experiments, 1956-61. Geological Survey Professional Paper              river engineering documented by fixed-discharge analysis, Lower Missouri
    462-1 (US Gov Print Office, Washington, 1966).                                          River, USA. J. Hydrol. 302, 70–91 (2005).
35. Naqshband, S. et al. A sharp view on river dune transition to upper stage plane    65. Remo, J. W. F. & Pinter, N. Retro-modeling the Middle Mississippi River. J.
    bed. Geophys. Res. Lett. 44, 437–11,444 (2017).                                        Hydrol. 337, 421–435 (2007).
36. Bridge, J. S. & Best, J. L. Flow, sediment transport and bedform dynamics over     66. Wu, B., Wang, G., Ma, J. & Zhang, R. Case Study: River Training and Its
    the transition from dunes to upper stage plane beds. Sedimentology 35,                 Effects on Fluvial Processes in the Lower Yellow River, China. J. Hydraulic
    753–764 (1988).                                                                        Eng. 131, 85–96 (2005).
37. Saunderson, H. C. & Lockett, F. P. Flume experiments on bedforms and               67. Yellow River Institute of Hydraulic Research (YRIHR), Evolving mechanism of
    structures at the dune plane bed transition. In: Collinson, J. D. & Lewin, J.          the wandering reach of the lower Yellow River and strategies for its river
    (eds) Modern and Ancient Fluvial Systems. 6, 49–58 (Special Publications               training. Report No. ZX-2005-59-72, (YRIHR, 2005).
    International Association of Sedimentologists, 1983).                              68. Huang, Y. & Wang, H. Is the regional precipitation predictable in decadal
38. Engelund, F. & Hansen, E. A monograph on sediment transport in alluvial                scale? A possible approach for the decadal prediction of the summer
    streams, (TEKNISKFORLAG Skelbrekgade 4 Copenhagen V, Denmark, 1967).                   precipitation over North China. Earth Space Sci. 7, e2019EA000986 (2020).
39. Bradley, R. W. & Venditti, J. G. Reevaluating dune scaling relations. Earth-Sci.   69. Fu, G., Charles, S. P., Yu, J. & Liu, C. Decadal climatic variability, trends, and
    Rev. 165, 356–376 (2017).                                                              future scenarios for the North China Plain. J. Clim. 22, 2111–2123 (2009).
40. Naqshband, S., Ribberink, J. & Hulscher, S. Using Both Free Surface Effect and     70. Wei, K. et al. Reflections on the Catastrophic 2020 Yangtze River Basin
    Sediment Transport Mode Parameters in Defining the Morphology of River                  Flooding in Southern China. Innovation 1, 100038 (2020).
    Dunes and Their Evolution to Upper Stage Plane Beds. J. Hydraul. Eng. 140,         71. Hydrological Bureau, Ministry of Water Conservancy and Electric Power,
    06014010 (2014).                                                                       PRC. National Standards for Hydrological Survey. vol 1–7. (China Industry
41. Buffington, J. M. Changes in channel morphology over human time scales                  Press, 1962). (in Chinese).
    [Chapter 32]. In: Church, M., Biron, P. M. & Roy, A. G. eds. Gravel-Bed            72. Boiten, W. Hydrometry, (2nd Edi., Swets & Zeitlinger B.V., Lisse, the
    Rivers: Processes, Tools, Environments. 435–463 (Wiley, 2012).                         Netherlands. 2003).
42. Knighton, D. Fluvial forms and processes: a new perspective. (Routledge, 2014).    73. Sambrook Smith, G. H., Best, J. L., Orfeo, O., Vardy, M. E. & Zinger, J.
43. Ferguson, R. & Church, M. A simple universal equation for grain settling               Decimeter‐scale in situ mapping of modern cross‐bedded dune deposits using
    velocity. J. Sediment. Res. 74, 933–937 (2004).                                        parametric echo sounding: a new method for linking river processes and their
44. Ohata, K., Naruse, H., Yokokawa, M. & Viparelli, E. New bedform phase                  deposits. Geophys. Res. Lett. 40, 3883–3887 (2013).
    diagrams and discriminant functions for formative conditions of bedforms in        74. Sambrook Smith, G. H., Best, J. L., Leroy, J. Z. & Orfeo, O. The alluvial
    open-channel flows. J. Geophys. Res. Earth Surf. 122, 2139–2158 (2017).                 architecture of a suspended sediment dominated meandering river: the Río
45. Van Den Berg, J. H. & Van Gelder, A. A new bedform stability diagram, with             Bermejo, Argentina. Sedimentology 63, 1187–1208 (2015).
    emphasis on the transition of ripples to plane bed in flows over fine sand and       75. Wright, S. & Parker, G. Flow resistance and suspended load in sand-bed
    silt. Alluvial Sediment. 66, 11 (1993).                                                rivers: simplified stratification model. J. Hydraul. Eng. 130, 796–805 (2004).
46. Naqshband, S. & Hoitink, A. J. F. Scale-dependent evanescence of river dunes
    during discharge extremes. Geophys. Res. Lett. 47, e2019GL085902 (2020).
47. Best, J. The fluid dynamics of river dunes: a review and some future research
    directions. J. Geophys. Res. Earth Surf. 110, F04S02 (2005).                       Acknowledgements
48. Andreotti, B., Claudin, P., Devauchelle, O., Durán, O. & Fourrière, A.             We thank A. Moodie for post-processing the MBES data and Z.Li for his comments on
    Bedforms in a turbulent stream: ripples, chevrons and antidunes. J. Fluid          extreme floods induced by climate change. We appreciate the careful and constructive
    Mech. 690, 94–128 (2012).                                                          reviews from Profs Samuel Munoz, Gordan Grant, and an anonymous reviewer. H.M.,
49. Nittrouer, J. A., Allison, M. A. & Campanella, R. Bedform transport rates for      J.A.N., M.P.L., and G.P. gratefully acknowledge the NSF of the United States for support
    the lowermost Mississippi River. J. Geophys. Res. Earth Surf. 113, F03004          through Division of Earth Science (EAR) Grant 1427262. X.F. was supported by NSF of
    (2008).                                                                            China through Grant 51525901. Y.Z. acknowledges support from NSF of China through
50. Martin, R. L. & Jerolmack, D. J. Origin of hysteresis in bed form response to      Grant 51379087. Y.W.(a) acknowledges support from NSF of China through Grant
    unsteady flows. Water Resour. Res. 49, 1314–1333 (2013).                            42041004. J.C. was supported by NSF Graduate Research Fellowship (grant no. DGE-
51. Shimizu, Y., Giri, S., Yamaguchi, S. & Nelson, J. Numerical simulation of          1746047) and also the Department of Geology, University of Illinois, and the Jack and
    dune–flat bed transition and stage‐discharge relationship with hysteresis           Richard C. Threet chair to J.B.
    effect. Water Resour. Res. 45, W04429 (2009).
52. Nittrouer, J. A., Shaw, J., Lamb, M. P. & Mohrig, D. Spatial and temporal
    trends for water-flow velocity and bed-material sediment transport in the           Author contributions
    lower Mississippi River. Geol. Soc. Am. Bull. 124, 400–414 (2012).                 H.M. designed the study, drafted the paper and was leading author of the paper. J.A.N.,
53. Yellow River Conservancy Commission, Integrated Planning of the Yellow             G.P., M.P.L., and J.B. provided substantial editorial feedback. J.A.N., H.M., and D.P.
    River Basin (2012-2030). (The Yellow River Water Conservancy Press, 2013).         conducted the multibeam survey at Lijin. Y.Z., X.F., and Y.W.(a) conducted the multi-
54. Czapiga, M. J., McElroy, B. & Parker, G. Bankfull Shields number versus slope      beam survey at Huayuankou. J.B., J.C., and Y.Z. conducted the parametric echo-sounder
    and grain size. J. Hydraulic Res. 57, 760–769 (2019).                              bed surveys at Huayuankou. H.M., Y.W.(b), and B.W. analyzed the historical stage-
55. Trampush, S. M., Huzurbazar, S. & McElroy, B. Empirical assessment of              discharge and cross-sectional data. J.C. processed the parametric echo sounding survey
    theory for bankfull characteristics of alluvial channels. Water Resour. Res. 50,   data and analyzed the bedform statistics. M.P.L. and H.M. developed the relations among
    9211–9220 (2014).                                                                  dune height, resistance and suspension number. All authors participated in discussion
56. Wilkerson, G. V. & Parker, G. Physical basis for quasi-universal relationships     and writing of the paper.
    describing bankfull hydraulic geometry of sand-bed rivers. J. Hydraulic Eng.
    137, 739–753 (2011).
57. Kwoll, E., Venditti, J. G., Bradley, R. W. & Winter, C. Flow structure and
    resistance over subaquaeous high‐and low‐angle dunes. J. Geophys. Res.: Earth      Competing interests
    Surf. 121, 545–564 (2016).                                                         The authors declare no competing interests.

10                   NATURE COMMUNICATIONS | (2022)13:3054 | https://doi.org/10.1038/s41467-022-30730-9 | www.nature.com/naturecommunications
NATURE COMMUNICATIONS | https://doi.org/10.1038/s41467-022-30730-9 ARTICLE
Additional information Open Access This article is licensed under a Creative Commons
Supplementary information The online version contains supplementary material Attribution 4.0 International License, which permits use, sharing,
available at https://doi.org/10.1038/s41467-022-30730-9. adaptation, distribution and reproduction in any medium or format, as long as you give
appropriate credit to the original author(s) and the source, provide a link to the Creative
Correspondence and requests for materials should be addressed to Hongbo Ma, Commons license, and indicate if changes were made. The images or other third party
Jeffrey A. Nittrouer or Xudong Fu. material in this article are included in the article’s Creative Commons license, unless
indicated otherwise in a credit line to the material. If material is not included in the
Peer review information Nature Communications thanks Gordon Grant, Samuel Munoz article’s Creative Commons license and your intended use is not permitted by statutory
and the other, anonymous, reviewer(s) for their contribution to the peer review of this regulation or exceeds the permitted use, you will need to obtain permission directly from
work. Peer reviewer reports are available. the copyright holder. To view a copy of this license, visit http://creativecommons.org/
licenses/by/4.0/.
Reprints and permission information is available at http://www.nature.com/reprints
Publisher’s note Springer Nature remains neutral with regard to jurisdictional claims in © The Author(s) 2022
published maps and institutional affiliations.
NATURE COMMUNICATIONS | (2022)13:3054 | https://doi.org/10.1038/s41467-022-30730-9 | www.nature.com/naturecommunications 11You can also read