Alcohol Abuse in Montana By Patrick M. Barkey - Director March 2009 - Bureau of Business and Economic Research
←
→
Page content transcription
If your browser does not render page correctly, please read the page content below

The Economic Cost of

         Alcohol Abuse                      in Montana

                               By Patrick M. Barkey
                               Director

                               March 2009

Bureau of Business and Economic Research
  The University of Montana- Missoula
          Missoula, MT 59801
            (406) 243-5113
           www.bber.umt.edu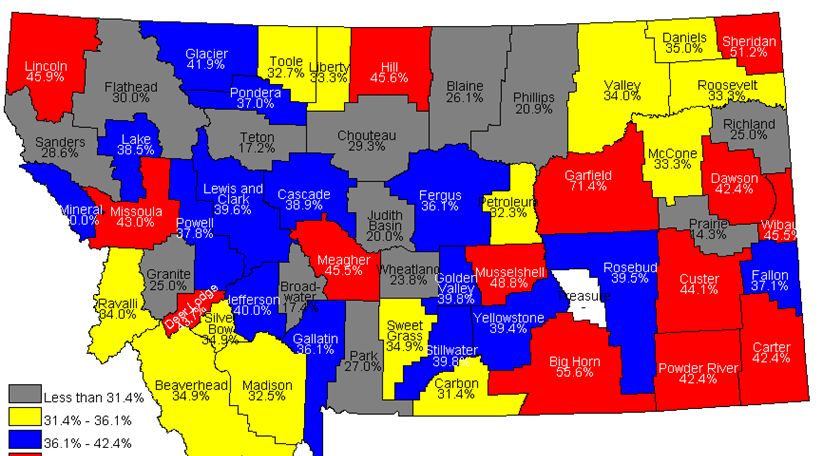
Introduction and Acknowledgements

This report is the first of its kind in attempting to quantify the relationship between
drinking behavior and monetary cost in the state of Montana. The information it provides
must be understood in the context of the efforts underway to direct the scarce resources
available to reduce substance abuse overall in ways that produce the largest benefit. The
benefits in addressing alcohol abuse are substantial, and should receive commensurate
public attention.

Acknolwedgements

We would like to acknowledge:

   •   MHA, An Association of Montana Health Care Providers, for making its
       CompData database available for the study of alcohol-related medical care costs;
   •   The members of the Montana Epidemiological Work Group, formed as part of the
       Strategic Prevention Framework State Incentive Grant, for supporting this
       research, providing data, as well as invaluable encouragement and advice;
   •   Renaud Bengadi Kiki for research assistance throughout the project.

                                           1
The Economic Cost of Alcohol Abuse in Montana
0. Executive Summary
Alcohol is a product that many of us in Montana clearly enjoy. In 2005, we collectively
consumed 124.7 million shots of distilled spirits, 33.0 million glasses of wine and 279.6
million 12 oz. cans of beer statewide (NIAAA, 2008). On a per capita basis, Montana
ranks in the top half of states in alcohol consumption, with the 2003 consumption of 435
beers per adult -- higher than all but four other states nationwide. Like most states,
buying and selling alcoholic drinks is a big business in Montana, employing thousands in
production, processing, marketing, distribution and retailing.
Yet alcohol is not an ordinary good. Its consumption is causally linked to outcomes that
none of us enjoy. These include outcomes that affect the drinker – ranging from alcohol-
induced illness and premature death, highway crashes due to alcohol impairment, and
even the impact of heavy drinking on one’s ability to earn a living – as well as those
affected by a drinker’s alcohol-induced behavior. Because of the unwanted impacts of
alcohol abuse, society pays a substantial price. And because alcohol use – and alcohol
abuse -- is higher than average in our state, that price is larger than it has to be.
We find that the abuse of alcohol in Montana levies a cost in terms of dollars spent by
businesses, individuals and governments – as well as dollars lost to the economy because
of outcomes due to alcohol – of more than half a billion dollars. These costs occur due
to:
• the money spent on alcohol-treatment centers around the state, supporting
detoxification services, inpatient and outpatient treatment, and long- and short-
term residential services: $10.7 million;
• the money spent on medical care in hospitals and clinics, treating conditions
either due to alcohol abuse or complicated by alcohol abuse: $100.3 million;
• the cost to the economy caused by the loss of life – removing productive workers
from the economy, often at a young age in the prime of their working lives,:
$296.8 million;
• the price paid by businesses, governments and families for the impairing impacts
of alcohol and alcoholism on worker productivity, from higher tardiness and
absenteeism, lower productivity while on the job, more sick days, a shorter, more
restricted working career: $53.3 million;
• the cost paid due to alcohol’s impact on crime and criminal behavior – the extra
police, judges and prison cells needed to protect citizens and enforce the laws that
are broken because of the impairing impacts of alcohol: $49.1 million.
It is important to note that alcohol abuse is not a one-time cost to the Montana economy;
it is an amount paid every single year. Moreover it is an economic cost that represents
resources that could be freed for other productive uses.
2The Economic Cost of Alcohol Abuse in Montana
1. Introduction and Overview
Alcohol is a product that many of us in Montana clearly enjoy. In 2005, we collectively
consumed 124.7 million shots of distilled spirits, 33.0 million glasses of wine and 279.6
million 12 oz. cans of beer statewide (NIAAA, 2008). On a per capita basis, Montana
ranks in the top half of states in alcohol consumption, with the 2003 consumption of 435
beers per adult -- higher than all but four other states nationwide. Like most states,
buying and selling alcoholic drinks is a big business in Montana, employing thousands in
production, processing, marketing, distribution and retailing.
Yet alcohol is not an ordinary good. Its consumption is causally linked to outcomes that
none of us enjoy. These include outcomes that affect the drinker – ranging from alcohol-
induced illness and premature death, highway crashes due to alcohol impairment, and
even the impact of heavy drinking on one’s ability to earn a living – as well as those
affected by a drinker’s alcohol-induced behavior. This second category of outcomes is
surprisingly broad.
This study attempts to quantify the cost to Montana’s economy of these unwanted and
undesirable consequences of alcohol consumption. Many, but not all, of these costs are
paid out directly by individuals, businesses and governments. These include costs paid to
support treatment centers that perform detoxification services, those dollars spent
imprisoning criminals whose crimes can be attributed to alcohol abuse, and the money
spent on medical treatment for alcohol-related injuries and medical conditions. But many
of these costs represent opportunities for gain that are foregone due to alcohol. These
range from the cost businesses bear when their workers show up late or hungover from
drinking, to the tragic loss when alcohol results in death and the future of a productive
life that would otherwise have occurred.
This study takes an economy-wide perspective. We ask the question, what resources
would be available to the economy – that could be used on other priorities – if there were
no abuse of alcohol? In addressing this question, we accomplish the following two goals
simultaneously.
First, the dollar estimate itself gives some perspective on the magnitude of the problem,
particularly in comparison to other issues and problems that compete for our attention.
Alcohol is a familiar product that has acquired a social acceptance in Montana and
elsewhere, and that may cause us to overlook its negative consequences. By quantifying
the costs of those consequences, we can put them in a more even perspective.
But there is a second aim of this study that goes beyond these numerical estimates. That
is unfolding the complex relationship between alcohol abuse and economic welfare. The
myriad of mechanisms through which the deleterious effects of alcohol show up in the
3Figure 1.1
Alcohol Consumption Per Capita
Gallons of Ethanol per Population 21 and older
3.2
3
2.8
Montana
2.6
United States
2.4
2.2
2
90
91
92
93
94
95
96
97
98
99
00
01
02
03
04
05
19
19
19
19
19
19
19
19
19
19
20
20
20
20
20
20
bottom lines of businesses, governments, taxpayers and families is worthy of note.
The purpose of this study is to develop and present information on how alcohol abuse
impacts the collective economic welfare of Montanans. By design, we focus on the
undesirable side effects of excessive alcohol consumption – and, specifically, how those
side effects translate into economic loss. There are clearly benefits to alcohol enjoyed by
those who consume it, as well as those who earn their livelihoods producing,
transporting, storing and selling it – just as there are for any other good or service
produced in the economy.
We focus on economic loss because it provides a means of placing the problem of
alcohol abuse into perspective with other priorities that compete for our attention and
resources. Yet it is easily recognized that no dollar figure can be said to balance the loss
felt by families and loved ones when lives are impacted by alcohol abuse. Thus even the
most comprehensive economic assessment can only be one part of our overall assessment
of the problem.
Alcohol: Montana’s Drug of Choice
By almost any measure, Montanan consume alcohol at a rate that is above the national
average. For certain types of drinking behaviors, Montana ranks among the highest in the
nation.
Overall consumption of alcohol per person of drinking age in Montana has historically
been 15 to 20 percent higher than the national average, as shown in Figure 1.1. When
beer, wine and spirits consumption are converted to their ethanol alcohol equivalents, the
4data show that Montanans consumed just over 3 gallons of ethanol per person 21 years
and older in 2005, almost 18 percent more than the comparative national figure.
Montana also has a relatively high incidence of underaged drinking. According to the
Center for Disease Control’s Youth Risk Behavior Surveillance Survey (YRBS), in 2005
more than a third of high school students in Montana experienced a binge drinking
episode – consuming five or more drinks within a couple of hours – within the last 30
days. As can be seen from Figure 1.2, this was a higher percentage than any other state
in the country.
The data for individual counties and communities are even more disturbing. Some
individual counties in Montana reported that more than half of high school seniors had
experienced a binge drinking episode in the last two weeks in 2006, as shown in Figure
1.3.
Figure 1.2
Youth Binge Drinking Percentage by State, 2005
Source: Youth Risk Behavior Surveillance (YRBS), 2005
Note: Not all states participated in YRBS.
5Figure 1.3
Binge Drinking by County, 12th Grade, Last Two weeks, 2006
Source: Youth Risk Behavior Surveillance, 2006.
And
Figure 1.4
Binge Drinking by County by 8th Graders, Last Two Weeks, 2006
Source: Youth Risk Behavior Surveillance, 2006.
6there were 13 counties in Montana where the incidence of binge drinking among eighth
grade students was above 20 percent (Figure 1.4).
These kinds of rankings provide additional motivation for this study. Since Montana’s
use of alcohol is high, it stands to reason that the cost imposed on our economic welfare
is high as well. We now turn to a discussion of how to measure that cost.
Assessment of Economic Costs
This study presents a conventional view of economic costs. In this study we:
• consider only the undesirable side effects of the behavior;
Like any other good or service, the cost consumers pay to acquire alcohol
is presumably offset by the benefits they get from consuming it. It is the
cost of treating the unwanted side effects – the illness, the injuries, and the
loss in productivity – that is measured here.
• take the point of view of the entire economy;
Some costs are borne by the drinker, others by those directly affected by
their behavior, and still others by the general taxpayer. Taking care to
avoid double counting, we sum all of these costs, regardless of who bears
them.
• tally both actual dollar outlays and imputed costs;
Dollars expended for such things as alcohol-treatment programs, law
enforcement, and medical costs are added together with costs that must be
imputed, such as lost economic output due to premature death or
disability.
• assume no offsetting behavior;
The implicit assumption of this study is that a reduction in alcohol abuse
will result in a decline in its associated costs. This, in turn, assumes that
other risk behaviors (e.g., illegal drug use) are not substituted for alcohol
if the use of the latter were to decline.
This is a static analysis. It does not consider how different actors in the economy might
react to changes in alcohol consumption, and how, in turn, those reactions would affect
the size of the economic pie. For instance, if higher alcohol-related fatalities make
Montana a less desirable place to live or visit, or its higher alcohol-induced illnesses and
tardiness makes the state a less desirable place to invest and do business, then it stands to
reason that reductions in alcohol abuse might spur more in-migration or business
investment. We have made no attempt to capture these kinds of effects in this report.
7We also have made no attempt to estimate the fiscal impacts of alcohol abuse on state and
local governments, although such a sub-study would doubtless be illuminating. We tally
up the total costs to all actors in the economy, public and private.
Organization of this Report
This report presents a separate analysis for alcohol-induced costs in five areas:
• costs of alcohol treatment centers;
• costs of medical care;
• costs due to premature mortality;
• morbidity costs due to alcohol;
• alcohol related costs for crime and the criminal justice system.
These represent five different areas where data are available to construct an estimate of
costs for the state. They do not exhaust all of the ways in which alcohol abuse impacts
our economic welfare. We mention some of the areas that this report does not address in
the final section, along with a summary and presentation of total costs.
82. Alcohol Treatment
In 2005, there were a total of 46 publicly- and privately-owned facilities providing
substance abuse treatment in Montana that responded to the National Survey of
Substance Abuse Treatment Services (N-SSATS) conducted by the U.S. Substance
Abuse and Mental Health Services Administration (SAMHSA). As shown in Table 2.1,
57 percent of these are privately-owned nonprofit facilities. At the time the survey was
conducted, there were 3,048 patients receiving treatment, of whom 2,692 (88 percent)
were being treated either solely or partially for substance abuse. Almost three out of
every four patients was seen at a private nonprofit facility.
Table 2.1
Montana Substance Abuse Treatment Facilities, 2005
Clients on March
Facilty Ownership/Operation Facilities 31
Number Percent Number Percent
Private nonprofit 26 57% 2,244 74%
Private for-profit 3 7% 54 2%
Local government 3 7% 272 9%
State government 2 4% 49 2%
Federal government 8 17% 226 7%
Dept. of Veterans Affairs 5 11% 139 5%
Dept. of Defense
Indian Health Service 3 7% 87 3%
Other
Tribal government 4 9% 203 7%
Total 46 100% 3,048 100%
9Table 2.2
Alcohol-Related Admissions to Montana Treatment Facilities, 2005
Admissions
Alcohol Alcohol and
Service Alcohol Only Drug
Detox, 24 Hour, Hospital Inpatient 230 133 97
Detox, 24 Hour, Free-standing Residential 1,036 307 729
Rehab/Res, Long term (> 30 days) 117 24 93
Ambulatory, Intensive Outpatient 933 289 644
Ambulatory, Non-intensive Outpatient 4,034 1,434 2,600
Ambulatory, Detoxification 339 212 127
Total 6,689 2,399 4,290
Figure 2.1
Alcohol-Related Treatment Admission by Age
Montana, 2005
700
600
500
400
Male
300
Female
200
100
0
12- 15- 18- 21- 25- 30- 35- 40- 45- 50- 55+
14 17 20 24 29 34 39 44 49 54
Admissions to these facilities over the entire year are reported to SAMHSA as part of its
Treatment Episode Data Set (TEDS) project. In 2005, there were 6,689 admissions for
abuse of alcohol, exclusively as well as in combination with one or more drugs, as shown
in Table 2.2. Patients are predominantly male – more than 70 percent of those admitted
for treatment in 2005 were men. Younger and middle-aged men are particularly over-
represented, with men aged 21-49 years of age accounting for half of the overall patient
base, as shown in Figure 2.1.
10Figure 2.2
Alcohol-Related Treatment Admissions by Race
Montana, 2005
6000 5230
5000
4000
3000
2000 1245
1000 214
0
White Amer. Indian Other
American Indians are also more likely to receive treatment in substance abuse treatment
facilities than their presence in the overall population of Montana would suggest. As
shown in Figure 2.2, 1,245, or 18.6 percent of admissions in 2005 were American
Indians, almost three times the size of their 6.3 percent share of total state population.
To estimate the cost of treatment, we must first decide on how visits to treatment centers
would change if there were no alcohol abuse. Clearly the costs of treating those who
come to treatment centers diagnosed with alcohol dependence only can be considered.
However, as shown in Table 2.2, more than 4,000 admissions in 2005 had both alcohol
and drug dependence noted. With no basis to make a more informed decision, we have
attributed half of the treatment costs of those with simultaneous alcohol and drug
addiction to the category of alcohol-related costs.
11Table 2.3
Alcohol-Related Costs at Montana Treatment Facilities, 2005
Alcohol
Related Cost per Total
Cost
Service Admissions Admission ( $ million)
Detox, 24 hr, Hosp. inpatient 182 2,828 0.51
Detox, 24 hr, Free-standing Res. 672 2,828 1.90
Rehab/Res, Long term (> 30 days) 71 4,292 0.30
Ambulatory, Intensive outpatient 611 4,561 2.79
Ambulatory, Non-intensive outpatient 2734 1,602 4.38
Ambulatory, Detoxification 276 2,828 0.78
Total 4,546 10.67
SAMHSA has reported on average treatment costs nationally (2004), including
personnel, materials, administrative, equipment and depreciation costs. In some cases,
such as hospital inpatient services, residential rehabilitation and outpatient services, those
cost estimates are directly applicable to the services reported in TEDS. In the case of
ambulatory detoxification services and detoxification at free-standing residential
facilities, no information was available, so we have assumed those costs to be the same as
when services are performed at hospitals. Finally, we have assumed that intensive out-
patient services are one standard deviation above average costs per admission as reported
by SAMHSA. All costs are adjusted to 2005 dollars using the price deflator for personal
expenditures on medical care.
As summarized in Table 2.3, applying these cost estimates to treatment frequencies in
Montana in 2005 yields total spending on substance abuse treatment due to alcohol abuse
of $10.7 million. Since this spending would not take place in the absence of alcohol
abuse, it is carried forward as part of the cost of drinking behaviors to the Montana
economy.
123. Medical Care
The cost of providing specialized medical care for ailments that result from alcohol use in
Montana is significant. We estimate that in 2005, the costs born by individuals,
governments, hospitals and other health payers statewide was $100.7 million. These
include the hospital costs, both inpatient and outpatient/emergency room care, physicians
charges, prescription drug costs and the costs of nursing home care.
Hospital Charges
There are several linkages between the abuse of alcohol and the onset of medical
conditions requiring specialized treatment. Some conditions requiring hospitalization or
other treatment, such as alcohol poisoning and fetal alcohol syndrome, are due solely to
alcohol abuse. A wider range of conditions, from accidents, to pneumonia to diabetes,
are partially attributable to alcohol use. Following the “illness specific” approach used
by national (NIDA, 1998) and other state studies (Wickizer, 1999; Liu, 2002), we use
data of hospital charges specific to Montana along with estimates of alcohol attributable
fractions of incidence compiled from national studies to estimate inpatient costs.
Table 3.1
Over 90 percent of Montana hospital
Alcohol Induced Medical Care Costs, Montana
Millions of Dollars
discharges are recorded in the MHA’s
(Association of Montana Health Care
Service Costs Providers) COMPdata database, made
available for this study through the
Private Hospital Charges cooperation of that organization. We
Inpatient services matched those data with the diagnosis
Alcohol Illnesses $34.0 codes corresponding to alcohol-induced
Alcohol complications 7.2 conditions for discharges over the year
Outpatient services 11.6 2006, with the results shown in Table
3.1.
VA Hospital 2.8
Total Hospital Charges 55.6
There were 7,128 patients discharged
Physician Charges 32.2 from Montana hospitals recorded in the
COMPdata database in 2006 from
Prescription Drug Charges 9.7 conditions wholly or partially due to
alcohol abuse, resulting in more than
Nursing Home Care 3.2 $124 million of hospital charges.
However, many of these discharges
Total, Medical Spending $100.7
were for conditions like pneumonia and
hypertension that have relatively small alcohol attributable fractions (AAF). Using
AAF’s from national research, we estimate that 2,323 discharges were due to alcohol
abuse, resulting in hospital charges of just under $34 million.
13To this we must add the costs that result from the additional complications imposed when
heavy users of alcohol are treated for non-alcohol related conditions. A Texas study (Liu,
2002) computed that length of stay in hospitals for those with alcohol co-morbidity was
38 percent higher than the remaining patients, aggregated across all diagnostic categories.
We were unable to directly estimate this impact with the MHA data. Noting that the
NIAAA/NIDA study (Harwood, et. al., 1998) found that the complications of alcohol use
pushed up the total hospital charges for alcohol use by 21.5 percent, we estimate that
Montana hospital costs due to alcohol complications for non-alcohol diagnoses to be $7.2
million.
Montana is one of the heaviest users of hospital outpatient services in the nation.
According to American Hospital Association, in 2006 there were 3,065 visits to hospitals
in the state for outpatient services – which includes emergency room visits – per 1,000
population. This is 52 percent higher than the national average of 2,007 visits per 1,000
population, and higher than all but four other states.
Outpatient records comparable to the MHA data for inpatient discharges were not
available for Montana. Thus we have adopted national estimates of alcohol-attributable
outpatient expenditures ($1.88 billion in 1992) to adjust for medical care inflation and
Montana’s population size. Since Montana’s usage rates for outpatient services are
considerably higher than the national average, this results in a conservative estimate of
outpatient costs. We estimate alcohol-related outpatient costs to Montana hospitals to be
$11.6 million.
Finally, we need to add hospital charges from the Veterans Administration (VA) system.
Individual level data on discharges used to separate alcohol induced illnesses as described
above for community hospitals were not available. However, we note that hospital
charges due to alcohol for the latter were about 2.5 percent of total expenditures. Total
VA hospital expenditures in Montana in 2005 were $109 million. Thus a reasonable
estimate of alcohol-related VA expenditures in Montana would be $2.8 million.
Adding these together, as shown in Table 3.1, this brings the total for Montana hospital
expenditures due to alcohol to $55.6 million.
Other Medical Expenditures
Other categories of alcohol-induced medical expenditures were based on proportionate
shares of total state spending:
• Doctors and physicians expenses. In 2004, expenditures on doctors and
physicians in Montana was $1.1 billion, or about 58 percent as large as the $1.9
billion spent on hospital care. We estimate that alcohol-induced spending on
physicians to be proportionate to the hospital spending figure computed above, or
$32.2 million.
14• Prescription drug charges. Updating the results of the NIDA/NIAAA study on
alcohol-induced prescription drug costs for the national economy, using medical
price inflation and Montana’s population size, we estimate that prescription drug
costs due to alcohol for Montana to be $9.7 million.
• Nursing home costs. National studies estimated that nursing home expenditures
attributable to alcohol abuse are about 1 percent of total nursing home spending.
Thus we estimate that nursing home costs attributable to alcohol in Montana to be
$3.2 million.
Conclusion
Summing across all categories, Table 3.1 shows that Montana’s alcohol-induced medical
expenditures are $100.7 billion and include:
• inpatient hospital care for alcohol-induced conditions;
• inpatient hospital care for alcohol-related complications to non-alcohol dignoses;
• outpatient care;
• care at VA facilities;
• physician care;
• prescription drugs; and
• nursing home care.
154. Mortality
Premature death due to alcohol is a tragic event for the families and children directly
affected by the loss. It also imposes a significant cost on the economy. Were it not for
the involvement of alcohol, these individuals could be expected to continue productive
lives, caring for families, paying taxes and accumulating assets. One way of measuring
the cost of alcohol, therefore, is to tally the earnings those who died could have been
expected to enjoy had their lives not been prematurely ended.
While forecasting individual earnings is difficult, statistical models of earnings for groups
of individuals, classified by age, sex and education, produces adequate results. Using
Montana data for 2005 from the American Community Survey conducted by the U.S.
Bureau of the Census, we fit age/earnings profiles for men and women separately, broken
down into four educational attainment levels: high school or less, some college, a 4 year
college degree and post graduate education.
As shown in the estimated profiles shown in Figure 4.1 and 4.2, earnings for all
sex/education categories grows with age until middle age, declining slightly afterwards.
These profiles reflect rates of pay, work hours and labor force participation.
Figure 4.1
Age/Earnings Profile, Men
American Community Survey, Montana
80000
70000
60000
Annual Earnings
50000 High School
Some College
40000
College Degree
30000 Graduate Degree
20000
10000
0
18
22
26
30
34
38
42
46
50
54
58
62
Age
These profiles were used to produce a predicted earnings stream for each individual
whose premature death could be attributable to alcohol, based on their age, sex, and
16Figure 4.2
Age/Earnings Profile, Women
American Community Survey 2005, Montana
60000
50000
Annual Earnings
40000
High School
30000 Some College
20000 College Degree
Graduate Degree
10000
0
-10000
18
22
26
30
34
38
42
46
50
54
58
62
Age
education. But since an individual who dies today would otherwise have reaped those
earnings in the future, two additional adjustments must be made.
First, future earnings were adjusted for anticipated growth in future wage rates. On an
inflation-adjusted basis, earnings per job in Montana have grown by an average of 0.7
percent per year since 1990. This growth rate was used to adjust the profile of future
years from the 2005 base year..
However, in order to estimate the economic cost today of lost earnings that occur at some
point in the future, we must apply a discount factor to reflect that fact that losses incurred
in the future are less painful than those incurred today. In inflation-adjusted terms, a
discount rate of 2 percent was appropriate. Finally, we sum the discounted future
earnings for the remainder of the individual’s working life, had they not died due to
alcohol. For computational purposes, we assumed that individuals would work until age
65.
To give a concrete example of this, suppose that a 41-year-old man with a college
education dies in an alcohol-related motor vehicle crash. To compute the sum of lost
earnings, we would add up 24 years of earnings as predicted by the age/earnings profile,
growing each successive year by 0.7 percent to account for wage growth and reducing
each year by 2 percent per year to discount future earnings to the present.
17Table 4.1
Alcohol-Induced Causes of Death
ICD-9 or
ICD-10
Code Cause
E244 Alcohol-Induced Pseudo-Cushings Syndrome
G721 Alcoholic Myopathy
K860 Alcohol-Induced Chronic Pancreatitis
291 Alcoholic Psychoses
303 Alcoholic Dependence Syndrome
3050 Non-dependent Abuse of Alcohol
F10 Mental and Behavioral Disorders Due to Alcohol Use
G312 Degeneration of Nervous System Due to Alcohol
3575,G621 Alcoholic Polyneuropathy
4255,I426 Alcoholic Cardiomyopathy
5353,K292 Alcoholic Gastritis
5710-5713 Alcoholic Chronic Liver Disease and Cirrhosis
K70 Alcoholic Liver Disease
7903 Excessive Blood Level of Alcohol
R780 Finding of Alcohol in Blood
860 Accidental Poisoning by Alcohol, NEC
T51 Toxic Effects of Alcohol
X45 Accidental Poisoning by and Exposure to Alcohol
X65 Intentional Self-Poisoning by and Exposure to Alcohol
Y15 Poisoning by and Exposure to Alcohol, Undetermined Intent
Alcohol as a Cause of Death
According to the death certificates recorded in Montana in 2005, there were 314 deaths
with underlying or contributing cause of death among the 20 different diagnostic
categories shown in Table 4.1. As shown in Table 4.2, alcohol-induced deaths are much
more likely to occur with men than women, and occur at a much younger age, on
average, than the overall population (50.3 years for alcohol-induced death versus 73.6
years for the overall population).
Table 4.2
Deaths Recorded in Montana, 2005
Alcohol-
Total Induced
Deaths 8,803 314
Male, Percent 50.5 72.6
Female, Percent 49.5 27.4
Average Age, Years 73.6 50.3
18Taking the detailed individual information obtained from death certificates, we computed
lost earnings resulting from the excessive mortality as described above. We find that the
present value of lost earnings to the Montana economy resulting from alcohol-induced
deaths from the causes listed in Table 4.1 to be $206 million.
Motor Vehicle Alcohol-Related Crash Fatalities
Alcohol use imposes a tragic cost in human life on Montana’s highways each year. The
combination of alcohol-induced impairment and the use of a motor vehicle can be a lethal
combination. In 2006, 108 people died in alcohol-related motor vehicle crashes in
Montana. As shown in Figure 4.3, there has been little movement in this fatality total –
or, for that matter, the injuries shown in Figure 4.4 -- over the last 20 years. As can be
seen from Figure 4.5, the fatalities are higher in more populated counties, but disturbingly
high fatality totals also occur in some rural counties as
well.
Figure 4.3
Motor Vehicle Alcohol-Related Crash Fatalities
Montana, 1981-2006
250
200
150
100
50
0
1981 1984 1987 1990 1993 1996 1999 2002 2005
19Figure 4.4
Motor Vehicle Alcohol-Related Crash Injuries
Montana, 1981-2006
4000
3500
3000
2500
2000
1500
1000
500
0
81
83
85
87
89
91
93
95
97
99
01
03
05
19
19
19
19
19
19
19
19
19
19
20
20
20
We applied the age/earnings profile and the same methodology as described above to
estimate loss of earnings to the Montana economy that resulted from these deaths, based
Figure 4.5
Highway Alcohol Crash Fatalities by County, 2006
20on age, sex and education. We find that alcohol induced highway fatalities resulted in a
loss of $96.2 million in 2006.
Conclusion
Undoubtedly the use of alcohol results in deaths beyond those noted in this section,
through falls, drownings, fires and other mishaps. Yet from just these two sources of data
– death certificates, and motor vehicle crash reports -- we find that early death due to
alcohol imposes a cost of $312.2 million on the Montana economy each year in the loss
of earnings imposed by excess mortality.
215. Morbidity
It is well known that the consumption of alcohol is associated with impairments that can
affect one’s ability to function and earn a living in a number of ways. Alcohol affects the
motor skills and decision-making ability of individuals. Heavy drinking can also affect
tardiness, absenteeism and productivity while on the job. Since alcohol use is prevalent
in Montana, and in particular, rates of heavy drinking in the population are higher than
the national average, we might expect that the economy ultimately pays a price for the
deleterious effects of alcohol consumption on individual productivity.
This section represents an initial attempt to quantify what is a highly complex issue –
namely, how much does drinking behavior affect economic productivity. We have
applied methods used in other studies, adapted to Montana-specific data, to compile an
aggregate estimate of the value of lost economic output.
The pivotal elements of the analysis are age and sex-specific average impairment rates
published in national level studies (Rice, et. al., 1990). These represent a percentage
reduction in output and earnings for heavy drinkers in each category. They can come
about by a variety of means.
First, there is a reduction in productivity while on the job, caused by either drinking
during working hours or, say, the morning after the day of heavy drinking. There is also
the impact of higher absenteeism or sick days resulting in less time on the job. Finally,
there is the closing off of more promising career opportunities that might have been
available were the individual not a heavy drinker. Impairment rates rise with age as the
medical complications of heavy drinking become more prominent and loss of work time
becomes more significant.
Heavy Drinking in Montana by Age/Sex
The best available information on the incidence of drinking in the Montana population
comes from the Center for Disease Control’s Behavioral Risk Factor Surveillance Survey
(BRFSS). This is a national survey conducted annually to assess the incidence of risky
behavior in adult populations. Since Montana is a relatively sparsely-populated state, we
have averaged the BRFSS estimates for 2004 through 2006 for three different definitions
of heavy drinking: those who consume three or more drinks per day (two or more per
day for females); those who are coded as heavy drinkers by the CDC based on the
answers given to multiple questions; and binge drinkers who said that they consumed five
or more drinks on one occasion (four or more for females) within the last two weeks.
As shown in Table 5.1, the choice of definition matters a great deal in assessing the
extent of heavy drinking behavior in Montana. By any definition, rates at the younger
ages are considerably higher, particularly for binge drinking behavior. In order to
produce a more conservative estimate, we have chosen the CDC’s multiple-question
definition of heavy drinking behavior in the remainder of this analysis.
22Table 5.1
BRFSS Responses on Heavy Drinking
Montana, 2004-06
Based on Drinks Based on Multiple- Based on
Sex Age per Day* Question Coding Binge Drinking
Males 18-24 39.0% 11.2% 37.3%
25-34 34.8% 5.6% 36.8%
35-44 26.6% 5.5% 25.4%
45-54 21.8% 5.8% 20.9%
55-64 15.8% 5.3% 16.9%
65+ 10.4% 3.9% 6.5%
Female 18-24 40.9% 7.3% 23.3%
25-34 36.2% 6.0% 16.5%
35-44 31.3% 5.8% 11.6%
45-54 26.1% 4.3% 7.7%
55-64 17.6% 5.3% 4.3%
65+ 9.6% 3.6% 1.7%
* = three or more drinks/day (men), two or more drinks/day (women)
23Table 5.2
Earnings Loss Due to Alcohol Abuse, Montana
Average Total
Heavy Average Impairment Earnings Earnings
Loss (mill
Sex Age Population Employed Unemployed Drinkers Population Employed Unemployed Earnings Rates Loss $)
Males 18-24 44,454 37,462 6,992 11.2% 4,991 4,206 785 $13,644 1.4% $191.02 0.803
25-34 54,625 48,967 5,658 5.6% 3,043 2,727 315 $32,123 3.0% $963.69 2.628
35-44 58,092 48,905 9,187 5.5% 3,222 2,713 510 $43,910 5.5% $2,415.05 6.551
45-54 74,109 60,909 13,200 5.8% 4,318 3,549 769 $44,349 5.5% $2,439.20 8.657
55-64 56,535 36,768 19,767 5.3% 3,000 1,951 1,049 $42,244 9.3% $3,928.69 7.665
65+ 53,376 9,063 44,313 3.9% 2,080 353 1,727 $29,035 9.3% $2,700.26 0.954
Female 18-24 42,273 35,296 6,977 7.3% 3,073 2,566 507 $9,884 0.8% $79.07 0.203
25-34 52,890 39,910 12,980 6.0% 3,168 2,391 778 $19,433 2.8% $544.12 1.301
35-44 62,843 48,111 14,732 5.8% 3,622 2,773 849 $23,237 11.9% $2,765.20 7.667
45-54 79,361 63,269 16,092 4.3% 3,418 2,725 693 $26,273 11.9% $3,126.49 8.519
55-64 53,692 31,966 21,726 5.3% 2,844 1,693 1,151 $24,471 18.7% $4,576.08 7.748
65+ 66,836 8,740 58,096 3.6% 2,377 311 2,066 $10,406 18.7% $1,945.92 0.605
Total 699,086 469,366 229,720 39,156 27,957 11,198 53.301
24Applying these impairment rates to the age/sex cohorts in the Montana population yields
an estimate of the total number of heavy drinkers in the state, as well as the breakdown
by age and sex. Since we are interested in the impact of drinking behavior on economic
output, we restrict our attention to those in each age/sex category who are in the
workforce, as detailed in the Census’s American Community Survey. This is shown in
Table 5.2.
We estimate that about 27,000, or about 71 percent, of the roughly 39,000 heavy drinkers
in Montana are employed in the workforce. Applying the national impairment estimates
to their average earnings yields estimates of earnings loss due to alcohol. These range
from a low of $79 per year for females aged 18-24, up to more than $4,500 per year for
women aged 55-64.
As shown in the table, we estimate the productivity impacts to the Montana economy
from those in the workforce who are heavy users of alcohol to be $53.3 million. This
does not include the impact on the economy of those engaged in non-market work (e.g.,
keeping up homes, providing for families) that is likely to be similarly affected.
256. Crime
Alcohol – as well as illegal drugs -- are contributing factors in a substantial amount of
criminal activity. Certain categories of crimes are far more likely when the perpetrators
are under the influence of alcohol. Some crimes, such as driving while intoxicated,
liquor law violations or public drunkenness, involve alcohol by definition. Others, such
as felonious assault and even homicide, are at least partially attributable to alcohol.
Crime itself imposes an enormous cost on our society. Because of crime, we spend
money on law enforcement, courts, and prisons. Crime affects our behavior, raises our
insurance rates, and makes us spend money on locks, lighting and alarm systems. Crime
also can impose a terrible cost on victims and even the criminal’s own families.
Table 6.1
Police Protection Costs By Type of Offense, 2005
Percent
Type of Offense Number Percent of Due to Alcohol
Total Alcohol Costs ($thous.)
Homicide 32 0.0% 30.0% 15
Felonious Assault 2,307 2.1% 26.9% 964
Robbery 244 0.2% 3.9% 15
Burglary 3,896 3.6% 4.7% 285
Larceny -Theft 26,505 24.6% 3.8% 1,565
Driving Under Influence 6,549 6.1% 100.0% 10,178
Liquor Laws 4,383 4.1% 100.0% 6,812
Public Drunkenness 0 0.0% 100.0% 0
Stolen Property 113 0.1% 0.0% 0
Prostitution 14 0.0% 0.0% 0
Drug Laws 5,328 4.9% 0.0% 0
Disorderly conduct 5,908 5.5% 0.0% 0
Vagrancy 0 0.0% 0.0% 0
Other Offenses 52,548 48.7% 0.0% 0
Total 107,827 100% 19,834
Thus it makes sense to consider the crime that is causally linked to alcohol use as cost to
society – governments, businesses and individuals – that is due to alcohol use. If it were
not for alcohol, we would spend less on law enforcement, courts, incarceration, as well as
26realize less personal and property damage. Were it not for alcohol, the resources we
spend on those things could be freed for other uses, thus it is appropriate to consider what
we do spend to be a cost.
Following other studies, we consider three categories of crime costs – police protection,
courts and adjudication, and incarceration. We rely on national studies for estimates of
the proportion of crimes by type that can be said to be attributable to alcohol, and apply
these results to Montana criminal justice system data.
Police Protection Costs
In 2005, more than $167 million was spent in Montana on police protection. In order to
estimate how much less could have been spent had there been no alcohol abuse, we made
a simplifying assumption – namely, that police costs were proportional to criminal
offenses. This allows us to estimate a reduction in costs in proportion to the number of
offenses committed that are attributable to alcohol.
Table 6.2
Legal and Adjudication Costs Type of
Offense, 2005
Percent Pct.
of Due to Alcohol
Costs
Type of Offense Number Total Alcohol ($thous.)
Homicide 32 0.0% 30.0% 7.5
Felonious Assault 2,307 2.1% 26.9% 487.6
Robbery 244 0.2% 3.9% 7.5
Burglary 3,896 3.6% 4.7% 143.9
Larceny -Theft 26,505 24.6% 3.8% 791.4
Driving Under
Influence 6,549 6.1% 100.0% 5,145.6
Liquor Laws 4,383 4.1% 100.0% 3,443.7
Public
Drunkenness 0 0.0% 100.0% 0.0
Stolen Property 113 0.1% 0.0% 0.0
Prostitution 14 0.0% 0.0% 0.0
Drug Laws 5,328 4.9% 0.0% 0.0
Disorderly conduct 5,908 5.5% 0.0% 0.0
Vagrancy 0 0.0% 0.0% 0.0
Other Offenses 52,548 48.7% 0.0% 0.0
Total 107,827 100% 10,027.1
Table 6.1 presents the computations for alcohol-related police protection costs. As
shown in the table, there were almost 108,000 known criminal offenses in Montana in
2005. Of those, more than 12,500, or 11.8 percent, were arguably caused by alcohol.
27Most offenses had no relation to alcohol, still others, such as DUI, were 100 percent
attributable to drinking. Homicide, felonious assault, robbery and burglary fell between
these extremes.
We estimate that police protection costs were $19.8 million higher in Montana due to
alcohol than they otherwise would have been.
Legal and Adjudication Costs
Under the simplifying assumption that legal and adjudication costs are proportional to the
number of offenses processed, we can use a similar method to estimate alcohol-induced
costs on the court system in Montana. In 2005 the courts cost about $84 million to run.
As shown in Table 6.2, we estimate that alcohol use made this figure about $10 million
higher than it otherwise would have been.
Incarceration Costs
Table 6.3
Local Corrections Costs by Type of Offense, Montana 2005
Percent of Percent Due Alcohol
Type of Offense Number Total to Alcohol Costs ($ thous.)
Homicide 32 0.0% 30.0% 2.1
Felonious Assault 2631 2.4% 26.9% 157.4
Robbery 244 0.2% 3.9% 2.1
Burglary 3896 3.6% 4.7% 40.7
Larceny-Theft 26505 24.6% 3.8% 224.0
DUI 6549 6.1% 100.0% 1,456.4
Liquor Laws 4383 4.1% 100.0% 974.7
Public Drunkenness 0 0.0% 100.0% 0.0
Stolen Property 113 0.1% 0.0% 0.0
Prostitution 14 0.0% 0.0% 0.0
Drug Laws 5328 4.9% 0.0% 0.0
Disorderly Conduct 5908 5.5% 0.0% 0.0
Vagrancy 10 0.0% 0.0% 0.0
Other Offenses 52224 48.4% 0.0% 0.0
Total 100.0% 2,857.5
We again make the simplifying assumption that incarceration costs are proportional to the
number of prisoners held at state and local correctional facilities. However, the analysis
in this instance is complicated by the fact that prisoners are often imprisoned for multiple
28offenses, each with different sentence lengths. Thus it is difficult to say, at any point in
time, what unique proportion of the population is incarcerated for a given offense.
For local jails and other corrections facilities, where sentences are comparatively shorter,
we can still use the distribution of arrests among offenses to apportion costs. In 2005,
about $23.9 million was spent on local jails in Montana. Using arrests by offense and
alcohol attribution rates as before, we estimate that $2.8 million of this amount was due
to alcohol, as detailed in Table 6.3.
There were 3,509 inmates in state correctional facilities on December 31, 2005,
according to the U.S. Bureau of Justice Statistics (BJS). Many prisoners are held for
convictions on multiple offenses. A national BJS study conducted in 2003 decomposed
the U.S. prison population according to type of offense. We have used these proportions,
29Table 6.4
Montana Correctional Costs by Type of Offense Due to Alcohol, 2005
Percent of Percent Due Costs due
Offense Total inmates Inmates to Alcohol to Alcohol
Violent offenses 51.8 1,818
Homicide 12.1 425 30 4,837.8
Manslaughter 1.4 49 30 559.7
Rape 4.9 172 30 1,959.1
Other sexual assault 7 246 30 2,798.7
Robbery 14.1 495 3.4 638.9
Assault 9.9 347 30 3,958.2
Other violent 2.5 88 30 999.5
Property offenses 20.9 733
Burglary 11 386 3.6 527.8
Larceny 3.9 137 2.8 145.5
Motor vehicle theft 1.6 56 3.9 83.2
Fraud 2.4 84 0 0.0
Other property 1.9 67 0 0.0
Drug offenses 20 702 0 0.0
Public-order offenses 6.9 242 0 0.0
Other/unspecified 0.5 18 0 0.0
Total 100.1 3,509 16,508.4
applied to the Montana prisoners at state correctional facilities, to estimate alcohol related
incarceration costs at state facilities.
As shown in Table 6.4, roughly half of the state’s prisoners at its facilities are
incarcerated for violent offenses. Apportioning the states $133 million spent on
corrections in 2005 to those prisoners who can arguably be said to have committed
crimes due to alcohol, we estimate that expenditures for state prisons because of alcohol
abuse are $16.5 million.
Conclusion
There are several important categories of costs that are not captured by this report, but
would likely contribute significantly to the costs of crime due to alcohol as reported here.
These include:
• costs to victims, including disability, foregone earnings, and insurance and
crime protection costs;
30• foregone earnings by inmates whose incarceration effectively removes
their contributions to economic output; and
• costs to criminal’s families due to loss of parent.
Even with these omissions, we find the cost of alcohol abuse on the Montana economy
through its impact on crime to be substantial. Taken together, the extra costs borne by
businesses, individuals and governments in Montana for police protection, courts and
criminal justice system administration, and corrections amount to $49.1 million per year.
317. Summary and Conclusion
This study has attempted a comprehensive evaluation of the costs borne by individuals,
businesses and governments as a result of the undesirable side effects of excessive
alcohol consumption. Our aim has been two-fold. First, we have sought to quantify the
negative impacts of alcohol consumption to bring the scope of the problem into clearer
focus when compared to other demands on scarce public funds. Second, we wanted to
identify the wide diversity of mechanisms set into place by the simple act of consuming
alcohol that produce outcomes that make us collectively poorer.
Figure 7.1
The Economic Cost of Alcohol Abuse in Montana
Millions of dollars
Treatment Costs $10.7
Medical Care $100.7
Disease and Poisoning Deaths $200.6
Motor Vehicle Deaths $96.2
Morbidity $53.3
Crime $49.1
0 50 100 150 200 250
This research clearly indicates that alcohol imposes a significant cost on all of us in the
state of Montana. As shown in Figure 7.1, we collectively spend $510.6 million, or about
1.7 percent of the total state economy as measured by GDP, dealing with the
consequences of alcohol consumption. Those costs come about through a wide variety of
ways:
Alcohol treatment centers. We spend $10.7 million a year treating men and
women of all ages for the symptoms of alcohol abuse at the 46 state-license
facilities located around the state.
Medical costs. Alcohol use is causally linked to a broad spectrum of medical
conditions that require treatment and care. Moreover, care for non-alcohol related
32conditions is more complex and thus more expensive for patients who are also
alcohol abusers. Because of this, we spend $100.7 million on medical care that
would not otherwise be incurred in a world with no alcohol abuse.
Premature mortality. Alcohol causes premature death, and with loss of life comes
a loss of earnings and productivity that would otherwise have taken place. That is
a huge cost to the economy – we estimate that the value of lost earnings due to
early death in 2005 was $296.8 million. Of this total, $200.6 million was due to
death caused by alcohol induced medical ailments, and $96.2 million was due to
deaths caused by alcohol-caused motor vehicle crashes.
Morbidity. Alcohol causes impairment, which translates into reduced ability to
function in the workplace. The loss in economic output due to lost productivity is
sizable – we estimate that $53.3 million more could be produced throughout the
state economy if the debilitating impact of alcohol could be avoided.
Crime. Alcohol affects judgement, and is a precipitating factor in the commission
of many types of crime, including assault, rape, and homicide. The costs incurred
in law enforcement, administration of courts and incarceration of criminals
convicted of crimes that occur because of alcohol abuse amounts to $49.1 million.
Of course, the tragedies that can result from alcohol abuse – such as those listed above –
produce a toll on families and individuals that goes beyond dollars and cents. But the
quantification we attempt to carry out in this study can at least bring to light the economic
side of the story.
Moreover, there are a number of costs inflicted by alcohol that the available data did not
allow us to estimate and include in the total reported above. These include:
Fire. Each year, fires are started by those who have been drinking, causing
property losses, injuries and possibly loss of life. They also are reflected in higher
insurance premiums paid by drinkers and non-drinkers alike.
Loss of function from alcohol-related injuries. We were unable to obtain good
estimates on the degree to which the productive abilities of those who have been
injured because of alcohol-related accidents – either on the highways or elsewhere
– have been affected as a result.
Victim costs resulting from crimes. The losses to those affected by alcohol-
induced criminal activity – both the crime victims as well as the families and
children of the criminals – are not reflected in this report.
The exclusion of these items makes it likely that the true cost of alcohol abuse is higher
than the $510.6 million reported above.
33One final point should be made. The cost of alcohol abuse to the state economy goes on
year after year. With no intervention to bring these costs under control, we can expect to
pay a tax – in the form of a smaller economic pie than we would otherwise enjoy – of a
half a billion dollars each year that our collective drinking behaviors produce outcomes
like those reported in this study.
348. References
Blincoe, L. A. Seay, E. Zaloshnja, T..Miller, E. Romano, S.Luchter, R.Spicer, “The
Economic Impact of Motor Vehicle Crashes, 2000”. U.S. Department of
Transportation, May, 2002.
County of San Diego Health and Human Services Agency Alcohol and Drug Services,
“Analysis of the Economic Costs of Alcohol and Other Drug Use and Abuse in
San Diego County,” October 7, 2002.
Drug and Alcohol Services Information System, “Alcohol and Drug Services Study
(ADSS) Cost Study,” The DASIS Report, June 18, 2004.
Harwood, H., Updating Estimates of the Economic Costs of Alcohol Abuse in the United
States: Estimates, Update Methods, and Data. Report prepared by The Lewin
Group for the National Institute on Alcohol Abuse and Alcoholism, 2000.
Harwood, H.; Fountain, D.; and Livermore, G., “The Economic Costs of Alcohol and
Drug Abuse in the United States,1992.” Report prepared for the National
Institute on Drug Abuse and the National Institute on Alcohol Abuse and
Alcoholism, National Institutes of Health, Department of Health and Human
Services. NIH Publication No. 98-4327. Rockville, MD: National Institutes of
Health, 1998.
Hoyert,Donna L., Ph.D.; Melonie P. Heron, Ph.D.; Sherry L. Murphy, B.S.; and
Hsiang-Ching Kung, Ph.D.; “Deaths: Final Data for 2003,” U. S. Centers for
Disease Control and Prevention, National Vital Statistics Reports, Vol. 54 No. 13,
(April 19, 2006), pp. 1-120.
International Classification of Diseases, 9th Revision, Clinical Modification, (ICD9-CM),
3rd Edition, Practice Management Corporation.
Liu, Liang Y., “Economic Costs of Alcohol and Drug Abuse in Texas – 2000,” Texas
Commission on Alcohol and Drug Abuse, December 2002.
Montana Board of Crime Control, Historical Crime Data, 2006.
http://www.mbcc.mt.gov
Montana Department of Justice, Montana Alcohol and/or Drug Related Crash Summary-
1978-2006. Montana: Montana Highway Patrol Crash Record.
http://www.doj.mt.gov/enforcement/highwaypatrol
Montana Department of Public Health and Human Services, Health Data and Statistical
Report, 2006. www.dphhs.mt.gov
35National Archive of Criminal Justice, National Corrections Reporting Program (NCRP),
2006. www.icpsr.umich.edu/NACJD/ncrp
Office of Vital Statistics, Montana Vital Statistics by County of Occurrence, 2005.
Montana: Montana Department of Public Health and Human Services, 2005
http://www.dphhs.mt.gov/
Office Of Substance Abuse, the Cost of Alcohol and Drug Abuse in Maine, 2005.
Maine Department of Health and Human Services, December, 2007.
http://mainegov-images.informe.org/dhhs/osa/pubs/data/2007/Cost2007.pdf
State Health Facts, Montana Health Insurance coverage of the Total Population, 2005-
2006. The Henry J. Kaiser Family Foundation, 2006. http://www.kff.org
United Nations, International Classification of Diseases (ICD), 2007. World Health
Organization, 2007. http://www.who.int/en/
U. S. Centers for Disease Control and Prevention, “Economic Impact of Motor-Vehicle
Crashes—United States, 1990,” MMWR Weekly, 42(23);443-448 (June 18, 1993).
U.S. Department of Justice, Justice Expenditure and Employment, 2006. Bureau of
Justice Statistics, 2006. http://www.ojp.usdoj.gov/bjs/eande.htm.
U.S Department of Justice, Uniform Crime Reports 2005, Washington, DC.:
Federal Bureau of Investigation (FBI), 2005. http://www.fbi.gov/ucr/ucr.htm
U.S. Department of Commerce, Annual Estimate of the population of counties
In Montana, 2006. U.S. Census Bureau, Population Division, 2006.
http://www.census.gov/popest/estimates.php
U.S Department of Commerce, Estimates of the Population for Counties of Montana,
2006. Washington D.C.: U.S. Census Bureau, Population Division, 2006.
http://www.census.gov/geo/www/fips/fips.html
U.S Department of Commerce, Federal Information Processing Standards (FIPS) Codes,
2005. Washington D.C.: U.S Census Bureau, Geography Division, 2005.
http://www.census.gov/geo/www/fips/fips.html
U.S Department of Justice, Comparing Federal and State Prison Inmates, 2005.
Washington, D.C.: Bureau of Justice Statistics.
U.S Department of Health and Human Services, Behavioral Risk Factor Surveillance
System, 1995-2007. Centers for Disease Control and Prevention (CDC)
http://www.cdc.gov/
36U.S. Department of Health & Human Services, Treatment Episode Data Set (TEDS),
1994-2006. Washington, D.C: Substance Abuse & Mental Health Services
Administration (SAMHSA), 2006. http://www.samhsa.gov
U.S. Department of Commerce, Annual Earning, 2005. U.S. Census Bureau, American
Community Survey, 2005. http://www.census.gov
U.S. Department of Health and Human Services, the Economic Costs of Alcohol and
Drug Abuse in the United States, 1992-1998. National Institutes of Health (NIH),
National Institute on Drug Abuse (NIDA), 1998.
http://www.nida.nih.gov/NIDAHome.html
U.S Department of Justice, Census of Jail Inmates and National Prisoner Statistics, 2005.
Bureau of Justice Statistics, 2005. http://www.ojp.usdoj.gov/bjs/welcome.html
U.S. Department of Transportation, Montana toll of Motor Vehicle Crashes, 2005.
National Highway Traffic Safety Administration (NHTSA), 2005.
http://www.nhtsa.dot.gov/
U.S. Department of Labor, Labor Force Statistics, 2005. Bureau of Labor Statistics,
Population Survey, 2005. http://www.bls.gov/
U.S. Department of Commerce, Law Enforcement, Courts, and Prisons, 2007. U.S
Census
Bureau, Statistical Abstract of the United States, 2007. 2007.
http://www.census.gov/prod/2006pubs/07statab/law.pdf
U.S. Department of Health & Human Services, Health Expenditures by State, 1991-2004.
Centers for Medicare & Medicaid Services, 2004. http://www.cms.hhs.gov/
U.S. National Institute for Alcoholism and Alcohol Abuse, Volume Beverage and
Ethanol Consumption for States, Census Regions, and the United States, 1970-
2005. http://www.niaaa.nih.gov/Resources/Database-
Resources/QuickFacts/AlcoholSales/consum02.htm
Wickizer, Thomas M. “The Economic Costs of Drug and Alcohol Abuse in Washington
State, 1996,” Division of Alcohol and Substance Abuse, Department of Social and
Health Services, (March 1999).
37You can also read