Air Quality Agreement - United States Canada - Progress Report 2004 - EPA
←
→
Page content transcription
If your browser does not render page correctly, please read the page content below

United States   •   Canada
Air Quality Agreement

     Progress Report     2004
American spelling is used
 throughout the 2004
   Progress Report.

United States   •   Canada
Air Quality Agreement

      Progress Report

         2004
The International Joint Commission Requests Your
Comments on This Report
The International Joint Commission (IJC) is responsible for inviting public comment
on the Air Quality Agreement Progress Reports and for providing a synthesis of the
comments to the governments to assist them in implementing the Agreement.
Comments on any aspect of the Agreement would be appreciated.

   • Do you feel the Agreement has been successful?

   • Are there other transboundary air quality issues that should be addressed
     throughout this Agreement?

   • Are the progress reports useful?

Written comments on this report should be sent by February 28, 2005 to:

Secretary, United States Section           Secretary, Canadian Section
International Joint Commission             International Joint Commission
1250 23rd Street, NW                       234 Laurier Avenue, West
Suite 100                                  22nd Floor
Washington, DC 20440                       Ottawa, Ontario K1P 6K6
Fax: (202) 467-0746                        Fax: (613) 993-5583
Email: commission@washington.ijc.org       Email: commission@ottawa.ijc.org
Contents
Introduction .................................................................................................ii

Section 1—Commitments ..............................................................................1

Acid Rain Annex......................................................................................................1
   Overview........................................................................................................................1
   Progress on Canadian and U.S. Sulfur Dioxide Emission Reductions ...................................1
   Progress on Canadian and U.S. Nitrogen Oxides Emission Reductions ................................3
   Emissions Monitoring ......................................................................................................4
   Acid Deposition Monitoring, Modeling, Maps, and Trends ...................................................5
   Preventing Air Quality Deterioration and Protecting Visibility ..............................................6
   Consultation and Notification of Significant Transboundary Air Pollution..............................9

Ozone Annex ........................................................................................................10
   Overview ......................................................................................................................10
   Key Commitments and Progress.....................................................................................10
   Anticipated Additional Control Measures and Indicative Reductions...................................16
   Reporting PEMA Emissions.............................................................................................18
   Reporting Air Quality for All Relevant Monitors within 500 km of the Border between the
   United States and Canada .............................................................................................21
   Summary of Ozone Annex Review Meeting .....................................................................23

Progress and Updates on Ozone and Particulate Matter ...........................................24

Section 2—Related Air Quality Efforts ..........................................................26
   New England Governors and Eastern Canadian Premiers .................................................26
   U.S.–Canada Border Air Quality Strategy Pilot Projects.....................................................27

Section 3—Scientific and Technical Cooperation and Research .......................28
   Emission Inventories and Trends ....................................................................................28
   Air Quality Reporting and Mapping .................................................................................30
   Transboundary Particulate Matter Science Assessment.....................................................33
   Health Effects ...............................................................................................................37
   Aquatic Effects Research and Monitoring ........................................................................38
   Forest Effects................................................................................................................39

Conclusion .................................................................................................42

Appendix—United States–Canada Air Quality Committee ...............................43
ii    United States–Canada Air Quality Agreement—Progress Report 2004

                           Introduction
                               The 2004 Progress Report, prepared by the
                           bilateral Air Quality Committee, is the seventh
                           biennial report compiled under the 1991 United
                           States–Canada Air Quality Agreement. While
                           building upon previous progress reports, this report
                           reviews key actions taken by the United States and
                           Canada in the last two years to address transboundary air pollution under the
                           Agreement. It also covers each country’s progress in achieving the requirements of
I N T R O D U C T I O N

                           Annex 1—the Acid Rain Annex. In addition, this report specifically focuses on actions
                           taken by each country to meet new requirements under Annex 3—the Ozone Annex.

                               To prepare the 2004 Progress Report, the Air Quality Committee took into
                           account public comments it received through the International Joint Commission (IJC)
                           regarding the 2002 Progress Report. (A summary of nearly 40 comments received can
                           be found on the IJC Web site at ). In addition, the report reflects decisions made at the June 2004 meeting
                           in Canada to review progress in implementing the Ozone Annex. In preparation for the
                           June meeting, in-country stakeholder meetings were held in March and May 2004.

                               Section 3 of this document addresses the joint report, Transboundary Transport,
                           Trends in, and Analysis of Fine Inhalable Particles in the Transboundary Region.
                           This technical report on particulate matter is the product of a scientific collaboration
                           between the United States and Canada and is being used for decisionmaking on future
                           updates to the Air Quality Agreement. It is just one example of the ways in which both
                           countries are working together to further address their common air quality goals.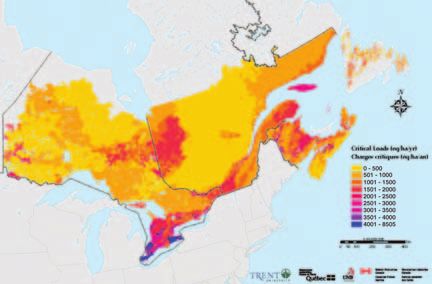
Section 1:
Commitments
Acid Rain Annex
Overview
S
ince the Acid Rain Annex was developed as part of the
original Air Quality Agreement in 1991—to address sul
fur dioxide (SO2) and nitrogen oxides (NOx) emissions,
particularly from electric power generation, as well as visibility
protection, preventing air quality deterioration in clean areas,
and emissions monitoring—the United States and Canada have
taken significant actions to address acid rain. Both countries
have established objectives for emission limitations or reductions, programs to implement
these objectives, as well as timetables for implementation.
Progress on Canadian and U.S. Sulfur Dioxide Emission
Reductions1
CANADA
Canada has been very successful in reducing the In 2001, SO2 emissions in the seven easternmost
emissions of SO2, a principal cause of acid rain.2 provinces, where elevated acid deposition
1
The SO2 commitments are listed in the United States–Canada Air Quality Agreement Annex 1: Specific Objectives Concerning Sulfur Dioxide and
Nitrogen Oxides, Section 1. Sulfur Dioxide, Part A for the United States and Part B for Canada.
2
Sulfate deposition is the primary acidifying agent in eastern Canada and the United States. The relative importance of nitrogen deposition is
expected to increase, however, as sulfur deposition decreases.
2 United States–Canada Air Quality Agreement—Progress Report 2004
Figure 1. Canadian SO2 Emissions from have decreased about 50 percent since 1980, to
Acid Rain Sources* (1980–2001) 2.4 million tonnes in 2002, or 25 percent below
the national cap. (See Figure 1 to compare east
5
ern Canada emissions to national emissions and
4.6 National Emissions
4. 5 Eastern Canada Emissions from 1980 to 2001.)
National Cap
Emissions (million tonnes)
4 3.8 3.7 Eastern Canada Cap
3.3
The Canada-wide Acid Rain Strategy for Post
3. 5 3.2
3
3.0 2000 serves as a framework for addressing the
2.7 2.6
2. 5
2.5
2.3
2.5 2.4 2.4 country’s acid rain problem. The long-term goal of
2 1.8 1.7 1.6 1.6 1.6
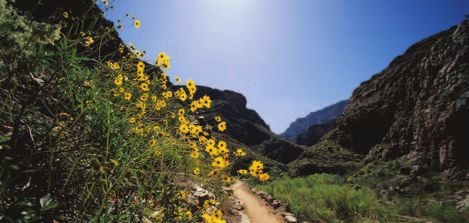
the Strategy is to achieve critical loads4 for acid
1. 5 deposition for aquatic and terrestrial ecosystems.
1 As part of the Strategy, the provinces of Ontario,
0. 5
Quebec, New Brunswick, and Nova Scotia all
0
1980 1985 1990 1994 1995 1999 2000 2001 committed to an additional 50 percent reduction
in their SO2 emissions beyond their 1985 Eastern
* Total SO2 emissions
Canada Acid Rain Program targets by 2010.5
Source: Environment Canada
Although these provinces have not yet finalized
continues to damage sensitive ecosystems, were plans for implementing the new reductions, each
28 percent below the eastern Canada 2.3 million has taken significant steps towards identifying
tonne3 cap, even though the cap expired in measures for industrial sectors to achieve the
C O M M I T M E N T S
December 1999. Canada’s total SO2 emissions specified reductions.
UNITED STATES
The United States has made substantial progress in Under the Acid Rain Program, the number of
reducing SO2 emissions, with the highest level of allowances allocated in a given year to a particu
reduction being achieved by the electric power sec lar unit is determined by provisions in the Clean
tor. By 2003, four years into Phase II of the Acid Air Act. All allowances are tradable, allowing
Rain Program, electric power sources in the United them to be bought or sold. Every year, however,
States reduced SO2 emissions by 5.1 million tons, each individual source must hold enough
or 32 percent, compared to 1990 levels, and more
than 38 percent compared to 1980 levels. (Figure 2
Figure 2. U.S. SO2 Emissions from Electric
shows the trend in SO2 emissions from 1980 to
Power Generation (1980–2003)
2003 for electric power sources.) Reductions
from all source categories are expected to result
in an SO2 emission reduction of 10 million tons 20 Phase I sources All sources
annually from 1980 levels, with 8.5 million tons 18 17.3 Phase II sources Allowances allocated
Emissions (million tons)
16.1 15.7 for that year
16
achieved by the electric power sector alone. In 14 13.0 13.1 12.5
2003, 3,497 electric generating units were sub 11.9 12.5 11.2
12
10.6 10.2 10.6
ject to the SO2 provisions of the Acid Rain 10
8
Program. (Annual fluctuations in the number of 6
units participating in the program can result 4
9.4 9.3 8.7
2 5.3 5.4 5.5 5.3 4.9
from retirements of some units and start-up of
0
other units. For further details, visit 1980 1985 1990 1995 1996 1997 1998 1999 2000 2001 2002 2003
.)
Source: EPA
3
One tonne is equal to 1.1 short tons.
4
Critical loads are the maximum amount of acidifying deposition an ecosystem can tolerate in the long term without being damaged. Canada’s goal
for acid rain is to meet its critical loads.
5
Ontario's target is currently 2015, although the province has proposed and is consulting on advancing the timeline to 2010. Nova Scotia's forecast
of 94.5 kilotonnes by 2010 is a reduction target from existing sources and is not meant to be a cap.
Section 1—Commitments—Acid Rain Annex 3
allowances to equal or exceed its annual emis 2003, for the first time since 1998. More impor
sions. Allowances that are not used or sold in a tantly, the price of natural gas rose by 55 percent
given year are carried over (or banked) for future in 2003, which resulted in approximately a 9 per
use. Banked emissions give sources the flexibility cent decline in natural gas generation. Sources
to emit more in years when energy demand is were forced to use other types of generation to
higher without affecting the total emissions cap meet electricity demand, and that need was pri
under the program. Thus, annual fluctuations in marily filled by coal-fired and oil-fired generation.
SO2 emissions are expected. Despite the increase in emissions from 2002 lev
els, emissions under the Acid Rain Program were
In 2003, a total of 9.5 million allowances were
lower than 2000 levels and substantially lower
allocated; however, sources actually emitted
than 1990 levels.
10.6 million tons, decreasing total banked
allowances by 1.1 million tons. Over time, In addition to the electric power generation sec
affected sources will continue to use banked tor, other sources achieved reductions in SO2
allowances to help comply with the more emissions, including smelters and sulfuric acid
stringent Phase II requirements. manufacturing plants. The use of cleaner fuels in
residential and commercial burners also con
In 2003, national annual SO2 emissions under
tributed to the nearly 41 percent decline of SO2
the Acid Rain Program were 400,000 tons (4 per
emissions from all sources, compared to the 1980
cent) higher than 2002 levels. Acid rain sources
level of 25.9 million tons. (For more details, visit
C O M M I T M E N T S
increased their heat input by 1.2 percent com
the National Emission Inventory at
pared with 2002. One reason for this increase was
.)
that nuclear generation was down 2 percent in
Progress on Canadian and U.S. Nitrogen Oxides
Emission Reductions6
CANADA
Though Canada has surpassed its NOx emis NOx emissions, were identified for several
sion reductions target at power plants, major sectors contributing significantly to emissions
combustion sources, and metal smelting oper of PM and ozone precursors. These options
ations by 100,000 tonnes below the forecast should be useful to assist jurisdictions in iden
level of 970,0007 tonnes, the country is con tifying best available technologies (BAT) and
tinuing to develop programs to further reduce developing plans to meet the Canada-wide
NOx emissions nationwide (see Section 2). In Standards for PM and ozone by 2010.
fact, the provinces and federal government are
In addition to the efforts to reduce NOx emis
working together to achieve multi-pollutant
sions from stationary sources such as indus
emission reductions for pollutants contribut
tries, Canada’s agenda to reduce the largest
ing to particulate matter (PM) and ozone for
source of NOx emissions—from vehicles and
key industrial sectors. Analytical studies have
fuels—is aggressive. Details for implementing
characterized pollutants that chemically react
this agenda can be found in the ozone section
to form PM and ozone (including NOx). In
of this report, under “Key Commitments and
addition, a range of emission control options,
Progress” on page 10.
including measures and actions to reduce
6
The NOx commitments are listed in the United States–Canada Air Quality Agreement Annex 1: Specific Objectives Concerning Sulfur
Dioxide and Nitrogen Oxides, Section 2. Nitrogen Oxides, Part A for the United States and Part B for Canada.
7
The 970,000 tonnes is forecast for 2005 in the NOx/VOC Emission Forecast 90-B in the 1990 NOx/VOC Management Plan. Historical
emissions and projections are subject to change as methodologies improve for estimating and forecasting emissions.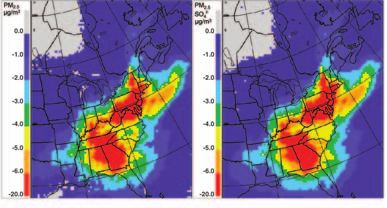
4 United States–Canada Air Quality Agreement—Progress Report 2004
UNITED STATES
Coal-fired electric utility units affected by the Figure 3. U.S. NOx Emissions from Electric
NOx component of the Acid Rain Program con- Power Generation (1990–2003)
tinue to meet and exceed the annual 2 million
7 6.7
ton reduction goal from what emission levels
6.1 6.0 6.0
5.9
would have been without the program, set by 6 5.5
Emissions (million tons)
Title IV of the 1990 Clean Air Act Amend 5.1
5 4.7
4.5
ments. In 2003, the 1,004 NOx program- 4.2
4
affected units reduced their combined NOx
emissions to 3.8 million tons. In addition, total 3
5.5 5.4 5.4 5.5 5.3
NOx emissions for all Acid Rain Program- 4.8
4.5
2 4.1 4.0 3.8
affected units were 4.2 million tons (see Figure
3 for NOx emissions from 1990 to 2003). 1
0
Emissions Monitoring
1990 1995 1996 1997 1998 1999 2000 2001 2002 2003
NOx Program affected units
Title IV sources not affected by NOx Program
C O M M I T M E N T S
CANADA8 Source: EPA
Canada has met its commitments to estimate emis in part, on experience gained from the use of 40
sions of NOx and SO2 from new electricity utility CFR Part 75 specifications for CEMS in the
units and existing electricity units greater than 25 United States. Although CEMS and data report
megawatts (MW) using a method of comparable ing requirements for power plants and industrial
effectiveness to continuous emission monitoring sources involved in emissions trading in the
systems (CEMS) and to investigate the feasibility United States are not fully mirrored in Canada, it
of using CEMS by 1995. In Canada, emissions has been concluded that EPS 1/PG/7-compliant
trading of SO2 and NOx is not currently a driver CEMS in Canada would meet Canadian monitor
for electronic data reporting and CEMS. Currently, ing requirements for domestic purposes. However,
Environment Canada is undertaking an update of the feasibility of cross-border emissions trading is
its 1993 guidelines for CEMS (“Protocols and now being examined and indications are that
Performance Specifications for Continuous certain enhancements of emissions monitoring in
Monitoring of Gaseous Emissions from Thermal Canada would be required, if there was cross-
Power Generation,” Report EPS 1/PG/7) based, border trading.
UNITED STATES9
Under the Acid Rain Program, affected units are capabilities were added, including software that
required to measure and record emissions using performs hourly checks to catch errors, miscalcu
CEMS or an approved alternative measurement lations, and oversights in monitoring and report
method and report emissions electronically. All of ing systems. These audits help ensure the
the monitoring systems operate with a high completeness, high quality, and integrity of emis
degree of reliability. In fact, the percent monitor sion data as well as highlight a number of poten
data availability (a measure of monitoring sys tial “red flags” that require additional verification.
tems’ reliability) for 2003 was 99 percent for coal- Accurate emissions monitoring remains the back
fired units. Additionally, in 2003, new audit bone of trading program integrity.
8
The Canadian commitments are listed in the United States–Canada Air Quality Agreement, Annex 1: Specific Objectives Concerning Sulfur Dioxide
and Nitrogen Oxides, Section 3, Compliance Monitoring, Part A and B. Utility Units and Other Major Stationary Sources, Subsection 2 and 3 for
Canada and for both parties.
9
The U.S. commitments are listed in the United States–Canada Air Quality Agreement Annex 1: Specific Objectives Concerning Sulfur Dioxide and
Nitrogen Oxides, Section 3, Compliance Monitoring, Part A. Utility Units, Subsection 1 for the United States and 3 for both parties.Section 1—Commitments—Acid Rain Annex 5
Acid Deposition Monitoring, Modeling, Maps, and Trends10
Airborne pollutants are deposited on the earth’s Early 1990s sulfate and nitrate wet deposition data
surface by three processes: 1) wet deposition (rain are illustrated in Figures 4 and 6, to be compared
or snow); 2) dry deposition (particles and gases); with 2002 data in Figures 5 and 7, to show trends.
and 3) deposition by cloud water and fog. Wet Wet sulfate deposition measurements are correct-
deposition is comparatively easy to measure using ed for sea-salt, to derive non-sea-salt sulfate (nss
precipitation gauges and is regularly used as the SO42-), at sites in proximity to oceans. Blank areas
reference measure for comparison with emissions. on the maps indicate that measurement data were
Figure 4. Average Wet Sulfate Deposition Figure 5. Annual Wet Sulfate Deposition
(1990–1994) (2002)
C O M M I T M E N T S
Figure 6. Average Wet Nitrate Deposition Figure 7. Annual Wet Nitrate Deposition
(1990–1994) (2002)
Source: NAtChem (www.msc-smc.ec.gc.ca/natchem/index_e.html) and NADP (http://NADP.sws.uiuc.edu)
10
The commitments are listed in the United States–Canada Air Quality Agreement Article VI and Annex 2: Scientific and Technical Activities and
Economic Research.6 United States–Canada Air Quality Agreement—Progress Report 2004
insufficient for the creation of deposition con support wet deposition sites. Recently a few addi
tours. Figures 4 and 6 are each five-year averages tional sites in the more remote portions of
for baseline comparisons, whereas Figures 5 and 7 Canada have been added to CAPMoN to provide
are the most recent annual averages for which more detailed deposition data.
data are available. Comparison of one year’s data
The United States has three coordinated acid
with a five-year average might introduce a bias
deposition networks:
due to specific weather conditions in 2002.
1) The National Atmospheric Deposition
Wet sulfate deposition is greatest in eastern
Program/National Trends Network
North America, along an axis running from the
(NADP/NTN), a collaboration of federal,
Mississippi River to the lower Great Lakes.
state, and non-governmental organizations
Decreasing deposition is evident in the Ohio
measuring deposition chemistry
River basin and southern Ontario and Quebec.
(http://nadp.sws.uiuc.edu).
Sulfate deposition of more than 25 kg/ha/yr persists
2) The NADP/Atmospheric Integrated Research
south of Lake Erie; however, this amount is still a
Monitoring (AIRMoN) network (a subnet
significant reduction from the early 1990s, when
work of NADP operated by the National
wet deposition in this area exceeded 30 kg/ha/yr.
Oceanic and Atmospheric Administration).
The pattern for wet nitrate deposition is centered
3) The EPA/National Park Service Clean Air
on the lower Great Lakes with an axis running
C O M M I T M E N T S
Status and Trends network (CASTNET),
from southeastern Missouri towards the Gulf of
which provides dry deposition data
St. Lawrence. Comparison of 2002 data with the
(www.epa.gov/castnet).
average for 1990 through 1994 shows persistent
deposition. Procedures for all U.S. and Canadian networks are
standardized and contribute to an integrated, con
Trends in wet deposition of sulfate and nitrate
sistent dataset, which is accessible to the public at
correspond to changes in SO2 and NOx emissions.
.
In Canada, wet and dry deposition components Techniques for estimating dry deposition based on
are measured in the federal Canadian Air and measurement data are undergoing steady improve
Precipitation Monitoring Network (CAPMoN) ment, as there are indications that this contribu
(www.msc-smc.ec.gc.ca/capmon). Some provin tion to total deposition might have been
cial governments (e.g., British Columbia, underestimated in the past.
Alberta, Quebec, New Brunswick, Nova Scotia,
Newfoundland) and the Northwest Territories
Preventing Air Quality Deterioration and Protecting Visibility11
In certain areas in the United States and Canada, many visitors are not able to see the spectacular vis
tas they expect. During much of the year, a veil of white or brown haze hangs in the air, obstructing the
view. Most of this haze comes from air pollution, carried by the wind, often many hundreds of miles
from where it originated.
CANADA
Pollution prevention, continuous improvement quality and address the pollutants involved in vis-
(CI), and Keeping Clean Areas Clean (KCAC) ibility impairment. These activities are being
activities are all part of the Canada-wide conducted in addition to achieving the standards
Standards to prevent the deterioration of air for PM and ozone by the 2010 target date. The
11
The commitments are listed in the United States–Canada Air Quality Agreement Annex 1: Specific Objectives Concerning Sulfur Dioxide and
Nitrogen Oxides, Section 4. Prevention of Air Quality Deterioration and Visibility Protection, Part A for the United States and Part B for Canada.Section 1—Commitments—Acid Rain Annex 7
KCAC principle recognizes that polluting “up to
a limit” is not acceptable and that the best strate
gy to avoid future problems is to keep clean areas
clean. CI applies to areas with ambient pollutant
levels below those of existing standards but still
above levels associated with observable health
effects. The CI framework encourages jurisdic
tions to take remedial and preventive actions to
reduce emissions from anthropogenic sources to
the extent practicable. Jurisdictions are currently
developing a national guidance document on
CI/KCAC, which is expected to be completed in
late 2004.
Federal, provincial, and territorial governments
are working with stakeholders to establish imple
mentation plans and programs for the Canada-
wide Standard for PM2.5 and ozone that apply
pollution prevention and best management prac
tices. These practices could include ensuring that
C O M M I T M E N T S
Electricity Generation” issued under the
new facilities and activities incorporate the best
Canadian Environmental Protection Act (CEPA)
available economically feasible technology
of 1999. These guidelines are intended to provide
(BAEFT) to reduce PM and ozone levels and
national emission standards for application by the
reviewing new activities that might contribute to
provinces to new coal-, oil-, and gas-fired, steam-
PM and ozone level increases.
electric power plants. The new guidelines include
One of the largest contributors from stationary revised emission limits for SO2, NOx, and PM,
sources is the electric power sector. Therefore, in consistent with the performance capability of cur
January 2003, the government of Canada set out rent BAEFTs. In particular, the new emission lim
more stringent emission targets for key air pollu its align with U.S. standards and best available
tants from new fossil fuel power plants in “New control technology (BACT) determinations.
Source Emission Guidelines for Thermal
UNITED STATES
The U.S. Prevention of Significant Deterioration visibility conditions at Class I areas with the goal
(PSD) program protects public health and the of restoring natural visibility conditions in about
environment from adverse effects that could occur 60 years. The first set of plans is due in early 2008.
from the addition of new sources of air pollution.
SO2 and NOx gases are transformed in the atmos
It also ensures that air quality in many areas of the
phere into fine particles of sulfates and nitrates.
country remains better than levels mandated by
Sulfate and nitrate particles scatter and absorb
the National Ambient Air Quality Standards
light, impairing visibility and contributing to
(NAAQS). The program preserves and protects
haze. Sulfates are generally the largest contributor
air quality in Class I areas by assessing impacts on
to visibility impairment in both the East and the
visibility before construction permits are issued.
West. The visual range under naturally occurring
Class I areas are national parks and wilderness
conditions without air pollution in the United
areas such as the Grand Canyon, Yosemite, and
States is approximately 45 to 90 miles (75 to 150
the Great Smokies. The Regional Haze Program
km) in the East and 120 to 180 miles (200 to 300
requires states to develop plans to improve
km) in the West.8 United States–Canada Air Quality Agreement—Progress Report 2004
Data from the IMPROVE (Interagency (VISTAS), the Midwest RPO, the Central States
Monitoring of Protected Visual Environments) Regional Air Partnership (CENRAP), and the
network indicate little change in visibility during Western Regional Air Partnership (WRAP). The
the past decade. (See Figure 8 for the annual RPOs hold their own technical work group ses
average standard visual range.) The level of visi sions throughout the country to make decisions
bility impairment on the worst visibility days in on joint technical work, such as assessments of
the West is similar to the levels seen on the best international transport. The RPOs coordinate
visibility days in the East. In 2001, the mean technical information on emissions, ambient
visual range for the worst days in the East was monitoring, and air quality modeling activities.
only 18 miles (29 km), compared to 73 miles The RPOs are seeking ways for more involvement
(117 km) for the best visibility. In the West, visi by air quality agencies in Canada in their assess
bility impairment for the worst days remained rel ment of pollutant formation and transport. (For
atively unchanged over the 10-year period, with more information on the U.S. visibility program
the mean visual range for 2001 (63 miles, or 103 and RPOs, see .)
or 98 km). Although that 10-year period showed
On February 23–24, 2004, the International
moderate improvements in some areas, overall
Joint Commission’s Air Quality Advisory Board
visibility in the East is still significantly impaired
held a Workshop on Clean Areas and PSD in
in national parks and wilderness areas, especially
Vancouver, British Columbia. The purpose of this
C O M M I T M E N T S
on the haziest days.
workshop was to review the current challenges
To implement the requirements of the Regional and possible joint opportunities for clean area
Haze Program, states work together in five management policies in the transboundary
regional planning organizations (RPOs) to devel region. The workshop examined the PSD and
op strategies to address regional haze and visibili Regional Haze programs in the United States and
ty. The five RPOs are the Mid-Atlantic/ the KCAC provisions of the Canada-wide
Northeast Visibility Union (MANE-VU), the Standards for ozone and PM.
State and Tribal Association of the Southeast
Figure 8. Annual Standard Visual Range (2002)
Source: National Park ServiceSection 1—Commitments—Acid Rain Annex 9
Consultation and Notification of Significant Transboundary
Air Pollution12
JOINT EFFORTS
The United States and Canada have ongoing U.S. and Canadian representatives of the federal,
notification procedures, established in fall 1994, state, and provincial governments, the Inter
to identify possible new sources and modifications Tribal Council in Michigan, and Algoma Steel
to existing sources of transboundary air pollution continue to operate a comprehensive ambient air
within 62 miles (100 km) of the border. monitoring network in the United States and
Notifications can occur for new and existing
sources located outside of the 62 mile (100 km)
region if governments believe that there is the
potential for transboundary pollution. Since the
last progress report in 2002, the United States has
notified Canada of 11 additional sources, for a
C O M M I T M E N T S
total of 34. Canada has notified the United States
of 11 additional sources as well, for a total of 37.
Transboundary notification information is
available on the Internet sites of the two
governments at:
Canada:
www.ec.gc.ca/pdb/can_us/canus_applic_e.cfm
United States:
www.epa.gov/ttn/gei/uscadata.html
The United States and Canada report significant
continuing progress on joint discussions around
the Boundary Dam Power Station (BDPS) near
Estevan, Saskatchewan, and Algoma Steel, Inc.
in Sault Ste. Marie, Ontario. Canada. A report was prepared summarizing all
SaskPower, the operator of BDPS, has completed monitoring data collected in the binational area
the installation of electrostatic precipitators between 2001 and 2003. The draft report was
(ESPs) on all units at the power station. The issued in late fall of 2004 and included a brief
ambient air monitoring network was established executive summary for public information and a
prior to installing the ESPs to track changes in air longer technical report. The Canadian federal
quality before and after installation of this control and provincial agencies have worked with the
technology. The latest report of ambient air mon steel company to achieve emission reductions.
itoring data from the network through 2003 Despite these abatement measures, citizens in
showed no exceedances of the applicable ambient Michigan continue to express their concern about
air quality standards at any of the sites. the pollution from this plant.
12
The commitments listed in this section come from the United States–Canada Air Quality Agreement, Article V, Assessment, Notification,
and Mitigation.10 United States–Canada Air Quality Agreement—Progress Report 2004
Ozone Annex
Overview
T
he United States and Canada signed the
Ozone Annex to the Air Quality Agreement
in December 2000 (www.ec.gc.ca/air/
pdfs/can_usa_e.pdf). This Annex is expected to
significantly reduce NOx and volatile organic
compound (VOC) emissions—the precursor
pollutants to ground-level ozone, a major
component of smog. This Annex defines a
C O M M I T M E N T S
transboundary region in each country, known as
the Pollutant Emission Management Area (PEMA) (see Figure 9). The states and provinces with
in this region are the areas where emission reductions are most important for transboundary
ozone. In the United States, the region covers 18 states and the District of Columbia (approxi
mately 40 percent of the U.S. population). In Canada, the region includes central and southern
Ontario and southern Quebec (more than 50 percent of Canada’s population).
Key Commitments and Progress
CANADA13
Vehicles, Engines, and Fuels U.S. Environmental Protection Agency (EPA)
rules for corresponding vehicles and engines.
New stringent NOx and VOC emission reduc-
tion standards for vehicles, including cars, The On-Road Vehicle and Engine Emission
vans, light-duty trucks, off-road vehicles, small Regulations were published in the Canada
engines, and diesel engines, as well as fuels. Gazette, Part II, on January 1, 2003, and came
into effect on January 1, 2004, for light- and
Canada is on track to implement all of its com heavy-duty vehicles and motorcycles. These regu
mitments for vehicles, engines, and fuels. lations replaced earlier vehicle emission regula
Consistent with the Federal Agenda on Cleaner tions under Transport Canada’s Motor Vehicle
Vehicles, Engines, and Fuels announced on Safety Act. The first-ever regulations for off-road
February 19, 2001, Environment Canada is engines, the Off-Road Small Spark-Ignition
implementing regulations that will align Engine Emissions Regulations, were published on
Canadian emission standards with the
13
The commitments listed in this section are summarized from the Ozone Annex 3: Specific Objectives Concerning Ground Level Ozone Precursors,
Part III—Specific Obligations, Section A for Canada.Section 1—Commitments—Ozone Annex 11
November 19, 2003, and become effective in Environment Canada is preparing to propose reg
2005. These two regulations, together with the ulations to control sulfur in diesel fuel for use in
Sulfur in Diesel Fuel Regulations and current reg off-road, rail, and marine engines aligning with
ulations and programs, will result in an estimated U.S. levels and timing (i.e., off-road: 500 ppm in
73 percent reduction of NOx emissions from on- 2007 and 15 ppm starting in 2010, and rail and
road vehicles by 2020, compared with the contin marine: 500 ppm in 2007 and 15 ppm in 2012).
uation of current emission controls.
A discussion draft of the planned Off-Road Stationary Sources of NOx
Compression-Ignition Emission Regulations was
issued in July 2003, prior to a formal proposal Annual caps by 2007 of 39 kilotonnes (kt) of
planned for 2004. These regulations will be fol NOx (as NO2) emissions from fossil-fuel power
lowed in 2004 and 2005 by proposals for recre plants in the PEMA in central and southern
ational marine engines (outboards and personal Ontario, and 5 kt of NO2 in the PEMA in
watercraft), large spark-ignition engines (engines southern Quebec, aligned with U.S. standards.
above 19 kilowatts (kW)), and recreational vehi Canada will comply with its commitment to cap
cles (such as snowmobiles and all-terrain vehicles). NOx emissions from large fossil fuel-fired power
Together, these regulations will cover all vehicle plants in the Ontario and Quebec portions of the
and engine types used in mobile applications. PEMA at 39 kt and 5 kt, respectively. Emissions
C O M M I T M E N T S
In the Ozone Annex, Canada committed to con from power plants in the Ontario PEMA were
tinue the application of its existing fuel regula approximately 78 kt in 1990 and approximately
tions that address sulfur in gasoline, for instance, 79 kt in 2002, but progress is underway towards
and to develop and implement a new regulation reductions by 2007. Preliminary emissions data for
to reduce the allowable level of sulfur in on-road 2003 indicate that NOx (as NO2) emissions from
diesel fuel. These commitments have been met power plants in the Quebec PEMA are above the
with the publication of the Sulfur in Diesel Fuel 5 kt cap. This is mainly due to the increased hours
Regulations in the Canada Gazette, Part II, on of operation for the Tracy power plant. Quebec is
July 31, 2002. The regulations limit the level of currently considering setting a specific regulatory
sulfur in diesel fuel used in on-road vehicles to a cap for the Tracy plant to help meet the 5 kt cap.
maximum of 500 parts per million (ppm),
reduced to 15 ppm commencing in 2006. Beyond Proposed National Guideline for
the requirements in the Ozone Annex, Renewable Low-Impact Electricity
Development of a proposed national Guideline
Figure 9. Ozone Annex Pollutant Emission for Renewable Low-Impact Electricity.
Management Area (PEMA)
After extensive multi-stake-
holder consultation, a notice
of a draft Renewable Low-
Impact Electricity (Green
Power) Guideline was pub
lished in the Canada Gazette,
Part I, in December 2001.
This guideline will provide
national guidance on environ
mentally preferable electricity
products and generation in
Canada and will establish cer
tification criteria for environ
mental labeling of qualifying
electricity products under
Canada’s Environmental
Choice Program (ECP).
Source: United States–Canada Air Quality Agreement, Ozone Annex12 United States–Canada Air Quality Agreement—Progress Report 2004
In fact, these criteria are already being used for measures to address VOC emissions from
certification of qualifying electricity products solvents, paints, and consumer products.
under this program.
After completing analysis reports for the six
Canada intends to monitor market uptake of industrial Multi-Pollutant Emission Reduction
these criteria as an indicator of improvement in Strategies (MERS) sectors (i.e., pulp and paper,
the environmental performance of electricity gen lumber and allied wood products, iron and steel,
eration and distribution sectors. Publication of a base metals smelting, hot mix asphalt plants, and
final guideline will be considered with other concrete batch plants) as well as the electric
options to maintain and enhance continuous power generation sector, Canada was able to
improvement in the environmental performance determine that these six industrial sectors are key
of this industry. to achieving the Canada-wide Standards for PM
and ozone. The information was prepared in con
Measures to Reduce VOCs sultation with provinces and stakeholders and is
publicly accessible from the CCME Web site
Reduction of VOC emissions through the devel- (www.ccme.ca/initiatives/standards.html). The
opment of two regulations, one on dry cleaning reports contain a description of each sector, emis
and another on solvent degreasing and the use of sions released, performance standards, available
VOC emission limits for new stationary sources. pollution prevention and control techniques, and
preliminary analyses of technically feasible emis
C O M M I T M E N T S
The Tetrachloroethylene (Use in Dry Cleaning
and Reporting Requirements) Regulation became sion reduction options. Provinces and territories
law on February 27, 2003, and is expected to will use the reports in preparing their implemen
result in a 70 percent reduction of tetrachloroeth tation plans.
ylene (PERC) releases at dry-cleaning facilities To provide further information and support to
from 1994 levels, by August 2005. The Solvent Canadian provinces and territories in developing
Degreasing Regulation went into effect on July their implementation plans, the following activi
24, 2003, and is expected to result in a 65 percent ties are underway:
reduction in consumption of trichloroethylene
• Iron and Steel: Environmental performance
(TCE) and PERC in solvent degreasing by 2007.
standards are being developed to address
The Canadian Council of Ministers of the releases of PM, NOx, SO2, and VOCs from the
Environment (CCME) has also completed and significant process sources of the iron and steel
endorsed 16 codes, guidelines, and standards, or sector. The existing CEPA Environmental
MOUs, for solvent-use subsectors. These docu Codes of Practice for integrated and non-inte-
ments are used to provide guidance to jurisdic grated iron and steel mills will be updated
tions for reducing VOC emissions from many through consultation with industry, non-gov-
industrial/commercial sectors, including, paints, ernment stakeholders, and the provinces to
coatings, printing, and storage tanks. In addition, incorporate environmental performance stan
a number of CCME codes or guidelines, devel dards for air pollutants, including precursors to
oped in the early to mid-1990s, are being PM and ozone, as well as total PM.
reviewed for updating.
• Base Metal Smelting and Refining: The
development of a draft Environmental Code
Measures for NOx and VOC Emissions of Practice is under discussion in consultation
to Attain the Canada-wide Standard with industry, non-governmental stakehold
for Ozone ers, and provinces with particular emphasis
on setting emission guidelines for SO2 and
Achievement of the Canada-wide Standard for PM discharges.
ozone in the PEMA by 2010, by undertaking by
2005 and implementing between 2005 and • Cement: The background information neces
2010 measures to reduce NOx emissions based sary to produce a foundation report for the
on a multi-pollutant emission reduction cement manufacturing industry is under
approach for key industrial sectors, and development for a planned national environ
mental code of practice.Section 1—Commitments—Ozone Annex 13
Canada published a “Federal Agenda for the modified industrial and commercial boilers, in
Reduction of VOC Emissions from Consumer accordance with CCME guidelines. In addition,
and Commercial Products” as a Notice of Intent when burners on existing units must be replaced,
in the Canada Gazette, Part I, on March 27, the replacements must be low-NOx burners.
2004. This Agenda outlines actions to be taken
With respect to VOC emissions, the amendments
between 2004 and 2010 to reduce emissions
to the RRQA are aimed at reducing emissions
from these sources and emphasizes alignment
from both the manufacture and application of
with measures in the United States, recognizing
surface coatings, commercial and industrial print
the North American market for many of these
ing, dry cleaning, above-ground storage tanks,
products.
petroleum refineries, and petrochemical plants.
In addition, the federal government has several
Pursuant to its Regulation on Petroleum Products
measures in place that should either directly or
(RPP), Quebec is currently applying provisions
indirectly result in VOC emission reductions in
aimed at reducing gasoline volatility during the
the solvent use sector. These include Guidelines
summer months in the city of Montreal and the
for Volatile Organic Compounds in Consumer
Gatineau–Montreal section of the Windsor–
Products under CEPA published in 2003.
Quebec City corridor.
These amendments will address Stage 1
Quebec Portion of the PEMA
initiatives, including gasoline storage, transfer
C O M M I T M E N T S
Measures to reduce NOx and VOC emissions in depots, and service stations for both new and
the Quebec portion of the PEMA. existing installations in the Quebec portion of
the Windsor–Quebec City corridor. The city of
Quebec made progress in meeting its Ozone
Montreal is currently enforcing regulatory pro
Annex commitments due to several regulatory
visions concerning gasoline vapor recovery in
actions. The planned amendments to Quebec’s
its territory.
Regulation Respecting the Quality of the
Atmosphere (RRQA) contain stricter standards
aimed at reducing NOx emissions from new and Ontario Portion of the PEMA
Measures to reduce NOx and VOC emissions in
the Ontario portion of the PEMA.
Ontario has fully met the Ozone Annex commit
ments with the following regulations and guidelines:
• The Ontario Drive Clean program (Ontario
Environmental Protection Act Regulation
361/98) was launched in the Greater Toronto
Area and Hamilton on April 1, 1999. Drive
Clean requires mandatory vehicle emissions
inspection and maintenance to reduce emis
sions of NOx, carbon monoxide (CO), and
VOCs. As of July 2002, the Drive Clean pro
gram has expanded to include southern
Ontario’s entire smog zone—an area that
includes an estimated 5.5 million vehicles.
The Drive Clean program’s standards for light-
duty vehicles were tightened by 11.5 percent
(from the original limits) in 2003 and will be
tightened an additional 11.5 percent in 2005.
Ontario requires all diesel-powered heavy-
duty trucks and buses to pass an annual emis
sions test and has imposed new standards14 United States–Canada Air Quality Agreement—Progress Report 2004
tightening opacity levels. (Opacity is a meas MOE Guideline A-5 through Certificates of
ure of the degree to which a substance blocks Approval; monitoring and recording are
the passage of light rays.) required.
Ontario also requires that all heavy-duty • In March 2001, MOE Guideline A-9 (Boilers
diesel school buses meet the stricter of the and Heaters) came into effect for NOx emis
two emission standards in place for other sions limits. Large boilers and heaters (new
heavy-duty diesel vehicles each year: a 35 and modified; greater than 10.5 gJ/h fuel feed
percent opacity level on April 1, 2004, and a rate; oil- and gas-fired) are covered.
30 percent level on April 1, 2005. Implementation through Certificates of
Approval is expected to reduce NOx emis
The Drive Clean’s Smog Patrol conducts ran
sions by 29,000 tonnes by 2015.
dom roadside testing of suspected polluting
vehicles and can issue tickets for violations. • As of May 2001, the Airborne Contaminant
Beginning in July 2002, the Smog Patrol Discharge Monitoring and Reporting
increased its staff to 30 members to enhance Regulation (Ontario Environmental Protection
enforcement. Since 1998, the Smog Patrol has Act Regulation 127/01), which replaces
conducted more than 29,000 vehicle inspec Ontario’s Electricity Generation Monitoring
tions and issued more than 5,250 tickets. and Reporting Regulation (Ontario Regulation
227/00), requires mandatory tracking and
• Stage 1 of the gasoline vapor recovery pro
C O M M I T M E N T S
annual public reporting by facilities in Ontario
gram was implemented in 1994, and the pro
if they emit significant amounts (above desig
gram continues today.
nated limits) of more than 350 air pollutants.
• The volatility in gasoline regulation has been
All reporting facilities are required to report
ongoing since 1991.
annual and smog season (May 1 to September
• Mandatory training is required every five 30) emissions each year by June 1. Emitters
years for at least one full-time employee of all with equipment having a heat input greater
dry cleaning establishments in Ontario. A than 73 MW must file quarterly reports on
new training course for dry cleaners has been SO2 and NOx within 60 days of the end of
successfully piloted by the Ministry of the each quarter. The reports are made publicly
Environment (MOE) and is now widely available via Ontario’s new (June 2002)
available through Seneca College to dry online emissions reporting registry, OnAIR,
cleaners across Ontario. at .
ary combustion turbines are limited underSection 1—Commitments—Ozone Annex 15
UNITED STATES14
• Implementation of the NOx transport emis- reductions one year earlier than required by
sion reductions program, known as the NOx the NOx SIP call. Further information on the
SIP (State Implementation Plan) call, in the NOx SIP call can be found at .
Compliance and emission data for all NOx
• Implementation of existing U.S. vehicle,
budget sources can be found at .
achieve both VOC and NOx reductions.
• Motor Vehicle Control Program. To address
• Implementation of existing U.S. rules for
motor vehicle emissions, the United States
control of emissions from stationary sources
committed to implementing regulations for
of hazardous air pollutants and control of
reformulated gasoline, controls and prohibi
VOCs from consumer and commercial prod-
tions on diesel fuel quality, light-duty vehi
ucts, architectural coatings, and automobile
cles, light-duty trucks, gasoline heavy-duty
repair coatings.
highway engines, and diesel heavy-duty high
• Implementation of 36 existing U.S. new way engines.
C O M M I T M E N T S
source performance standards, to achieve
VOC and NOx reductions from new sources.
NOx and VOC Program Updates
• NOx SIP Call (NOx Budget Trading
Program). The NOx SIP call requires affected
states to adopt and implement NOx control
measures to ensure that seasonal NOx emis
sions do not exceed specified levels. As the
result of court actions, EPA divided the NOx
SIP Call into two phases. Phase 1 accounts
for approximately 90 percent of the emission
reductions required by the NOx SIP call and
had a compliance date of May 31, 2004. The
compliance date for the Phase 2 reductions is
EPA has fully phased in requirements for
May 1, 2007. Phase 1 will provide approxi
reformulated gasoline in nonattainment
mately 900,000 tons of NOx emission reduc
areas; diesel fuel quality (including sulfur) to
tions in the SIP call region, which covers all
500 ppm; standards for highway heavy-duty
of the states in the PEMA except for Maine,
engines; and vehicle standards for light-duty
New Hampshire, Vermont, and Wisconsin.
cars and trucks, including on-board refueling
All of the affected states adopted a NOx cap for control of evaporative emissions.
and trade program for large electric generating
• Nonroad Engine Standards. EPA has applied
units and large industrial boilers and turbines
engine standards in all of the five nonroad
as the major control strategy. All jurisdictions
engine categories identified in the Annex:
have met the compliance deadline so far. Eight
aircraft, compression-ignition engines, spark-
states and the District of Columbia voluntarily
ignition engines, locomotives, and marine
adopted a May 1, 2003, compliance date for
engines. In addition, EPA has promulgated
Phase 1 and, thus, are achieving NOx emission
more stringent (Phase 2) standards for
14
The Commitments listed in this section come from Ozone Annex 3 Specific Objectives Concerning Ground Level Ozone Precursors, Part III—
Specific Obligations, Section B for the United States.16 United States–Canada Air Quality Agreement—Progress Report 2004
• VOC Controls on Smaller Sources. In 1998,
EPA promulgated national rules for automo
bile repair coatings, consumer and commercial
products, and architectural coatings. The com
pliance dates were January 1999, December
1998, and September 1999, respectively. From
a 1990 baseline, the consumer and commercial
products and architectural coatings rules each
are estimated to achieve a 20 percent reduc
tion in VOC emissions, and the automobile
repair coatings rule is estimated to achieve a
33 percent reduction in VOC emissions.
• Controls on Hazardous Air Pollutants. EPA
has promulgated regulations to control haz
ardous air pollutant emissions for all of the 40
categories listed in the Ozone Annex that
compression ignition engines and spark igni- will reduce VOC emissions. EPA is currently
tion engines. The Phase 2 standards are in implementing the majority of the regulations.
effect for compression-ignition engines, and Several regulations have future compliance
C O M M I T M E N T S
the Phase 2 standards for spark ignition dates, but all will be implemented prior to
engines will be fully phased in by 2007. 2010.
• New Source Standards. All of the 36 cate- • Nonroad Engines. The motor vehicle control
gories of new source performance standards program and nonroad engine regulations dis-
identified in the Ozone Annex for major new cussed previously under NOx controls also
NOx and VOC sources are in effect. provide reductions in VOC emissions.
Anticipated Additional Control Measures and
Indicative Reductions15
This section describes additional control measures that each country anticipates implementing beyond
the specific obligations in the Ozone Annex. It also provides NOx and VOC emission reduction esti
mates for the PEMA from implementation of both the specific obligations and the additional measures.
CANADA
National Reductions instruments, and voluntary initiatives that are best
suited to implementation on a national scale.
Achieving the Canada-wide Standard for ozone by
2010 is the shared responsibility of federal and
provincial/territorial governments. By 2005, all juris Area-Specific Reductions
dictions will have published their implementation Ontario continues to make progress towards its
plans outlining the measures they will take to commitments under the Ozone Annex and has
achieve the standard. The federal government pub committed to reducing NOx and VOC emissions
lished its Interim Plan in 2001 and updated it in by 45 percent below 1990 levels by 2015 under
2003. It includes a mix of regulations, economic the Anti-Smog Action Plan.
15
The progress addressed in this section results from Annex 3 Specific Objectives Concerning Ground Level Ozone Precursors, Part IV—Anticipated
Additional Control Measures and Indicative Reductions, Section A for Canada and Section B for the United States.Section 1—Commitments—Ozone Annex 17
Quebec proposes to modify its Regulation Figure 10. Canadian NOx and VOC
Respecting the Quality of the Atmosphere in PEMA Emissions and Projections
order to reduce NOx emissions from new and
modified industrial and commercial boilers and to
1.6
reduce emissions of VOCs from both the manu
facture and application of surface coatings, com 1990 2010
Emissions (Million Tons)
mercial printing, dry cleaning, oil refineries, and 1.2
petrochemical plants. It is also considering imple
menting initiatives to reduce emissions from .8
light- and heavy-duty motor vehicles.
.4
Quantitative Estimates
0
In the Ozone Annex, Parties provided NOx and NOx VOC
VOC emission estimates associated with applying
2010 includes specific obligations in Part III.
the control measures identified under Part III of
the Annex. Using national emission data for Source: Environment Canada
2000 and an improved methodology for emission
projections, the specific NOx and VOC emission PEMA from 1990 levels by 39 percent by 2010,
C O M M I T M E N T S
reduction obligations in the Annex are now esti and annual VOC emissions in the PEMA from
mated to reduce annual NOx emissions in the 1990 levels by 35 percent by 2010 (see Figure 10).
UNITED STATES
National Reductions With stringent controls in place for highway
sources, nonroad engines powering farm and con
In December 1999, new Tier 2 tailpipe emissions struction equipment contribute a higher fraction of
and low-sulfur fuel standards for light duty vehi the remaining inventory of pollutants. Since 1996,
cles were finalized. The emission standards are EPA has published a number of rules applying
being phased in beginning with the 2004 model standards to engines in many nonroad categories.
year, and the low-sulfur fuel standards beginning
in early 2004. These standards now apply equally The Tier 3 nonroad standards were published in
to all passenger cars and light-trucks, including October 1998, and take effect between 2006 and
sport utility vehicles (SUVs), minivans, pick-up 2008, depending upon engine size. EPA has also
trucks, and vans. They require passenger vehicles published Tier 4 standards. These stringent stan
to be 77 to 95 percent cleaner than those on the dards will achieve at least 90 percent reductions
road today and reduce the sulfur content of gaso in NOx and PM, starting in 2011, through use of
line up to 90 percent. Further information on advanced exhaust aftertreatment technologies
these standards can be found at . Further information on the standards can be
found at .
In December 2000, EPA finalized a comprehensive
program that regulates the highway heavy-duty EPA published regulations for recreational vehi
engine and its fuel as a single system. New emis cles in November 2002. The regulations cover
sion standards will take effect in 2004 and increase snowmobiles, all-terrain vehicles, and off-high-
in stringency in 2007. The program will reduce way motorcycles. Phase-in of the emission reduc
emissions of NOx and nonmethane hydrocarbons tions begins in 2006 with full emission reductions
(NMHCs) by 2.6 million and 115,000 tons per by 2010. Further information on these rules can
year by 2030, respectively (95 percent below cur be found at .
rent levels). Further information on this program
can be found at .You can also read