AGRICULTURE MONTHLY OVERVIEW AUGUST 2021
←
→
Page content transcription
If your browser does not render page correctly, please read the page content below
AGRICULTURE
MONTHLY
OVERVIEW
AUGUST 2021
Welcome to the Agriculture Monthly
Overview, your comprehensive monthly
resource to depict how weather forecast
patterns and risk data will impact the
growth, production, supply, and
transportation within the food supply
chain.

Get in Front of What’s Ahead.
For more information,
visit Everstream.ai.

2 / AUGUST 2021 /
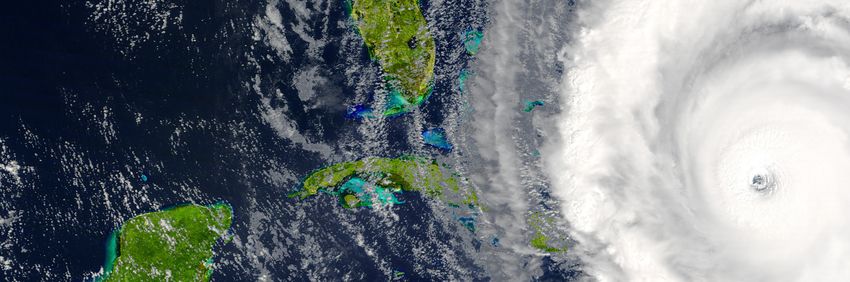
TABLE OF CONTENTS

           1. THE AGRICULTURE MONTHLY OVERVIEW (AMO)          04

           2. TOP 5 WATCH LIST                                 09

           3. THE MONTHLY DIVE                                 15

           4. THE AMO GOAL                                     18

   EDITORIAL BOARD      PROJECT LEAD     MARKETING & DESIGN
   Jon Davis            Jon Davis        Dana Sadiq
   Mark Russo           Mark Russo       Paul Olson
   Eli Turasky
   Eric Adamchick
   Logan Bundy

                                        / AGRICULTURE MONTHLY OVERVIEW / 3
THE AGRICULTURE MONTHLY
OVERVIEW (AMO)
September is a period of transition. In the Northern   While the seasons will change, one factor that will
Hemisphere, the days are getting progressively         not be changing for the foreseeable future is the
shorter, children are going back to school, and        continued elevated risk of extreme weather. As we
the heat and humidity is starting to wane. In the      highlighted in our last report, there are no signs
Southern Hemisphere, the heart of winter is done,      that the EOE (era of extremes) will end. The higher
and spring is rapidly approaching.                     the frequency of extremes, the greater the risk
In the world of agriculture, crop belts across the     of disruptions on society, businesses, and supply
Northern Hemisphere are transitioning from the         chain networks. Over the past three months, the
summer growing season to the fall harvest season       extremes have risen to a new level.
and preparing for winter. Weather conditions still     These extremes clearly stand out on the figures
tend to have a summer flavor to them but as the        below of June 1 – August 21, 2021 percent of
autumnal equinox approaches (the first official day    normal precipitation and temperature anomalies.
of autumn is September 22), the patterns typically     Long term heat and dryness across western North
become more variable.                                  America, northern and eastern Europe heat,
Meanwhile across the Southern Hemisphere,              anomalous cold in Brazil along with widespread
thoughts turn to the start of the new summer crop      below normal winter precipitation were some of
planting season as temperatures warm up and the        the large-scale and impactful extremes during the
rainy season commences in key agriculture countries    past few months.
like Brazil. Additionally, warming temperatures
spur spring growth of winter crops in countries like
Australia.

4 / AUGUST 2021 /
/ AGRICULTURE MONTHLY OVERVIEW / 5
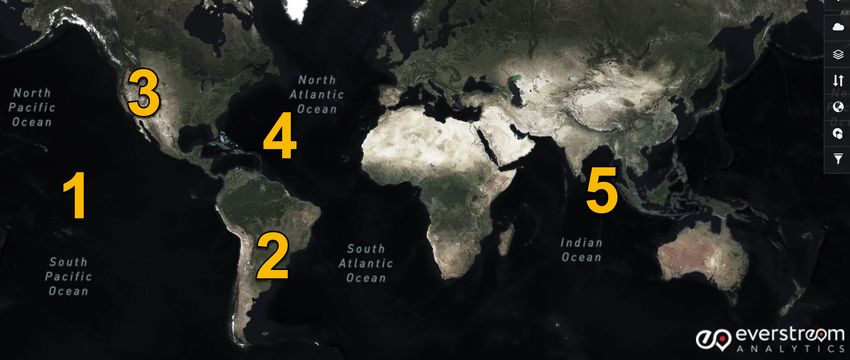
Figure 1: Percent of normal precipitation June 1 - Aug 21, 2021. Source: ERA5

Moving forward, one must be prepared for potential              concrete in those areas where the growing season
extremes as we transition from summer toward                    is ending, and eyes turn to the ”new crop” planting
winter across the Northern Hemisphere and winter                in the Southern Hemisphere.
toward summer in the Southern Hemisphere. This                  This month’s Top 5 Watch List flags the areas
will continue to produce heightened volatility in               and items that we believe are most interesting,
markets as crop production numbers become more                  important and/or at highest risk of becoming the

6 / AUGUST 2021 /
next big issue. Finally, our Monthly Dive discusses
                                              agriculture and weather, not only in the here and
this year’s North America drought in historical
                                              now but also for what’s ahead. Unlike our daily
context and provides an update on the AtlanticAgriculture Digest, this report is meant to deliver
hurricane season.                             a broad overview of important and interesting real
The purpose of the Everstream Analytics AMO time and future developments in agriculture, food,
report is to provide a high-level synopsis of and all the sectors that are linked to the global
                                              agriculture supply chain network.

         Figure 2: Temperature anomaly June 1 - Aug 21, 2021. Source: ERA5

                                                                       / AGRICULTURE MONTHLY OVERVIEW / 7
8 / AUGUST 2021 /
TOP 5 WATCH LIST
Our Top 5 Watch List includes the current global              1.       Pacific SSTs/La Niña Risk
events and crop belts that need to be monitored               2.       South American Drought
closely for potential impacts in the agriculture
                                                              3.       Western U.S. Drought
supply chain. Some examples of impacts include
crop losses via heat/freeze/drought/wetness and               4.       Tropical Activity Impacts
logistical issues due to extreme weather.                     5.       Indian Ocean Dipole

      Figure 3: Top 5 Watch List areas. Source: Everstream Analytics

                                                                          / AGRICULTURE MONTHLY OVERVIEW / 9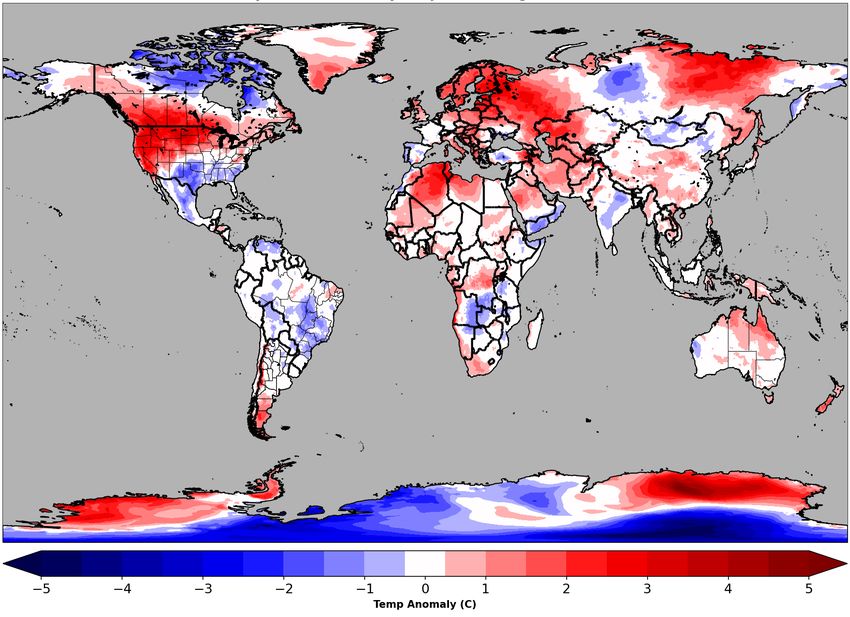
1     Pacific SSTs/La Niña Risk                        cut production for the most recent corn, coffee,
                                                       and sugar cane harvests, created poor grazing
Probabilities continue to increase for a resurgence    conditions for livestock, and severely lowered
of La Niña conditions or cooler than normal sea-       river levels to problematic levels for transportation
surface temperatures (SSTs) across the equatorial      of agriculture products. In other words, the
Pacific during the next few months. In other words,    drought has impacted both agriculture supply
2021 is shaping up for a “double dip” La Niña year     and movement (logistics) of products across South
with La Niña conditions starting the year and ending   America. The result has been, and continues to be,
the year, but neutral conditions in-between. The       a ripple effect on agriculture prices and logistical
strengthening La Niña, plus a continued negative       issues around the world. With a “double dip” La
phase of the Pacific Decadal Oscillation (PDO),        Niña over the next few months, major short-term
point toward no major improvement or contraction       drought improvement across South America is
in drought conditions across the western U.S. and      highly unlikely.
South America. In other words, these SST signals
                                                       The next window of opportunity for the start of
point to dryness risks remaining enhanced across
                                                       some dryness relief across Brazil will be the start of
the Americas as we close out 2021 and begin
                                                       the new rainy season which typically commences in
2022. Close monitoring of SST trends (magnitude
                                                       late September and early October. Based on the
and rate of change) in the equatorial Pacific is
                                                       latest signals, we are expecting a timely start to
recommended, thus making La Niña our #1 item
                                                       the rainy season across much of Brazil. This would
on our Watch List.
                                                       be welcome in starting the process of improving
                                                       drought conditions in portions of Brazil and would
2     South America Drought                            be different than last year when the rainy season
                                                       was significantly delayed. Overall, the area with the
Widescale long-term drought to various                 highest risk of continued dryness through year’s
magnitudes continues across South America. This is     end and into early 2022 (the heart of the summer
most pronounced in the key agriculture production      growing season) is concentrated in Argentina and
countries of Brazil and Argentina. The drought         southern Brazil.

10 / AUGUST 2021 /
3 Western U.S. Drought
The western U.S. drought continues to be highly impactful on a myriad of industries, not just agriculture,
due to its severity, longevity, and spatial extent. While the Southwest summer monsoon has helped
provide regional minor improvement (less severe drought) in parts of Arizona and New Mexico, the vast
majority of the West remains parched. This is especially true in the critical agriculture state of California
which recorded its hottest July on record along with other western states. Consequently, water supplies
across California remain well below normal for late summer including some record low levels. Other
ramifications for the drought include continued wildfire threats, heat stress, lowered crop production for
non-irrigated crops, and issues with available water resources. These impacts will continue throughout the
rest of summer and into the fall and will begin impacting the new winter crop season.
4 Tropical Activity Impacts
Late August and September marks the peak of the tropical season across the globe. Put another way,
this period is the window of highest risk of tropical impacts to agriculture belts, port operations, and
logistics. The impacts of tropical activity can be mixed and not all negative. For example, the rains from
a system which moved inland can provide relief to drought-plagued areas. However, the biggest impacts
– wind damage, flood damage, port damage – are certainly more on the negative side. As we move into
September, we expect several weeks of hyperactivity across the Atlantic Basin. Every storm that develops
will need to be closely watched for track and intensity in relation to specific crop belts and port locations.
In the U.S., the Port of New Orleans accounts for roughly 65% of the nation’s exports of agricultural
commodities, many of which go to China. Furthermore, it is a key node for some agriculture imports,
including coffee. Meanwhile, in the western Pacific, continued expectations of a quieter than normal
tropical cyclone season decreases the risk of tropical impacts to crop belts and ports. Nonetheless, even
one storm within a quiet season could still cause significant issues given the right track and intensity.
/ AGRICULTURE MONTHLY OVERVIEW / 1112 / AUGUST 2021 /
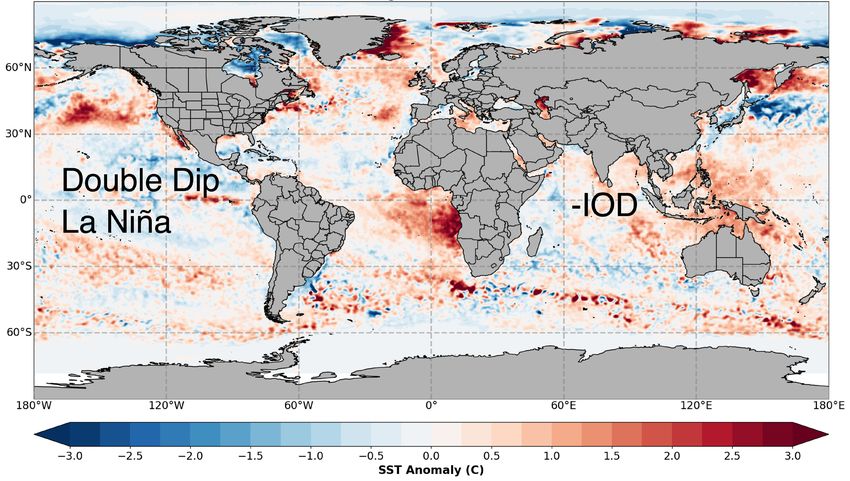
5      Indian Ocean Dipole
Rounding out our Top 5 is the Indian Ocean Dipole. The Indian Ocean Dipole (IOD) is an oscillation in
SSTs between the western and eastern Indian Ocean. The IOD is currently in and expected to remain in a
negative phase for the next few months. A negative IOD (-IOD) features warmer than normal SSTs in the
eastern Indian Ocean and cooler than normal waters in the western Indian Ocean. This SST distribution
(see Figure 4 for most current global SST anomalies) favors enhanced thunderstorm activity in the eastern
Indian Ocean and suppressed thunderstorm activity in the western Indian Ocean. As a result, a negative
IOD is a signal for more erratic monsoon activity in India toward the end of this growing season, and
above normal rainfall activity across Australia, which could impact wheat quality and harvest progress.

Figure 4: Global sea-surface temperature anomalies. Source: NOAA

                                                                   / AGRICULTURE MONTHLY OVERVIEW / 13
14 / AUGUST 2021 /
THE MONTHLY DIVE
Northern Plains /Canadian Prairies In this analysis, we defined a specific area to analyze
Drought in Historical Perspective (Fig. 5). When looking back over the last 31 years,
temperatures were the warmest they have ever
been during June 1 - August 20 across the analysis
The most severe agricultural problems on the area. In fact, there are no other years that are
planet during the past few months were in North comparable, with the next closest year being 2007
America. Specifically, the region which comprises (Fig. 6). Even when factoring in the last 11 days of
the Northern Plains and Canadian Prairies can be August, this will still be the warmest summer since
classified as a crop disaster. This did not come 1990, by far!
as a surprise to us as we have been touting the
Similarly, and unsurprisingly, the zone of crop failure
heightened risk of heat/dryness across the western
was also very dry. As we have discussed in past
and north central U.S. since spring. As a result of
reports, droughts breed heat, which would suggest
the extremely hot and dry summer, spring wheat,
that anomalously hot areas are also anomalously
canola, oats, barley, hops, and other small grain
dry. When comparing this year to the past 31
yields have taken a major hit within this area
years, it registers as the second driest, only behind
and crop production will be extremely poor. The
2017 and comparable to 2003 and 2006 (Fig. 7).
question we wanted to address is how bad was the
The combination of heat and dryness led to the
drought?
worst spring wheat crop conditions since the USDA
started keeping records in 2000.
Figure 5: Northern Plains/Canadian Prairies drought analysis zone. Source: Everstream Analytics
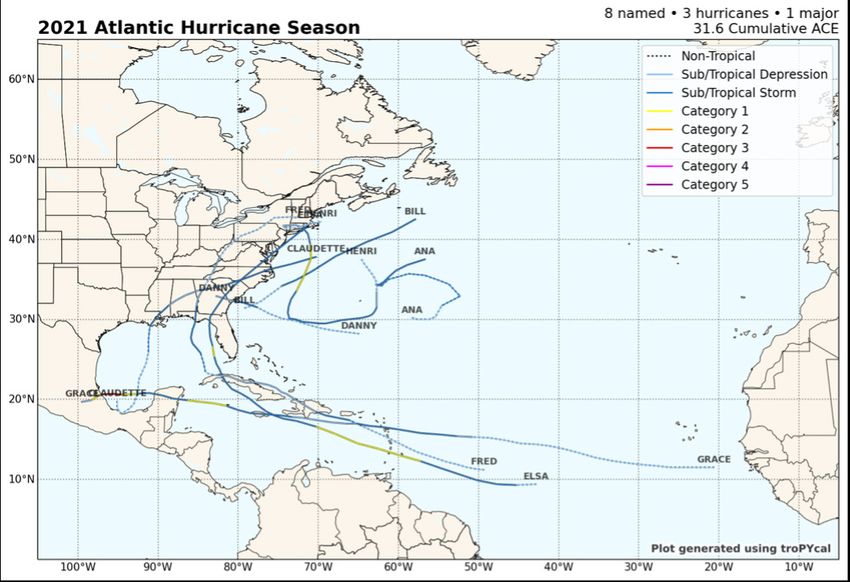
/ AGRICULTURE MONTHLY OVERVIEW / 15Figure 6: N Plains and Canadian Prairies Temperature Figure 7: N Plains and Canadian Prairies percent of normal anomalies June 1 - August 20, 1990-2021. Source: ERA5 precipitation June 1 - August 20, 1990-2021. Source: ERA5 2021 Atlantic Tropical Season Update – What to Watch for Agriculture The 2021 Atlantic tropical season has gotten off to a fast start. In week three of August, activity quickly picked up with Hurricane Grace and Hurricane Henri. With the addition of those two storms, the season has already reached eight named storms (see Fig. 8), which is well ahead of normal for this time of year. Moreover, our risk metric of ACE (accumulated cyclone energy) is running over 50% above normal for the Atlantic Basin. (Fig. 9). 16 / AUGUST 2021 /
Figure 9: 2021 Atlantic hurricane season ACE Index through
Figure 8: 2021 Atlantic hurricane season storm tracks through
                                                                August 23. Source: NOAA
August 23. Source: NOAA

As we quickly approach the halfway point of the tropical season (~September 15), we do not expect
activity to die down. In fact, we are anticipating elevated chances for numerous tropical systems, including
some very strong ones, throughout the peak of the season. Beyond the next two weeks, and for the entire
season, we continue to expect higher than normal activity and increased risk for agricultural impacts.
Typically, storm tracks into Central America and/or the Gulf Coast states tend to cause the most issues
agriculturally due to damaging wind and flooding to crops or at a port. Across the southern U.S., soybeans,
cotton, sugar cane, and citrus are the crops most vulnerable. Meanwhile in Mexico and Central America,
coffee and sugar cane are at the main crops at elevated risk should a storm track into the region.

                                                                     / AGRICULTURE MONTHLY OVERVIEW / 17
THE AMO GOAL The AMO is designed to provide an overview of important items in global agriculture. The core of agriculture (what we produce, what we do with what we produce, how we transport it, and how we and animals consume it) is always important. The current dynamics are unique (commodity price spike, recent extreme weather events and elevated risk in the future) and make the remainder of this year even more critically important to individuals and companies that have an interest in crops, food and the steps in getting food from farm to table. This report will be issued monthly and highlight items that are driving the agricultural global supply chain in this dynamic year. For more information, visit our website at www.everstream.ai. 18 / AUGUST 2021 /
/ AGRICULTURE MONTHLY OVERVIEW / 19
THINK BIGGER | SEE FURTHER | ACT SOONER
WITH PREDICTIVE SUPPLY CHAIN RISK ANALYTICS
Actionable insights to enable greater resilience and agility

About Everstream Analytics
Everstream Analytics is a supply chain risk analytics company that delivers actionable insights to
increase the resilience and agility of our clients’ supply chains, protecting revenue and reputation.
Our solution integrates with our clients’ Procurement, Logistics and Business Continuity platforms
to deliver global, end-to-end visibility to supply chain risk to enable our clients to Think Bigger.
We employ a unique combination of human expertise, artificial intelligence and proprietary data to
deliver predictive insights to enable our clients to See Further. We combine data science, proprietary
intelligence and multilingual specialists to monitor global risk and events in real-time to enable our
clients to Act Sooner. We embed risk analytics into decision making during planning and execution
across all functions and phases of our clients’ supply chains to help them Get in Front of What’s
Ahead and turn risk into a competitive advantage.

GET IN TOUCH

Website                             Email                                  Phone
www.everstream.ai                   info@everstream.ai                     +1 (800) 261 7947

Get in Front of What’s Ahead. For more information, visit Everstream.ai.
You can also read