AGRICULTURE AND NATURAL RESOURCES - ThaiJO
←
→
Page content transcription
If your browser does not render page correctly, please read the page content below
Agr. Nat. Resour. 56 (2022) 113–120

                                      AGRICULTURE AND
                                      NATURAL RESOURCES
                                                                                                                              Journal homepage: http://anres.kasetsart.org

Research article

Durian volume determination using short-range coded-light three-
dimensional scanner
Thana Cheepsomsonga,†,*, Jingtair Siriphanichb,†
a
    Department of Mechanical Engineering, Faculty of Engineering at Khamphaeng Saen, Kasetsart University Khamphaeng Saen
    Campus, Nakhon Pathom 73140, Thailand
b
    Department of Horticulture, Faculty of Agriculture at Khamphaeng Saen, Kasetsart University Khamphaeng Saen Campus,
    Nakhon Pathom 73140, Thailand

Article Info                                          Abstract
Article history:                                      Importance of the work: The quality of a durian fruit can be inferred from its specific
Received 11 November 2021
                                                      gravity, whose determination requires its volume. Traditionally, the volume of a durian is
Revised 30 December 2021
Accepted 12 January 2022                              determined by the water displacement method; However, this is a slow process that runs
Available online 25 February 2022                     the risk of fungal growth due to residual high humidity.
                                                      Objectives: The present study evaluated the viability of three-dimensional (3D) scanning
Keywords:
                                                      as an alternative approach to water displacement for the determination of the volume of
Durian,
Maturity,                                             durian fruit.
Specific gravity,                                     Materials & Methods: Durian fruit samples at different maturity levels and harvested
Three-dimensional (3D) scanning,
                                                      from two different growing areas were determined for volume using the traditional
Volume
                                                      specific gravity method and compared with volumes measured using the 3D scanning
                                                      method. Each scan took about 60 s.
                                                      Results: The analysis showed that there was no significant (p > 0.05) difference between
                                                      the traditional and proposed methods for durian fruit of different maturity levels. The
                                                      average relative percentage difference was 1.06% (sample size of 116), which was less
                                                      than that obtained from other reported studies that tested other fruits with reasonable axial
                                                      symmetry.
                                                      Main finding: The proposed alternative technique has potential for the continuous and
                                                      automatic measurement of the volumes of durian fruit on a moving conveyor belt, as a
                                                      part of the maturity determination process.

    † Equal contribution.
    * Corresponding author.
      E-mail address: thana.c@ku.ac.th (T. Cheepsomsong)

     online 2452-316X print 2468-1458/Copyright © 2021. This is an open access article under the CC BY-NC-ND license (http://creativecommons.org/licenses/by-nc-nd/4.0/),
     production and hosting by Kasetsart University of Research and Development Institute on behalf of Kasetsart University.

     https://doi.org/10.34044/j.anres.2021.56.1.11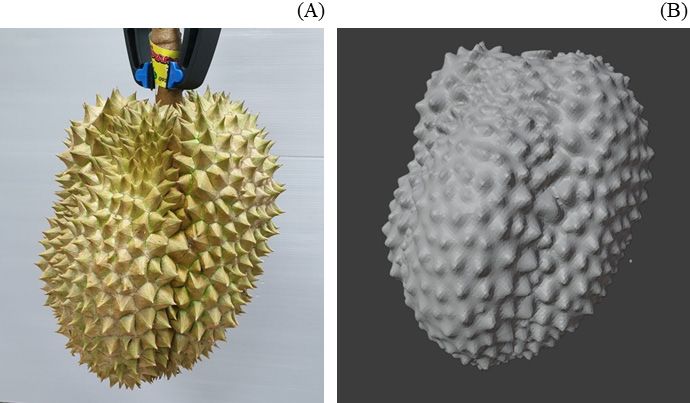
114                                       T. Cheepsomsong, J. Siriphanich / Agr. Nat. Resour. 56 (2022) 112–120

                                                                               is likely to be adequately mature; if it subjectively feels too
Introduction                                                                   heavy, the durian is too young (Siriphanich, 2011).
                                                                                   Finding the specific gravity of a fruit requires its volume,
    Durian is an important export fruit mainly from eastern                    which is usually measured by the slow and cumbersome water
and southern of Thailand, with broad consumer approval                         displacement method; having been subjected to this method,
internationally for its quality and taste (Gasik, 2017). In                    each durian must be dried to prevent fungal growth (Piasai
2019, Thailand exported 655,394 t of fresh durians, valued                     et al., 2021). Alternative approaches have been devised to
at USD 1,421million (Office of Agricultural Economics,                         measure the volumes of agricultural products. Mutschler et
2021). However, durian exporters may unintentionally export                    al. (1986) estimated the volume of a tomato by measuring
immature durians, damaging the export market. The problem                      its height and width, with a correlation coefficient (r) of
arises from failing to select adequately mature durians for                    0.99 compared with the actual volume. Yuan and Sun (1995)
harvest, which requires experience and high skill. With suitable               developed a formula to estimate the volume of an apple from
equipment, maturity sorting could be more accurate.                            its height and width to within 1.86% of the actual volume.
    Durian farmers rely on the following techniques to                             In Japan, the density of a watermelon is related to its
determine if a durian is mature: tracking the time elapsed from                mushiness and sweetness; however, calculating the density
flowering; testing if two spines are less resistant to pinching;               requires knowing the volume and this measurement
examining if the carpel lines are more dilated; and checking                   is inconvenient and time-consuming (Kato, 1997). Kato
if the sound pitch has a hollow resonation when the durian                     (1997) developed an instrument to measure the volume of a
is tapped (Bureau of Plant Industry, 2019). These techniques                   watermelon based on its electrical property. The instrument
are time-consuming and tend to tire the sorters. An alternative                has a hexagonal tunnel whose walls constitute an electrode,
option is desirable based on some maturity index that can                      with the watermelon holder in the tunnel being the other
distinguish between immature and mature durians. Currently,                    electrode. The instrument measures the capacitance between
the pulp dry matter is used as an official standard for durian,                the watermelon surface and the tunnel walls. The capacitance
but this requires destructive testing (Sangwanangkul and                       was related to the volume of the watermelon (R2 = 0.92).
Siriphanich, 2000).                                                                Another technique for measuring the volume of a fruit is
    The specific gravity of a durian is related to its quality, with           based on determining the volume of empty space around a
Haryanto and Budiastra (1999) reporting that riper Indonesian                  fruit in its container. One instrument for such a technique is a
durians had lower values of specific gravity. Another study on                 ring system that has infrared emitters and sensors around the
Monthong durians produced similar findings (Youryon et al.,                    inner side (Gall et al., 1998). Without a fruit inside the ring,
2017). In a follow-up study, Haryanto and Budiastra (2000)                     each sensor detects light from the opposite emitter. With a fruit
showed that the specific gravity of a Sunan durian was related                 inside, only some of the sensors detect light. The resulting
to its density and sweetness, with coefficients of determination               signals are converted into the area of the empty space around
(R2) of 0.89 and 0.88, respectively. The specific gravity of a                 the fruit, which when subtracted from the area inside the ring
Monthong durian is always less than one, and decreases as                      gives the area of that particular cross-section of the fruit.
the durian becomes more mature, whereas the initial specific                   Repeating this for successive cross sections allows the volume
gravity of a ripening Monthong durian is 0.95, decreasing                      to be calculated. Testing this method on potatoes produced an
to 0.90 when the durian is fully ripe (Siriphanich, 2011).                     accuracy greater than 95%, where the accuracy depended on
Yantarasri (2002) made a prototype sorting machine based                       the number of sensors and the size of the ring (Gall et al., 1998).
on durian maturity by floating the durian in a tank filled with                    Nishizu et al. (2001) developed an instrument to measure
water, the density of which was controlled and adjusted by                     the volumes of agricultural products on a running conveyor
injecting small bubbles into the water. The sorting efficiency                 belt. The instrument consisted of a Helmholtz resonator, which
was reported to be up to 100% for sorting a mature durian from                 is a spherical chamber with an open neck at the top. When
an immature durian. Specific gravity has come to be accepted as                an object is placed inside the chamber and air is blown over
one of the maturity indices for Monthong durians (Siriphanich,                 the opening, the instrument vibrates at a natural frequency
2011). In addition, durian farmers can assess Monthong durian                  depending on the volume of the object. The sound signals are
maturity by gauging its weight when lifted by the peduncle. If                 measured using a microphone and analyzed for the natural
the fruit feels too light based on its apparent volume, the durian             frequency, from which the volume of an agricultural product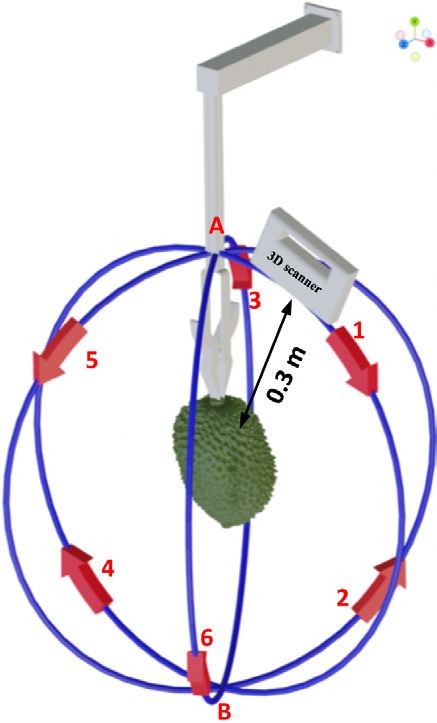
T. Cheepsomsong, J. Siriphanich / Agr. Nat. Resour. 56 (2022) 112–120                                    115

placed inside the chamber can be calculated. They found that                 with a computer software package 3D Systems Sense™
the natural frequency was related to the volume (R2 = 0.97).                 Version 3.0.213 (Rock Hill, SC, USA). The 3D scanner was
    Another technique for measuring the volume of a non-                     connected to a computer via a USB 3.0 port. The computer was
spherical fruit, such as a cantaloupe, combined image processing             equipped with an Intel i7-8770K processor with 8 GB of RAM
with the disk approximation method (Rashidi et al., 2009).                   and an Nvidia Quadro 2000 video card. To prepare for the scan,
There was no significant difference (at the 95% confidence                   a durian was hung vertically, as shown in Fig. 2. The scan was
level) between the technique and the water displacement                      carried out by manually moving the scanner along six paths
method. Costa et al. (2016) took a photograph of a palm                      around the stationary durian. As shown in Fig. 3, scanning a
fruit and used the Moire technique to determine its volume.                  durian started at point A and proceeded along path 1 toward
Compared to the water displacement method, the r value                       point B, then along path 2 back to point A. The procedure was
was 0.65. Concha-Meyer et al. (2018) used a machine vision                   repeated along paths 3–6. Each scan took about 60–90 s per
technique to determine the volumes of tomatoes, mushrooms                    durian, depending on the durian shape.
and strawberries from their photographs. Compared to the                         The 3D image file had an STL (Standard Triangle Language,
water displacement method, the values of R2 ranged from 0.92                 invented by Grimm, 2004) extension. Fig. 4 shows a 3D image
for mushrooms to 0.99 for tomatoes. Villordon et al. (2020)                  from the file compared to the fruit photo. The volume was
used a three-dimensional (3D) scanner to determine the volume                calculated based on the STL file, as described in the next part.
of sweet potato. The 3D scanned volume was highly correlated
(R2 = 0.81) with the volume based on water displacement.
    A three-dimensional (3D) scanner provides a non-
destructive means for volume measurement. However, the
technique has only been applied to agricultural produce with a
smooth surface. The present study investigated the application
of a 3D scanning technique in conjunction with computer
software to determine the volume of a durian whose shape is
complex and spiky.

Materials and Methods

Durian samples                                                               Fig. 1 Sense-RS, short-range coded-light three-dimensional scanner

   Fruit samples of 42 and 78 Monthong durians from Rayong
province (12°53'27.6"N 101°37'08.4"E) harvested in September
2021 and Yala province (6°15'25.2"N 101°24'25.2"E) harvested
in October 2021, respectively, were obtained from packing
houses and manually sorted by tapping sound into four
groups of approximately the same maturity: immature, almost
mature, mature and overly mature. The sorting was carried out
manually by commercial sorters. The weights of each durian
were in the range 2.185–5.655 kg for the Rayong durians and
1.610–6.385 kg for the Yala durians.

Method

   Building a 3D model of a durian from its 3D scan
   A short-range coded-light 3D scanner, Sense-RS (Rock
Hill, SC, USA), as shown in Fig. 1, was used in conjunction                  Fig. 2 Durian hanging in position for three-dimensional scanning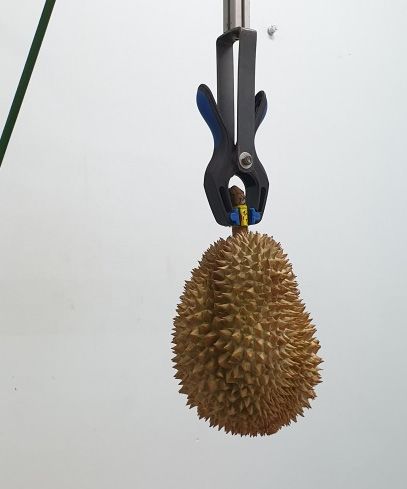
116 T. Cheepsomsong, J. Siriphanich / Agr. Nat. Resour. 56 (2022) 112–120
the STL volume using Equation 1:
Scanned volume=Correction factor × STL volume (1)
When a test cylinder was scanned using the equipment in
the present study, its actual volume was smaller than the STL
volume by a factor of 0.92; therefore, this was used as the
correction factor in Equation 1.
Durian volume measurement using water displacement
method
The volume of a durian obtained from the water displacement
method is hereinafter referred to as its reference volume. The
Fig. 3 Diagram showing scanning process: A→1→B→2→A→3→ water displacement method is a basic method for volume
B→4→A→5→B→6→A determination (Mohsenin, 1986). The temperature of water
used in each measurement was 25 ± 1°C. The measurement of
the reference volume of a durian commenced by weighing the
container filled with water (measured in kilograms). Next, the
durian was immersed in the water so that only the peduncle was
not submerged. The new weight was recorded.
The reference volume (measured in liters) was defined as
the volume of the water displaced by the durian, calculated
using Equation 2, with the weight of the water displaced by a
durian (measured in kilograms) calculated using Equation 3.
Reference volume = Weight of water displaced
by durian / Water density (2)
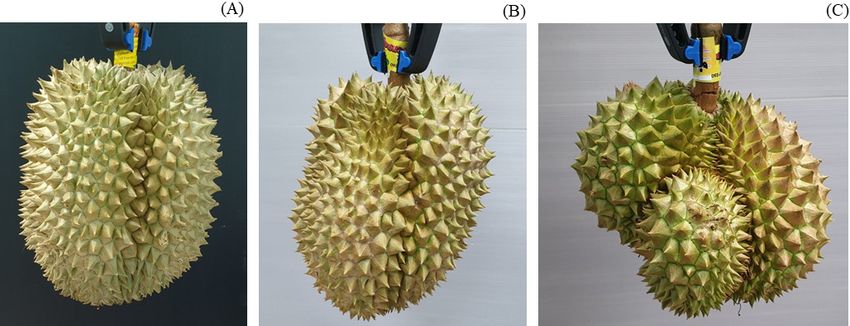
Fig. 4 (A) Actual photo of durian sample; (B) Corresponding three-
dimensional model constructed using 3D scanner where the density of water was assumed to be 0.997 kg/L
at standard temperature and pressure (25°C and 101.325 kPa).
Durian volume calculation from STL file For example, if the displaced water weighed 997 g, then its
Calculating the volume of a durian from its STL file volume would be 1 L.
(hereinafter referred to as the STL volume) used the Python 3.8
software (Python Software Foundation; https://www.python. Weight of water displaced by durian =
org) and a library called numpy-stl containing the function get_ Weight of system with durian immersed -
mass_properties that was used in the calculation, based on a Weight of system without durian (3)
technique making use of polyhedral mass properties developed
by Eberly (2002) for the determination of the volume of a solid Statistical analysis
3D object.
Scanned volumes and reference volumes were subjected to
STL volume correction regression analysis to determine the coefficient of determination
The STL volume required correction using a factor that (R 2) for the derived model. The accuracy of the scanned
was determined based on the STL volume of a simple cylinder volumes was based on the standard error of estimate (SEE),
whose actual volume was easily determined. The correction given by Equation 4 (Smith, 2015):
factor was defined as the ratio between the actual volume and
the STL volume. The corrected volume (hereinafter referred to (4)
as the scanned volume) of any object could then be related to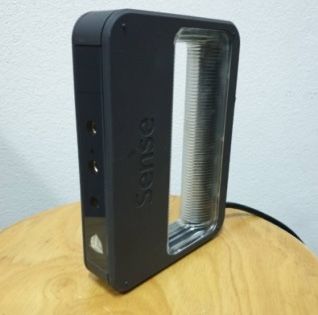
T. Cheepsomsong, J. Siriphanich / Agr. Nat. Resour. 56 (2022) 112–120                               117

    where Sy,x is the standard error of the estimate, y is the                     greatest differences between the 3D scanned and reference
reference volume, yest is the scanned volume and n is the sample                   volumes were all irregularly shaped with some of their lobes
size. Differences between the scanned and reference volumes                        oddly twisted, as shown in Fig. 5C, making them unfit for
of the durian samples were considered significant at the 95%                       export. The poor results were generally because irregular
confidence interval level based on a paired sample t test, using                   surface furrows were obscured by crowded spikes (as shown in
Microsoft Excel (Microsoft Corporation; Redmond, WA,                               Fig. 5C). However, this did not affect the utility of the present
USA). Values were presented as the mean ± SD.                                      method in practice, because durian volumes are determined
                                                                                   only for durians with a regular shape that can be exported.
                                                                                   Once the misshapen durians had been discarded from the
Results and Discussion                                                             analysis, there was still no significant difference between the
                                                                                   scanned and reference volumes (p = 0.292).
    Volume                                                                             All 78 Yala durians were regularly shaped and suitable for
                                                                                   export. Their t test analysis revealed there was no significant
    The volumes of the durian samples in the present study are                     difference between the reference and scanned volumes (p =
shown in Table 1. The mean reference volumes were 4.069 ±                          0.653, Table 2). The volume difference was even lower than
0.915 L and 3.531 ± 1.128 L, for the Rayong and Yala durians,                      for the Rayong durians based on the higher p value for the Yala
respectively. The mean scanned volumes were 4.087 ± 0.910                          sample, probably due to the greater number of regular-shaped
L and 3.452 ± 1.060 L for the Rayong and Yala durians,                             samples.
respectively. Thus, the durian samples from Yala had a broader                         All samples from the two provinces were combined and re-
volume range than those from Rayong because of their wider                         analyzed using the t test. The scanned volume of the combined
range in mass, not shape, as the durians from both regions were                    durians from both provinces was not significantly different
the same cultivar.                                                                 from the reference volume (p = 0.738, Table 2).
                                                                                       For the regular-shaped durians, the present study recorded
Results from statistical analyses                                                  better volume measurement agreement than was reported for
                                                                                   the image analysis by Rashidi et al. (2009), whose cantaloupe
    Analysis using t test                                                          volume determination had a p-value of 0.207 in the paired
    For the 42 Rayong durians, the statistical analysis based                      sample t test. They determined the volume of an axially
on the paired t test between the scanned volume and reference                      symmetric cantaloupe based on a combination of 2D image
volume was not significant (p = 0.117), as shown in Table 2.
Further inspection of the samples revealed that four durians had
unusually high discrepancies between the reference volume
and scanned volume, probably because they were misshapen,
whereas the others were more regularly shaped. Regular-
shaped durians can be evaluated for symmetry once pollination
and fertilization are complete (Siriphanich, 2011), with a
symmetrical fruit having even carpels all around, as shown
in Fig. 5A. If there is incomplete pollination and fertilization,
some carpels are smaller and the durians are considered to be                      Fig. 5 (A) Regular-shaped, symmetrical durian; (B) Regular-shaped but
asymmetrical, as shown in Fig. 5B. The four durians, with the                      asymmetrical durian; (C) Misshapen durian unfit for export

Table 1 Descriptive statistics of durian volumes (in liters) for 38 durians from Rayong and 78 durians for Yala
 Province                Volume category                Minimum                          Mean                          Maximum            SD
 Rayong                 Reference volume                   2.445                         4.069                          6.515            0.915
 Rayong                  Scanned volume                    2.444                         4.087                          6.560            0.910
 Yala                   Reference volume                   1.585                         3.531                          6.270            1.128
 Yala                    Scanned volume                    1.637                         3.452                          5.973            1.060
118                                          T. Cheepsomsong, J. Siriphanich / Agr. Nat. Resour. 56 (2022) 112–120

analysis and longitudinal dissections. In the present study, the                  on photography in conjunction with the so-called Moire
average relative percentage difference between the reference                      technique. That approach produced an R2 value of 0.837 and an
and scanned volumes based on the combined samples using                           average relative percentage difference of 11.09%, with respect
only the regular-shaped fruit from the two provinces was                          to the volume obtained using the water displacement method.
1.06%, whereas that in the cantaloupe study was 7.60%                             Concha-Meyer et al. (2018) determined the volumes of
(Rashidi et al., 2009).                                                           tomatoes using a technique similar to that of the present study.
                                                                                  They took photographs of multiple sides of each tomato while
    Regression analysis                                                           it was rotated 6° at a time, resulting in 30 photos per tomato.
    Table 3 shows the results of the regression analysis                          These data were analyzed and converted to volumes using
comparing the durians from the two provinces. The equation                        the OmniSurface software (Smart Vision Works International
resulting from the regression analysis is shown in Equation 4:                    LLC; American Fork, UT, USA). The technique produced an
                                                                                  average relative percentage difference of 2.18%, which was
    Reference volume = (a + b) × Scanned volume                          (4)      less accurate than that of the present study (1.06%). However,
                                                                                  the discrepancy was understandable for three reasons. First,
    where a is the intercept value and b is the regression                        their scanner and 3D reconstruction software were different.
coefficient.
    For the Rayong durians, the equation had an R2 value 0.948
(Table 3) for all 42 durians and an R2 value of 0.987 when the
misshapen durians were excluded. For the Yala durians, the R2
value was 0.996, which was consistent with the results from
the t test analysis. For the combined regular-shaped samples
from the two provinces, the regression analysis had an R2 value
of 0.991. The SEE of the combined analysis was 0.106, which
was better than for the Rayong analysis. The relationship as
revealed by regression analysis between the reference volume
and the scanned volume based on the combined samples is
shown in Fig. 6.
    The R2 value (0.991) of the spiky-surfaced durian in the
present study was higher than for smooth-surfaced sweet potato
(R2 = 0.81) that was also based on 3D scanning (Villordon                         Fig. 6 Regression of three-dimensional (3D) scan volumes on volumes
et al., 2020). Costa et al. (2016) determined the volumes                         from water displacement method based on combined samples from two
of palm fruits, whose shapes are fairly symmetrical, based                        provinces

Table 2 Results from paired t test between the scanned and reference volumes of durian fruit
 Province                                            Sample                                      Quantity                                   p-value
 Rayong                                                Full                                         42                                       0.117
 Rayong                                  Excluding misshapen durians                                38                                       0.292
 Yala                                                  Full                                         78                                       0.653
 Rayong and Yala                         Only regular-shaped samples                                116                                      0.738

Table 3 Results from regression analysis to predict durian volume based on scanned volume
 Province                              Sample                        Coefficient of determination                    Standard error of estimate       p-value
 Rayong                              All samples                                   0.948                                       0.222                  7×10-28
 Rayong                     Excluding misshapen durians                            0.987                                       0.107                  2×10-35
 Yala                                All samples                                   0.996                                       0.072                  7×10-92
 Rayong and Yala             Only regular-shaped samples                           0.991                                       0.106                  1×10-117
T. Cheepsomsong, J. Siriphanich / Agr. Nat. Resour. 56 (2022) 112–120 119
Second, the distance between the scanner and object in their
setup was different (0.3 m in the present study versus 1 m for Conflict of Interest
theirs). Third, durians are much bigger than sweet potatoes, and
therefore give better resolution. The authors declare that there are no conflicts of interest.
The present study showed that although a durian was
asymmetrically shaped with a non-smooth surface, its scanned
volume was close to its reference value. The estimated volume Acknowledgements
based on the 3D scan was better than achieved in other studies
of agricultural materials whose shapes were reasonably A s s o c . P r o f . D r A n u p a n Te r d w o n g w o r a k u l o f
symmetrical and smooth. The technique in the present study the Department of Agricultural Engineering, Faculty of
could be adapted for use with a LiDAR 3D scanner, whose Engineering, Kamphaeng Saen Campus provided helpful
speed and resolution are higher than the system used in suggestions and advice on planning the experiment, without
the present study, in conjunction with custom software for which the experiments would not have proceeded as smoothly.
volume determination. In addition, the technique could be The Agricultural Research Development Agency (Public
further developed for the continuous measurement on a Organization) provided the durian fruit for research purposes.
moving conveyor belt. Furthermore, the technique could be The Kasetsart University Research and Development Institute
incorporated as part of more complicated processes. For (KURDI), Bangkok, Thailand provided assistance with English
example, combining it with a system that can measure the editing.
weight would then allow the specific gravity to be determined.
In addition, the system could also use multiple scanners from
different angles simultaneously. Finally, the system could References
be set up to scan durian fruit on a moving conveyor belt for
automatic measurement and maturity sorting. Bureau of Plant Industry. 2019. Maturity indicators of durian. Davao
City, the Philippines. http://bpi.da.gov.ph/bpi/images/Production_
guide/2020/Maturity%20Indicators%20for%20Durian_updated%20
2019.pdf, 27 August 2021.
Conclusion Concha-Meyer, A., Eifert, J., Wang, H., Sanglay, G. 2018. Volume
estimation of strawberries, mushrooms, and tomatoes with a machine
A 3D scanning technique was used to determine the vision system. Int. J. Food Prop. 21: 1867–1874. doi.org/10.1080/109
volumes of durians fruit having an asymmetrical shape and 42912.2018.1508156
Costa, A.G., Ribeiro, E., Braga, R.A., Pinto, F.A. 2016. Measurement
covered with prominent spikes, with different maturity levels
of volume of macaw palm fruit using traditional and the digital
and harvested from two different growing areas. The volumes Moiré techniques. Rev. Bras. Eng. Agric. Ambient. 20: 152–157. doi.
obtained were compared using a paired sample t test with org/10.1590/1807-1929/agriambi.v20n2p152-157
reference volumes based on the water displacement method. Eberly, D. 2002. Polyhedral mass properties (Revisited). CA, USA. https://
There was no significant difference between the methods www.geometrictools.com/Documentation/PolyhedralMassProperties.
(p = 0.738). The average relative percentage difference was pdf, 15 June 2021.
Gall, H., Muir, A., Fleming, J., Pohlmann, R, Gocke, L., Hossack, W.
1.06% when the samples of regular-shaped durian fruit from
1998. A ring sensor system for the determination of volume and axis
the two growing areas were combined. The results proved this measurements of irregular objects. Meas. Sci. Technol. 9: 1809–1820.
technique could be applied to durian fruit from two different doi.org/10.1088/0957-0233/9/11/004
growing areas and with different sizes. However, the 3D Gasik, L. 2017. Trends in Asian and western durian consumer behavior,
scanning technique was less accurate for misshapen durian attitudes, and motivations. Acta Hortic. 1186: 215–222. doi.
fruit that were unfit for export. On the other hand, for well- org/10.17660/ActaHortic.2017.1186.34
Grimm, T. 2004. User’s Guide to Rapid Prototyping. Society of
formed agricultural materials, the technique was more accurate
Manufacturing Engineers. Dearborn, MI, USA.
than reported in similar studies. The technique has potential Haryanto, B., Budiastra, I.W. 1999. Ripeness analysis of Ciapus durian
for use in the continuous and automatic measurement of the by specific gravity method. Buletin Keteknikan Pertanian (Indonesia)
volumes of durian fruit on a moving conveyor belt. 13: 19–26.
Haryanto, B., Budiastra, I.W. 2000. Study of relationship between ripeness
and specific gravity of durian (Durio zibhetinus, Murr.) Agritech 20:
179–182. [in Indonesian]120 T. Cheepsomsong, J. Siriphanich / Agr. Nat. Resour. 56 (2022) 112–120 Kato, K. 1997. Electrical density sorting and estimation of soluble Sangwanangkul, P., Siriphanich, J. 2000. Growth and maturation of durian solids content of watermelon. J. Agric. Eng. Res. 67: 161–170. doi. fruit cv. Monthong. Thai J. Agric. Sci. 33: 75–82. org/10.1006/jaer.1997.0160 Siriphanich, J. 2011. Durian (Durio zibethinus Merr.). In: Yahia, E.M. Mohsenin, N.N. 1986. Physical Properties of Plant and Animal Materials. (Ed.). Postharvest Biology and Technology of Tropical and Subtropical Taylor and Francis. New York, NY, USA. Fruits, Vol 3: Cocona to Mango. Woodhead Publishing. Cambridge, Mutschler, M.A., Yasamura, L., Sethna, J. 1986. Estimation of Tomato UK, pp. 80–114. Fruit Volume from Fruit Measurements. Report of the Tomato Genetics Smith, G. 2015. Essential Statistics, Regression, and Econometrics. Cooperative, 36. University of Florida. Gainesville, FL, USA. Academic Press. Cambridge, MA, USA. Nishizu, T., Ikeda, Y., Torikata, Y., Manmoto, S., Umehara, T., Mizukami, Villordon, A., Gregorie, J. C., LaBonte, D. 2020. Direct measurement T. 2001. Automatic, continuous food volume measurement with a of sweetpotato surface area and volume using a low-cost 3D scanner Helmholtz resonator. Agric. Eng. Int. 3: 1–10. for identification of shape features related to processing product Office of Agricultural Economics. 2021. Export Statistics of Fresh Durians in recovery. HortScience 55: 722–728. doi.org/10.21273/HORTSCI 2019. http://impexp.oae.go.th/service/export.php?S_YEAR=2562&E_ 14964-20 YEAR=2562&PRODUCT_GROUP=5252&PRODUCT_ Yantarasri, T. 2002. Durian sorting machine based on specific gravity. In: ID=4977&wf_search=&WF_SEARCH=Y, 30 December 2021. Research Report on Research Program for Development of Production [in Thai] and Marketing of Durian for Export. Research Council of Thailand. Piasai, R., Chalmers, P., Piasai, O., Khewkhom, N. 2021. Postharvest Bangkok, Thailand, pp. 91–120. fungicide dips to control fruit rot of ‘Monthong’ durian (Durio Youryon, P., Rattanaphon, J., Supapvanich, S., Krairiksh, M. 2017. zibethinus). Eur. J. Plant Pathol. 160: 325–336. doi.org/10.1007/ Physicochemical factors related to 'Monthong' durian fruit maturity. s10658-021-02246-3 In: Proceedings of IV Asia Symposium on Quality Management in Rashidi, M., Gholami, M., Abbassi, S. 2009. Cantaloupe volume Postharvest Systems. Jeonju, Korea, pp. 165–170. determination through image processing. J. Agr. Sci. Tech. 11: Yuan, K.J., Sun, R.H. 1995. A new method for measuring and calculating 623–631. volumes of apple fruit. Acta Hortic. Sin. 22: 386–388.
You can also read