Accuracy of self-reported gambling frequency and outcomes: Comparisons with account data
←
→
Page content transcription
If your browser does not render page correctly, please read the page content below
PRE-PRINT: ACCURACY OF SELF-REPORTED GAMBLING                                             1

 Accuracy of self-reported gambling frequency and outcomes:
               Comparisons with account data

         Robert M. Heirene1 , Amy Wang1 , & Sally M. Gainsbury1
  1   University of Sydney, Science Faculty, Brain & Mind Centre, School of Psychology,
                                          Australia
Abstract
Objectives: The ability to accurately recall past gambling behavior and out-
comes is essential for making informed decisions about future gambling. We
aimed to determine whether online gambling customers can accurately recall
their recent gambling outcomes and betting frequency. Methods: An online
survey was distributed to 40,000 customers of an Australian sports and race
wagering website which asked participants to recall their past 30-day net outcome
(i.e., total amount won or lost) and number of bets. We compared responses
to these questions with participants’ actual outcomes as provided by the online
site. Results: Among the 514 participants who reported their net outcome,
only 21 (4.09%) were accurate within a 10% margin of their actual outcome.
Participants were most likely to underestimate their losses (N = 333, 64.79%).
Lower actual net losses were associated with greater under- and over-estimation
of losses. Of the 652 participants who reported their gambling frequency, 48
(7.36%) were accurate within a 10% margin of their actual frequency. Most
participants underestimated their number of bets (N = 454, 69.63%). Higher
actual betting frequencies were associated with underestimating betting and
lower actual frequencies with overestimating betting. Conclusions: The poor
recall accuracy we observed suggests public health approaches to gambling harm
minimization that assume people make informed decisions about their future bets
based on past outcomes and available funds should be reconsidered. Findings
also question the reliability of research outcomes predicated on self-reported gam-
bling behavior. Research is needed to determine the best methods of increasing
people’s awareness of their actual expenditure and outcomes.
All materials associated with this study can be accessed via this project’s Open Science Framework
page, including the suvey used to collect data, the dataset, and analysis scripts: https://osf.io/8vjeh/. This
manuscript first appeared as a pre-print on PsyArXiv on 19/07/2021: https://psyarxiv.com/5hs7j/.
The authors made the following contributions. Robert M. Heirene: Conceptualization, Project adminis-
tration, Supervision, Methodology, Data curation, Formal analysis, Visualization, Writing - Original Draft,
Writing - Review apajap& Editing; Amy Wang: Conceptualization, Project administration, Methodology,
Data curation, Writing - Review & Editing; Sally M. Gainsbury: Conceptualization, Writing - Review &
Editing, Supervision.
Correspondence concerning this article should be addressed to Robert M. Heirene, Gambling Treatment
& Research Clinic, Brain & Mind Centre, University of Sydney, 94 Mallett St, Camperdown, Sydney, NSW,
Australia, 2050. E-mail: robert.heirene@sydney.edu.au; robheirene@gmail.comPRE-PRINT: ACCURACY OF SELF-REPORTED GAMBLING 2
Introduction
The ability to accurately recall past gambling behavior and outcomes is important
for several reasons. Foremost, an accurate understanding of one’s gambling outcomes is
crucial for making decisions about how much or whether to continue gambling in the future
(Clark, 2010). Only by keeping track of wins and losses can one prevent overspending
and ensure they are appropriately allocating funds to the different aspects of their life
(bills, daily expenses, savings etc.). Indeed, the ‘responsible gambling’ approach to reducing
gambling harm, often espoused by government and industry, places emphasis on individual
responsibility, informed decision-making, and self-monitoring (Miller et al., 2016; Miller
& Thomas, 2018). The foundation of informed decision making is understanding whether
one is winning or losing and by how much, and people’s understanding of this and their
ability to self-monitor outcomes is implicitly assumed when discussing the role of personal
responsibility in the development of gambling problems (Shaffer & Ladouceur, 2021).
Gambling researchers frequently rely on people’s ability to recall their past gambling
in self-report studies. For example, Currie et al. (2017) used self-reported past-month
gambling expenditure to determine a specific ‘low-risk’ threshold for monthly spending
on gambling, concluding that individuals who gamble above this level are more likely to
experience harms (see also Currie et al., 2021). Notably, jurisdictional prevalence studies
typically rely on self-report to determine the prevalence of gambling and related harms (e.g.,
Tajin et al., 2021; UK Gambling Commission, 2020), and these outcomes are used as the
basis of determining policies and practices. The focus of the present study is the extent
to which people can accurately recall their past gambling outcomes and behavior and the
implications of this for reducing gambling harms and studying gambling-related phenomena.
The few existing studies on this topic have found that many people are unable to
accurately recall their recent gambling outcomes (Auer & Griffiths, 2017), and the extent
of the discrepancy between self-reported and actual outcomes is positively associated with
problem gambling (Braverman et al., 2014 ). Braverman et al. (2014) asked 773 European
subscribers to bwin.party’s online gambling service to report how much money they had won
or lost in the last three or 12 months and compared their responses with their actual “net
outcome” (i.e., the overall amount won or lost in that period) as provided by the gambling site.
Most participants (51% at three-month recall and 56% at 12-month recall) were favourably
biased in their recall. That is, they were losing gamblers who underestimated their losses or,
less commonly, winning gamblers who overestimated their winnings. Conversely, around
one third of participants (36% at three months and 37% at 12 months) were unfavourably
biased—losing gamblers who overestimated their losses or, less commonly, winning gamblers
who underestimated their winnings. The authors developed a standardized measure of
inaccuracy (or “bias,” as they termed it) calculated as: (self-reported outcome - actual net
outcome)/ average size. “Accurate recall” was defined as a bias score within the -1 to +1
range, which is equivalent to the self-reported outcome being within one average bet size
of the actual outcome. Only 13% and 7% of participants accurately recalled their past
three-month and 12-month outcomes, respectively.
Auer and Griffiths (2017) performed a similar study in 2015 with 1,335 Norwegian
subscribers to the state-owned online gambling site Norsk Tipping, asking participants toPRE-PRINT: ACCURACY OF SELF-REPORTED GAMBLING 3
recall their outcome for the past month. Like Braverman et al. (2014), they found people
were more likely to be favourably biased (17%; underestimating losses or overestimating
winnings) than unfavourably biased (9%; overestimating losses or underestimating winnings).
However, unlike Braverman et al. (2014), considerably more participants were classified
as accurately recalling their net outcome (74%) using the same standardized measure of
inaccuracy, which the authors attributed to the shorter period of recall (one month as
opposed to three or 12 months).
Two theories have been proposed in an attempt to explain poor recall accuracy
when reporting gambling outcomes. Braverman et al. (2014) suggested increased arousal
during gambling could be responsible, adducing evidence that arousal—particularly negative
arousal—can selectively bias people’s attention and their subsequent recall towards highly
salient events (Sutherland & Mather, 2012; see also Mather et al., 2016). Such events in the
gambling context could include large wins or losses, which can focus one’s memory on these
outcomes (Wood & Williams, 2007). Braverman et al. (2014) also implicated mood and
substance disorders—which frequently co-occur with problem gambling (Bischof et al., 2013;
Håkansson et al., 2018)—as these are thought to disrupt cognitive processes like memory
and attention (Bruijnen et al., 2019; Porter et al., 2015).
One explanation for recall inaccuracy not discussed in previous studies is the complexity
associated with calculating one’s net outcome. People may place many bets within a one or
three-month period and thus accurately summing these outcomes may prove challenging. A
recent analysis of nearly 40,000 online gambling customers account data in Australia found
that the median number of bets placed in a year was 41, and 25% of the sample placed 184
bets or more (Heirene et al., 2021). Further, there may be different ways in which people
calculate their net outcome. Some may include their stake in winnings, whereas others may
not. For example, a person who places $50 worth of bets in one month and wins $100 may
report their net outcome as $50 (without stake) or $100. Others may only include the money
deposited into their account and not losing bets in their calculations. Someone who deposits
$10 into their account, wins $50 but subsequently loses all of this might report their net
outcome as -$10 or -$50.
Providing guidance on how to calculate net outcome when asking people to report their
outcomes could improve recall accuracy, though neither Braverman et al. (2014) nor Auer
and Griffiths (2017) did this. Braverman et al. (2014) only asked: “How much money did
you win or lose during the last three(12) months on each type of gambling activity at bwin?
(Record your net losses or winnings—how much you are behind or ahead),” and Auer and
Griffiths (2017) did not provide the exact question asked but stated: “one survey item asked
gamblers to estimate their overall loss or win during a 1-month period immediately prior to
the survey.” Providing guidance on standard drink sizes has been shown to alter people’s
self-reported alcohol consumption (Gilligan et al., 2019), suggesting a similar effect could be
observed in the gambling context. Question wording may also affect self-reported outcomes.
Wood and Williams (2007) asked people about their past-month net outcome using 12
different questions and found minor variations in the phrasing resulted in significantly
different reported outcomes.
If recall accuracy is partially mediated by the complexity and variability involved inPRE-PRINT: ACCURACY OF SELF-REPORTED GAMBLING 4
calculating net outcome, then people’s ability to recall more simple aspects of their gambling
behavior, like the number of times they have gambled, should be more accurate. However,
no studies have investigated gambling recall accuracy beyond net outcome. This remains
an important and yet unexplored area of study as gambling studies frequently ask people
not only to report their outcomes, but also the frequency or regularity of their gambling
(e.g., Gainsbury et al., 2014; Raisamo et al., 2013; UK Gambling Commission, 2020). The
aim of the present study was to extend previous work in this area (Auer & Griffiths, 2017;
Braverman et al., 2014; Wood & Williams, 2007) in two ways. First, by asking online
gambling customers to self-report their past one-month net outcome and providing them
with some guidance on how to calculate their outcomes. With this added guidance, observing
improved recall accuracy by comparison to previous studies may imply that poor recall
of gambling outcomes can be ameliorated via improving people’s understanding of how to
calculate their outcomes. This could have important implications for developing strategies
that aim to increase consumers’ informed decision-making. Second, we extended previous
research by asking participants to also report their past one-month gambling frequency. If
recall rates for betting frequency are also poor, then greater caution is warranted when
interpreting the findings of studies where the outcomes are predicated on self-reports as
recall issues extent beyond net outcome reporting. Better understanding the prevalence and
extent of biases when recalling both outcomes (e.g., underestimating losses) and frequency
(e.g., underestimating bets) will assist with determining the extent to which these may be
distorting informed decision making.
We did not preregister any a priori hypotheses, although we anticipated that net
outcome recall accuracy would be more accurate here than in previous studies due to the
instruction provided. We also anticipated that participants would be more accurate when
recalling their betting frequency compared to net outcome due to the complexity associated
with calculating the latter.
Methods
Transparency and Openness
All relevant materials associated with the study can be found on our Open Science
Framework project page (https://osf.io/8vjeh/), including the full survey completed by
participants, the raw data, the analysis script used to produce the results reported here,
and an analysis document outlining the full process of processing and analysing the data
that includes all outcomes produced from this process. This manuscript—including all
outcomes, tables, and figures reported—was produced computationally in R Markdown and
can therefore be independently reproduced (see guidance on reproduction in Analysis &
code subsection). In the following methods sections we follow the Journal Article Reporting
Standards (JARS)(Appelbaum et al., 2018) and report how we determined our sample size,
all data exclusions, and all measures used in the study. This study’s design and its analysis
were not pre-registered.PRE-PRINT: ACCURACY OF SELF-REPORTED GAMBLING 5
Design & Procedures
We worked with a large online wagering operator based in Australia to collect survey
responses and match these with actual betting data. The operator sent an email containing
a link to our survey to a random selection of 40,000 customers in October 2020. Customers
were told that participation in the survey was voluntarily and that they would not be
reimbursed for completion. Email invitations framed the study to focus on responsible
gambling as opposed to self-report accuracy which may have impacted participation rates.
The online survey was hosted by the operator on the Qualtrics platform and remained open
for one week after the initial email was sent to customers. The survey asked participants
about their gambling frequency and outcome over the last 30 days:
1. Approximately how many bets did you place with [operator] in the last 30 days?
2. Approximately what was your net outcome with [operator] of the last 30 days (i.e.,
the amount you won or lost)? Calculating your net outcome—here’s two examples:
ONE: You had three bets in the last 30 days. $10 on a horse at odds of $3.00 which
won, and two $20 bets on AFL games that lost. In total you collected $30 after placing
$50 worth of bets, so your net result is -$20 ($30 minus $50). You lost $20.
TWO: You had five bets in the last 30 days, all of them $50 on $2 favourites. Three of
the favourites won. So, in total you received $300 after placing a total of $250 in bets.
Your net result is $50 ($300 minus $250). You won $50.1
We compared participants’ responses to these questions with their actual betting
frequency and net outcome using their account data. Participants were unaware that we
were planning to make these comparisons. The survey also contained questions relating to
people’s preferences for different responsible gambling messages presented to them. The
outcomes from this component are not yet available and plan to be reported separately. The
gambling operator provided us with the following variables for each participant alongside
their survey responses: unique customer id, age, gender, and (for the 30 days preceding their
date of completion) number of active betting days, betting frequency (i.e., total number of
bets placed), number bets per active day, net outcome, and proportion of bets that were
placed on sports and proportion placed on races. Ethical approval to carry out the study was
obtained from the the University of Sydney Human Research Ethics Committee (protocol
number: 2020/583).
Online operator
The online wagering operator involved in this study offers their customers opportunities
to bet on sports (e.g., football, boxing, basketball) and races (e.g., horses, dogs). Like all
1
The examples of how to calculate net outcome were developed in combination with the gambling operator
to use terminology and phrasing familiar to their customer base. In these examples the dollar sign on the
odds values can be considered redundant and may not be included on other sites. For example, odds at $2
for represent 2X profit if successful (i.e., a return two times the value staked, including the stake). To make
the calculation as simple as possible for participants, net outcome was defined as “all bet winnings minus
stake” so that net losses were minus values and net wins were positive values (previous studies have defined
net outcome as “stake minus winnings,” making net wins minus values and net losses positive values).PRE-PRINT: ACCURACY OF SELF-REPORTED GAMBLING 6
Table 1
Table 1. Example betting statement from wagering operator
Type Summary Transaction.Id Bet.Id Amount Balance
Bet Stake Team A v Team B; Choice: Team A @1.64 5 3 -13.1 0.0
Win Person 1 v Person 2; Choice: Person 2 @2.62 4 2 13.1 13.1
Bet Stake Person 1 v Person 2; Choice: Person 2 @2.62 3 2 -5.0 0.0
Bet Stake Person 3 v Person 4; Choice: Person 3 @3.34 2 1 -5.0 5.0
Deposit Debit / Credit Card (************1111) 1 NA 10.0 10.0
Note:
This table displays a fictitious, example transaction history for a customer from the wagering site involved
in this study. In this simple example, a customer deposits $10, wins one bet and loses two bets, ultimately
ending up losing the $10 they deposited. Determining net outcome using such statements becomes more
difficult to calculate, particularly for any duration of time other than overall, when multiple deposits are
made and the balance > 0.
online gambling sites in Australia, they do not offer live (“in-play”) betting. Customers
of the operator can view their history of bets and transactions on their online account, as
with most online gambling sites. In addition to this, customers of this site can download a
.csv spreadsheet file listing their full transaction history. However, the information provided
in this statement may not be an effective way of communicating customers’ net outcomes,
particularly over any specific period. The files do not contain the dates of bets or transactions
and do not separately list losses. See Table 1 for an example transaction history offered by
the operator.
Participants
Of the 40,000 customers invited to take part in study, 754 (1.88%) opened the survey.
After removing those who did not bet at least once in the preceding month, 652 (91.57%)
completed the first question about their gambling frequency, and 514 (72.19%) completed
the second question about their net outcome2 . The demographic and gambling-related
characteristics of all those who completed the net outcome question are presented in Table 1
and those who completed the bet frequency question are presented in Table 2.
2
We did not perform an a priori power analysis as we simply aimed to recruit as many participants as
possible through the operator’s contact with customers and could not control the ultimate number who would
volunteer to participate.PRE-PRINT: ACCURACY OF SELF-REPORTED GAMBLING
Table 2
Self-reported net outcome accuracy: Sample characteristics overall and by estimation type
Favourable bias Unfavourable bias
Variable Overall, N = 514 Accurate recall, N Underestimated Overestimated Underestimated Overestimated
=2 losses, N = 333 winnings, N = 50 winnings, N = 66 losses, N = 63
Age 43.7 (15.5) 66.5 (7.8) 43.3 (15.5) 44.9 (14.7) 44.4 (16.6) 43.3 (14.9)
Gender
Unknown 35 (6.8%) 0 (0%) 21 (6.3%) 1 (2.0%) 3 (4.5%) 10 (16%)
Male 439 (85%) 2 (100%) 285 (86%) 42 (84%) 58 (88%) 52 (83%)
Female 40 (7.8%) 0 (0%) 27 (8.1%) 7 (14%) 5 (7.6%) 1 (1.6%)
Self-reported outcome
Mean (SD) 105.2 (1,073.8) 4.5 (41.7) 42.1 (481.9) 819.7 (1,948.4) 310.7 (1,945.0) -340.2 (806.7)
Median [IQR] 5.0 [-60.0, 100.0] 4.5 [-10.2, 19.2] 5.0 [-50.0, 100.0] 150.0 [62.5, 500.0] 10.0 [-8.2, 187.5] -150.0 [-300.0,
-40.0]
Actual outcome
Mean (SD) -143.1 (1,030.3) 4.5 (41.7) -375.2 (623.2) 282.7 (650.4) 684.7 (2,217.8) -126.0 (216.1)
Median [IQR] -82.2 [-314.7, -3.1] 4.5 [-10.2, 19.2] -201.5 [-443.2, 65.3 [28.0, 181.0] 142.3 [34.6, 520.6] -43.6 [-152.1, -14.4]
-69.6]
Absolute discrepancy
Mean (SD) -248.3 (872.9) 0.0 (0.0) -417.3 (677.5) -537.0 (1,627.0) 374.0 (683.5) 214.2 (642.5)
Median [IQR] -100.2 [-338.9, 0.0] 0.0 [0.0, 0.0] -200.0 [-470.4, -68.2 [-346.6, -21.1] 105.1 [31.5, 270.1] 50.0 [16.2, 138.1]
-83.6]
Percentage discrepancy
Mean (SD) 1,611.4 (26,652.8) 0.0 (0.0) 222.4 (718.7) 408.6 (786.9) 173.6 (362.4) 11,465.4 (75,907.0)
Median [IQR] 100.0 [51.3, 184.9] 0.0 [0.0, 0.0] 106.8 [61.5, 162.1] 103.5 [42.6, 394.2] 84.1 [34.7, 109.0] 110.7 [32.9, 326.4]
Note:
Statistics presented: Age = mean (SD); Gender = N (%).
All monetary values are expressed in $AUD. All percentage discrepancy scores were converted to positive values for ease of interpretation and comparison.
7PRE-PRINT: ACCURACY OF SELF-REPORTED GAMBLING 8
Data Analysis
Data analysis was performed using statistical programming language R (version
4.0.2)(R Core Team, 2020). An ‘Absolute discrepancy’ score representing the difference
between self-reported and actual gambling values was calculated for each participant, along
with a ‘Percentage discrepancy’ score representing the absolute discrepancy as a percentage
of the person’s actual outcome (net outcome or bet frequency)3 . This provided an indicator
of recall accuracy that was relative to each participant’s actual gambling outcomes and
behavior. For example, two people with an absolute discrepancy of $50, one whose actual
net outcome was $200 and one whose was -$50, would have percentage discrepancy scores of
25% and %100, respectively (we made all percentage discrepancy scores positive values for
ease of interpretation).
Based on absolute discrepancy scores, participants were grouped into “estimation
categories” for net outcome (i.e., accurate recall, underestimating losses, over estimating
winnings, underestimating winnings, and overestimating losses) and betting frequency (i.e.,
accurate recall, underestimating, and overestimated). Unless otherwise stated, customers
whose self-reported and actual values perfectly matched were included within the “accurate
recall” group for both variables. For net outcome, customers who indicated they lost less
money than they actually lost (based on actual net outcome), or who stated they won money
when they lost, were classed as “underestimating losses.” Customers who indicated they lost
more money than they actually lost were classed as “overestimating losses.” Customers who
indicated they won more money than they actually won were classed as “overestimating
winnings.” Customers who indicated they won less money than they actually won, or who
stated they lost money when they won, were classed as “underestimating winnings.”
The discrepancy scores and actual values for net outcome and bet frequency were
non-normally distributed (Shapiro-Wilk’s test p-values < 0.05) and contained multiple
outliers (z scores > 3.29). As such, we used mostly nonparametric statistical tests to analyse
the data. Where relevant, all tests were two-tailed.
We performed ordinary least squares multiple linear regression analyses to determine
whether participants’ age, mean number of bets per active day, and actual gambling value
(i.e., betting frequency or net outcome as determined from their account data) predicted
the degree of inaccuracy in self-reports as determined by percentage discrepancy scores. In
all models, participant’s mean bets per active day was included as an indicator of “betting
intensity,” as previous research has found this variable to be associated with problematic
gambling online (Braverman & Shaffer, 2012). When predicting the extent of inaccuracy, a
separate linear model was performed for each type of estimation error (e.g., underestimating
betting frequency, underestimating losses) to provide the most comprehensive understanding
of recall biases. The “performance” R package was used to explore whether models met
the underlying statistical assumptions. Multicollinearity was not problematic for any of the
models (variable inflation factors were all < 5), although the residuals were non-normally
distributed, the error the variance was non-constant, and there were multiple influential
3
As an example, here are the calculations for the discrepancy variables relating to net outcome: Abso-
lute discrepancy = actual net outcome - self-reported net outcome; Percentage discrepancy = (absolute
discrepancy/actual net outcome)*100.PRE-PRINT: ACCURACY OF SELF-REPORTED GAMBLING 9
Table 3
Self-reported betting frequency accuracy: Sample characteristics overall and by estimation
type
Estimation grouping
Variable Overall, N = 652 Accurate recall, N Underestimated, N Overestimated, N
= 17 = 454 = 181
Age 43.3 (15.7) 51.2 (17.9) 43.5 (15.9) 42.1 (14.8)
Gender
Unknown 45 (6.9%) 0 (0%) 29 (6.4%) 16 (8.8%)
Male 546 (84%) 16 (94%) 376 (83%) 154 (85%)
Female 61 (9.4%) 1 (5.9%) 49 (11%) 11 (6.1%)
Self-reported frequency
Mean (SD) 57.4 (110.3) 6.3 (6.5) 50.0 (98.0) 80.6 (137.4)
Median [IQR] 30.0 [15.0, 60.0] 4.0 [1.0, 10.0] 30.0 [15.0, 50.0] 30.0 [14.0, 100.0]
Actual frequency
Mean (SD) 115.2 (243.2) 6.3 (6.5) 150.1 (279.9) 37.8 (80.1)
Median [IQR] 50.0 [18.0, 128.2] 4.0 [1.0, 10.0] 77.0 [37.0, 163.8] 13.0 [5.0, 34.0]
Absolute discrepancy
Mean (SD) -57.8 (220.2) 0.0 (0.0) -100.1 (245.5) 42.8 (93.0)
Median [IQR] -17.0 [-64.0, 1.0] 0.0 [0.0, 0.0] -39.0 [-93.0, -15.0] 12.0 [4.0, 34.0]
Percentage discrepancy
Mean (SD) 215.3 (1,154.4) 0.0 (0.0) 54.4 (22.8) 639.0 (2,137.2)
Median [IQR] 57.1 [34.4, 78.6] 0.0 [0.0, 0.0] 55.6 [38.9, 71.4] 73.9 [29.0, 235.2]
Note:
Statistics presented: Age = mean (SD); Gender = N (%)
All percentage discrepancy scores were converted to positive values for ease of interpretation and comparison.
data points (Cook’s distance > 4/N ). As such, to improve model diagnostics we removed
influential data points and transformed the following two right-skewed variables in all models
using a cube-root transformation: [1] percentage discrepancy scores and [2] the relevant
actual variable (bet frequency or net outcome) derived from account data.
We also performed three binomial logistic regression analyses to determine what factors
predicted which type of estimation error (under- or over-estimation) participants would make
in their self-reports. For net outcome, we ran two models—one for net losers (i.e., people
who lost money over the 30 days) and one for net winners (i.e., people who won money over
the 30 days). The third model predicted the type of estimation error when self-reporting
bet frequency. We used the following variables as predictors in all three models: age, mean
bets per active day, and actual net outcome. The latter two variables were transformed in
all models using a cube-root transformation.
As we performed multiple inferential statistical tests, we set alpha (α) at 0.005 for
all analyses to reduce the experiment-wise Type-I error rate (Benjamin et al., 2018). An
analysis document outlining the full process of processing and analysing the data is stored on
OSF and includes all outcomes produced from the analysis process (https://osf.io/et8ua/).PRE-PRINT: ACCURACY OF SELF-REPORTED GAMBLING 10
Results
Accuracy of Self-Reported Values
Among the 514 participants who reported their past 30-day net outcome, only 2
(0.39%) were perfectly accurate. This number raises to 21 (4.09%) if allowing for a 10%
margin of error based on participants’ actual net outcome4 . Participants whose estimate
was within 10% of their actual value had a lower actual net outcome (Mdn = $-24.25;
range = -562.94 to 535) than the remaining sample (Mdn = $-89.12; range = -6881.16 -
17264.99), but this difference was not statistically different using a Wilcoxon rank sum test
with continuity correction (W = 6542, p = .041). They were also more likely to be older
(Mdn = 45; range = 28 to 72) than the more inaccurate participants (Mdn = 42; range
= 18 - 84), although this difference was also not statistically different (W = 5912.50, p
= .27). The gender distribution for this group (male = 90.48%, female = 9.52%) was not
significantly different from the remaining sample (male = 85.19%, female = 7.71%, unknown
gender = 7.1%) using a Fisher’s exact test (p = 0.56).
The most common type of estimation error regarding net outcome was underestimat-
ing losses (N = 333, 64.79%), followed by underestimating winnings (N = 66, 12.84%),
overestimating losses (N = 63, 12.26%), and overestimating winnings (N = 50, 9.73%; see
Table 1 for the characteristics of participants who made each estimation error type). Overall,
174 (33.85%) participants self-reported a positive net outcome (they thought they had won
money) but actually had a negative net outcome (they lost money), whereas 18 (3.50%)
self-reported a negative net outcome but actually had a positive net outcome.
Of the 652 participants who reported their past 30-day gambling frequency, only 17
(2.61%) perfectly recalled the number of bets they had placed. This number raises to 48
(7.36%) if allowing for a 10% margin of error based on participants’ actual bet frequency.
Participants whose estimate was within 10% of their actual value had a lower actual bet
count (Mdn = 21.5; range = 1 to 387) than the remaining sample (Mdn = 53.5; range
= 1 to 3428), and this difference was statistically different according to a Wilcoxon rank
sum test with continuity correction (W = 9898.50, p < .001). They were also more likely
to be older (Mdn = 43.5; range = 20 to 74) than the more inaccurate participants (Mdn
= 42; range = 18 to 84), although this difference was also not statistically different (W
= 15473.50, p = .44). The gender distribution for this group (male = 93.75%, female =
2.08%, unknown gender = 4.17%) was not significantly different from the remaining sample
(male = 82.95%, female = 9.93%, unknown gender = 7.12%) using a Fisher’s exact test (p
= 0.13). Substantially more participants underestimated (N = 454, 69.63%) rather than
overestimated (N = 181, 27.76%) their betting frequency (see Table 2 for the characteristics
of participants who made each estimation error type).
4
We selected a 10% margin of error as a reasonable margin that could account for discrepancies caused by
customers’ rounding and summarising of their outcomes and bets, but this value is somewhat arbitrary. In
our data analysis document on OSF, we provide rates of accuracy for net outcome and bet frequency based
on margins of 5, 10, 20, 30, 40, and 50% for interested readers (access here: https://osf.io/et8ua/). Our data
and analysis code are also available for anyone wishing to calculate accuracy levels using alternative margins
of error.PRE-PRINT: ACCURACY OF SELF-REPORTED GAMBLING 11
Degree of Difference Between Self-Reported & Actual Values
The distribution of participants’ self-reported and actual gambling values are visualized
in Figure 1. The overall median absolute difference between self-reported and actual net
outcome was $-100.20 (range: $-10,218.10 to +4,675.04) and the median percentage difference
was 100 (range: 0 to 599900). A Wilcoxon signed rank test with continuity correction
determined that the absolute difference between reported and actual values was statistically
significant (V = 105468, p < .001). The overall median absolute difference between self-
reported and actual betting frequency was 17 bets (range: -897 to 3328) and the median
percentage difference was 57.14 bets (range: 0 to 19900). The absolute difference between
reported and actual bet frequency was statistically significant (V = 159955, p < .001).
Figure 1 . Self-reported & actual values for net outcome (A) & betting frequency (B). Figure
legend: These raincloud figures present a boxplot, density curve, & the raw datapoints for self-reported &
actual values, with lines connecting each person’s two values. The y-axis on both figures is presented on a
log-10 scale as the natural scale for these outcomes is very large & precludes effective visualization.
Relationship Between Self-Reported & Actual Values
We plotted the relationships between self-reported and actual values for net outcome
(Figure 2) and bet frequency (Figure 3) as scatter graphs. Using a Spearman’s rankPRE-PRINT: ACCURACY OF SELF-REPORTED GAMBLING 12 Figure 2 . Correlation between actual & self-reported net outcome. Figure legend: This scattergraph shows the relationship between self-reported & actual net outcome. Points are colour coded based on the particular estimation error type (or lack of) that each person made. The black line represents perfect accuracy (i.e., recalled outcome & actual outcome are equal). Figure 3 . Correlation between actual and self-reported betting frequency. Figure legend: This scattergraph shows the relationship between self-reported and actual betting frequency. Points are colour coded based on whether the person underestimated or overestimated their number of bets or was accurate in their recall. The black line represents perfect accuracy (i.e., recalled frequency and actual frequency are equal).
PRE-PRINT: ACCURACY OF SELF-REPORTED GAMBLING                                                              13

correlation rho there was a medium, positive, and statistically significant association between
self-reported and actual net outcome (r s = 0.25, p < .001). The association between self-
reported and actual bet frequency was strong, positive, and statistically significant (r s =
0.67, p < .001).

Predicting Inaccuracy of Self-Reported Gambling

       Table 3 presents the outcomes from four linear multiple regression models predicting the
extent of each net outcome estimation error. The most consistent predictor of greater recall
inaccuracy across all estimation error types was participants’ actual net outcome. This was
particularly the case for participants who actually lost, with smaller loss amounts associated
with more inaccuracy when underestimating and—to a greater extent—overestimating losses.
Lower actual winning values were also associated with greater inaccuracy among winning
bettors, but these effects were not statistically significant at our adjusted α level. We did
not include gender as a predictor in these models as there were so few female and unknown
gender participants once they were divided across the four estimation error types (see Table
1). Instead, we performed a non-parametric Kruskal-Wallis rank sum test to see whether the
percentage discrepancy between self-reported and actual net outcome differed significantly
between genders. The difference was largest for females (Mdn = 133.33, range = 6.54 to
2000; N = 40), followed by males (Mdn = 100, range = 0 to 599900; N = 439), and those
with an unknown gender (Mdn = 100, range = 23.08 to 2129.38; N = 35). However, the
effect of gender on percentage discrepancy scores was not statistically significant (χ2 [2, N
= 514] = 2.43, p = 0.30).
       Table 4 presents the outcomes from two linear multiple regression models predicting
the extent of each type of estimation error when recalling betting frequency. As with net
outcome, the only consistent predictor of greater recall inaccuracy across both estimation
error types was participants’ actual bet frequency, with higher values associated with greater
inaccuracy among underestimators and—to a lesser extent—lower actual values associated
with greater inaccuracy among overestimators. Again, we did not include gender as a
predictor in the models due to small cell sizes (see Table 2). We used a non-parametric
Kruskal-Wallis rank sum test to see whether the percentage discrepancy between self-reported
and actual bet frequency differed significantly between genders. The difference was largest
for those with an unknown gender (Mdn = 68.75, range = 9.09 to 9900; N = 45), followed
by females (Mdn = 64.29, range = 0 to 1900; N = 61), and males (Mdn = 54.95, range =
0 to 19900; N = 546). However, the effect of gender on percentage discrepancy was not
statistically significant (χ2 [2, N = 652] = 7.28, p = 0.03)5 .

Predicting Type of Estimation Bias

      Table 6 presents the outcomes from three logistic regression models predicting which
type of estimation error (under-/over-estimate) participants made based on their demographic
   5
     No statistically significant pairwise differences were observed between gender groups’ percentage discrep-
ancy for net outcome or bet frequency as determined using post-hoc Wilcoxon rank sum tests with continuity
corrections and Benjamini-Hochberg adjusted p-values.
PRE-PRINT: ACCURACY OF SELF-REPORTED GAMBLING 14
Table 4
Prediction of inaccuracy when estimating net outcome: Linear regression analyses outcomes
B coefficients Model fit
Model & terms B SE CI(LB) CI(U B) Statistic p-value Adj R2
Underestimated losses (n=316)
Age 0.00 0.00 -0.01 0.01 -0.24 0.814
Bets per active day 0.00 0.01 -0.02 0.01 -0.24 0.812 0.04
Actual net outcome -0.12 0.03 -0.18 -0.06 -3.76 0.000
Overestimated winnings (n=45)
Age -0.03 0.03 -0.08 0.03 -0.93 0.357
Bets per active day 0.23 0.13 -0.04 0.51 1.73 0.091 0.15
Actual net outcome -0.36 0.12 -0.61 -0.11 -2.95 0.005
Underestimated winnings (n=63)
Age 0.01 0.01 -0.01 0.04 1.08 0.283
Bets per active day -0.03 0.03 -0.10 0.04 -0.94 0.353 0.06
Actual net outcome -0.11 0.05 -0.20 -0.01 -2.24 0.029
Overestimated losses (n=61)
Age 0.06 0.04 -0.01 0.14 1.73 0.088
Bets per active day 0.05 0.03 0.00 0.11 1.87 0.067 0.22
Actual net outcome -1.03 0.29 -1.62 -0.45 -3.54 0.001
Note:
The outcome variable for all models was the percentage discrepancy between self-reported and actual values. For
ease of interpretation, both the percentage discrepancy variable and actual net outcome variable were converted
to positive values for losing gamblers. The graphical column visually displays the B coefficients and their 95%
confidence intervals (dotted line = 0).
Abbreviations: SE = Standard error; CI = 95% confidence interval (LB & UB = lower & upper bounds, respect-
ively).
(age) and betting characteristics (mean bets per day and actual net outcome). Among net
losers (i.e., customers who lost money over the 30-day window), those who lost more money
were more likely to underestimate their losses. No variables were significantly predictive of
the estimation error type made among net winners (i.e., customers who won money over
the 30-day window). In relation to bet frequency, having a higher mean number of bets per
active day was associated with underestimating the tota total number of bets made.
Discussion
The aim of this study was to extend the previous work in this area by [1] determining
whether providing instructions on how to calculate net outcome improves recall accuracy,
and [2] investigating people’s ability to recall their past-month gambling frequency. We
found very few participants were able to accurately recall their net outcome or betting
frequency, although recall for the latter was better. People were more likely to be favourably
biased in their recall (i.e., mentally increasing their funds by underestimating their losses or
overestimating their winnings), which is consistent with previous studies (Auer & Griffiths,PRE-PRINT: ACCURACY OF SELF-REPORTED GAMBLING 15
Table 5
Prediction of inaccuracy when estimating bet frequency: Linear regression analyses outcomes
B coefficients Model fit
Model & terms B SE CI(LB) CI(U B) Statistic p-value Adj R2
Underestimated bets (n=439)
Age -0.09 0.06 -0.20 0.02 -1.56 0.121
Bets per active day 0.31 0.12 0.08 0.54 2.62 0.009 0.24
Actual bet frequency 7.48 1.08 5.35 9.61 6.91 0.000
Overestimated bets (n=172)
Age 0.01 0.01 -0.02 0.04 0.74 0.458
Bets per active day 0.10 0.07 -0.03 0.24 1.50 0.135 0.17
Actual bet frequency -1.19 0.22 -1.62 -0.76 -5.49 0.000
Note:
The outcome variable for both models was the percentage discrepancy between self-reported and actual values. To
best reduce non-linearity, the ’Actual bet frequency’ variable was log transformed (as opposed to being cubed tran-
sformed like other transformed variables inlcuded in our linear models [see Data analysis section]) using the log1p()
R function in the model predicting underestimation of bets. The graphical column visually displays the B coeffici-
ents and their 95% confidence intervals (dotted line = 0).
Abbreviations: SE = Standard error; CI = 95% confidence interval (LB & UB = lower & upper bounds, respectiv-
ely).
2017; Braverman et al., 2014). This finding extended to self-reported betting frequency,
where the majority participants underestimated the number of bets they had placed. Self-
reported and actual values were correlated, but the discrepancy between these values was
often considerable, particularly for participants with favourably biased recall (e.g., those who
underestimated losses did so by a median value of AUD$200). The only consistent predictor
of the percentage discrepancy between self-reported and actual values was the actual value of
interest (net outcome or betting frequency). Lower actual net outcomes were associated with
greater inaccuracy among those who under- and over-estimated their losses. Participants who
underestimated their bet count were more likely to have higher actual betting frequencies
and those who overestimated had lower actual betting frequencies. Finally, losing more
money was associated with underestimating (as opposed to overestimating) net losses among
those who actually lost money, and placing more bets per active betting day was associated
with underestimating betting frequency.
Comparison with Previous Studies
It is difficult to compare the exact rates of accuracy between our study and the findings
of Braverman et al. (2014) and Auer and Griffiths (2017) as these studies defined “accurate
recall” using a measure that involved dividing the absolute discrepancy by each person’s
average bet size, and classifying participants as “accurate” if they scored between -1 and +1
on this measure (i.e., the difference between the self-reported and actual net outcome was
within one average bet size). We were not provided with participants’ wager amounts and
were therefore unable to calculate their average bet size. Instead, we chose to standardize
each participant’s absolute discrepancy between their self-reported and actual net outcomePRE-PRINT: ACCURACY OF SELF-REPORTED GAMBLING 16
Table 6
Prediction of bias type when estimating net outcome: Logistic regression analyses outcomes
B coefficient
Term B SE CI(LB) CI(U B) Statistic p-value
Net losers model; predicting underestimation of losses (n=396)
Age 0.00 0.01 -0.02 0.02 0.19 0.85
Bets per active day 0.22 0.31 -0.37 0.85 0.72 0.47
Actual net outcome -0.37 0.08 -0.54 -0.23 -4.74 0.00
Net winners model; predicting overestimation of winnings (n=116)
Age 0.00 0.01 -0.03 0.02 -0.13 0.90
Bets per active day -0.26 0.39 -1.06 0.50 -0.67 0.50
Actual net outcome -0.10 0.06 -0.24 0.01 -1.67 0.10
Bet frequency model; predicting underestimation of betting (n=635)
Age 0.00 0.01 -0.01 0.01 -0.08 0.93
Bets per active day 1.98 0.24 1.53 2.46 8.31 0.00
Actual net outcome 0.03 0.02 -0.01 0.07 1.48 0.14
Note:
SE = Standard error; CI = 95% confidence intervals (LB & UB = lower & upper bounds,
respectively). The graphical column visually displays the B coefficients and their
95% confidence intervals.
by dividing it by their actual net outcome and producing a percentage discrepancy score,
thus providing an indication of the extent to which they were (in)accurate relative to their
actual outcome. We found only 2 (0.39%) participants were perfectly accurate in recalling
their past-month net outcome but, using percentage discrepancy scores, 21 (4.09%) were
within a 10% margin of their actual net outcome. By contrast, Braverman et al. (2014)
found 13% and 7% of participants’ self-reported outcomes were within one average bet size
of their actual past three-month and 12-month outcomes, respectively. Auer and Griffiths
(2017) found 74% of their participants’ self-reported outcomes were within one average bet
size of their actual past-month outcome. Using percentage discrepancy scores as our primary
outcome in our multiple regression analyses may explain why we found smaller losses and
win amounts were associated with greater inaccuracy of self-reports, whereas Braverman et
al. (2014) and Auer and Griffiths (2017) found the obverse6 .
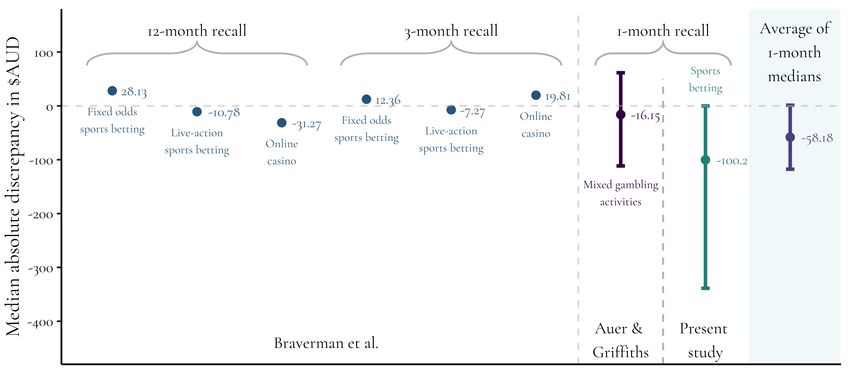
To more directly compare the results found here and those of previous studies (Auer
& Griffiths, 2017; Braverman et al., 2014), Figure 4 displays the only variable that has
been consistently reported in all studies, namely the overall median absolute discrepancy
between self-reported and actual net outcome. As can be seen, the discrepancy found in the
present study is considerably larger than in previous investigations. This is contrary to our
expectations as, unlike previous studies, we provided participants with brief instructions and
examples of how to calculate their net outcome. In addition, we only asked participants to
6
We are confident in this assumption as we originally used participants’ absolute discrepancy scores as the
outcome variable in our regression models predicting self-report inaccuracy and found the same as Braverman
et al. (2014) and Auer and Griffiths (2017)—greater loss and win amounts were consistently associated with
greater levels of self-report inaccuracy.PRE-PRINT: ACCURACY OF SELF-REPORTED GAMBLING 17
recall their past-month outcomes, and not the greater time periods of three and 12 months
studied by Braverman et al. (2014). The larger discrepancy here could be the result of the
Australia having a high national minimum wage and one of the highest per-capita gambling
expenditure rates in the world (Queensland Government Statistician’s Office, 2021); though
a further replication study in Australia would be required to confirm whether the substantial
discrepancy here is typical of Australian gamblers (Heirene, 2020). The difference in result
could also be in part due to the different online gambling platforms used by customers,
which include different gambling activities and likely vary in their presentation of outcomes
to customers.
Figure 4 . Cross-study comparison of absolute median discrepancy between self-reported &
actual net outcome Figure legend: This figure displays, for comparative purposes, the median absolute
discrepancy between self-reported & actual net outcome values found in Braverman et al. (2014), Auer &
Griffiths (2017), & the present study. We also computed & present the unweighted average 1-month median
discrepancy based on the outcomes from Auer & Griffiths & the present study. The error bars for Auer &
Griffiths’ & the present study’s median values represent the interquartile range (i.e., 25th & 75th percentiles).
The error bars for the average 1-month median discrepancy represent the standard deviation. The values
from previous studies were converted from the original currencies (Euro & NOK) to AUD using an online
digital currency converter (https://www.xe.com/currencyconverter/) on 2021/06/21.
Limitations
Our findings and their generalizability are limited in several ways. First, as discussed
above, we were not provided with participants’ betting amounts and were therefore unable
to calculate the standardized measure of bias computed by Braverman et al. (2014) and
Auer and Griffiths (2017) that would have allowed direct comparisons with their findings.
Second, only 1.88% of the customers sent the study recruitment email started the survey
and even fewer completed the requisite questions. Thus, the final sample represents only a
small, self-selected proportion of the wagering site’s customers. However, briefly comparing
the characteristics of the 652 customers included in our analyses with the 102 excluded due
to lack of responses or not having gambled in the previous 30 days, the former were more
likely to be male (p < 0.001, Chi-square test) and had a higher number of bets (p < 0.001),PRE-PRINT: ACCURACY OF SELF-REPORTED GAMBLING 18
betting days (p < 0.001), and bets per day (p < 0.001) in the past 30 days than excluded
customers (Wilcoxon-signed rank tests). The differences in net outcome (p = 0.382) and
age (p = 0.874) between the samples were not statistically different (Wilcoxon-signed rank
tests)7 . While we did not have access to the details of all 40,000 customers invited to take
part, the comparison with the smaller number of customers who opened the survey but were
not included in analyses suggests that the sample used in this study may comprise more
regular gamblers and urges caution in applying our findings to more infrequent bettors.
A further limitation of the study is that the sample comprised only Australian sports
and race wagering customers and may therefore not generalize to people from other countries
and those engaging in other forms of gambling, including cash-based gambling. Relatedly,
we focused only on people’s gambling with one site, and many online gamblers report
holding accounts across multiple sites simultaneously (Gainsbury et al., 2015; UK Gambling
Commission, 2020). As a result, outcomes from one site may be less relevant to consumers
than their overall, across-site outcomes. Lastly, the account data provided by the site did
not include indicators of race or ethnicity and so we were unable to determine the extent to
which our findings generalize along these factors.
Implications & Future Research
This was the first study (to the authors’ knowledge) to explore self-report accuracy
in the gambling context outside of Europe and our results advance the understanding of
this topic in several ways. First, our findings indicate that providing guidance on how to
calculate one’s net outcome does not improve the accuracy of peoples self-reported outcomes.
It may be unrealistic to expect customers to learn to calculate their own net outcome so
quickly and based on only brief guidance. However, we did not directly compare self-reported
outcomes made with and without the added guidance within this study and thus further
research in needed to clarify the value of providing this type of instruction and how it should
be presented.
The findings support the importance of providing gambling customers with regular
activity statements that clearly demonstrate their wins, losses, and net outcomes to improve
individual’s understanding of these such that they are making informed decisions about their
future bets based on past outcomes and available funds (Behavioural Economics Team of
the Australian Government, 2020). Existing research suggests including graphic illustrations
in activity statements may be useful in assisting individuals to keep track of wins, losses,
and net outcomes (Behavioural Economics Team of the Australian Government, 2020).
Activity statements should be provided by default to customers at regular periods given
that most will unlikely voluntarily access this information (Heirene et al., 2021) and they
should include clear statements of net outcomes rather than a list of all activity, although a
detailed breakdown of all bets should also be available to customers.
The discrepancy between self-reported and actual net outcome observed in this study
was considerably larger than found in previous studies (Auer & Griffiths, 2017; Braverman et
7
See subsection of our analysis document on OSF titled “Representativeness of our sample” (https:
//osf.io/et8ua/) for a more detailed comparison of the two groups.PRE-PRINT: ACCURACY OF SELF-REPORTED GAMBLING 19
al., 2014), suggesting recall inaccuracy may be more problematic in terms of biasing people’s
decision making than previously thought. Of note, Braverman et al. (2014) found the size
of the discrepancy between self-reported and actual values was more consistently associated
with self-reported problem gambling than the type of estimation bias (e.g., overestimating
winnings) someone displayed. We did not have access to problem gambling scores but found
the extent of recall inaccuracy was not associated with our measure of betting intensity
(i.e., bets per day). However, this is only a proxy measure of risky gambling and is not
sufficiently indicative of problem gambling in isolation. Our findings are concerning with
regard to gambling harms—most people who gamble online lose substantially more money
than they think they do and may be unknowingly spending outside of their means.
This was also the first study (to the authors’ knowledge) to explore the accuracy
of self-reported betting frequency. People appear to be better able to recall the number
of bets they have placed (7.36% accurate within a 10% margin) than their net outcome
(4.09% accurate within a 10% margin), although recall remains poor. This finding supports
our contention that poor recall of gambling outcomes may be in part due to the difficulty
and variability associated with calculating net outcome. This may suggest that betting
operators be required to provide greater transparency over outcomes for customers using
clear terminology about net outcomes with consideration of each person’s chosen bet size.
The potential loss and win should be clearly stated for customers before a bet is made and
after the outcome is provided to increase accurate understanding of outcomes. Overall,
gambling sites need to improve the ways in which they are communicating their customers’
(potential) outcomes to them so that they are supported to make informed decisions about
their gambling.
Our findings further question the use of self-reported outcomes in gambling research
and indicate that self-reported gambling frequency is also often inaccurate. Similar outcomes
have been observed for self-reported alcohol (Northcote & Livingston, 2011 Nov-Dec) and
drug use (Ashrafi et al., 2018) but, unlike with substance use, objective measures of gambling
involvement and expenditure are available via online account data, loyalty card data, and
information collected by financial institutions (e.g., Heirene et al., 2021; Muggleton et al.,
2021). The results of gambling studies predicated on self-report should be interpreted
cautiously. This has major implications for the gambling field, from the understanding of
gambling harms to evidence of intervention and policy impact. Self-report surveys are often
used in government-commissioned research to understand the prevalence of gambling and
related harms in a region (e.g., Tajin et al., 2021; UK Gambling Commission, 2018, 2020),
and outcomes from these studies are used to recommend local policies and practices (e.g.,
Wardle et al., 2019). Such surveys are also regularly used to evaluate the impact of strategies
that aim to reduce or prevent gambling harms, such as self-exclusion (e.g., Hing et al., 2015)
and pre-commitment schemes (see Blaszczynski et al., 2014). If, as suggested here, 50% of
people are more than 100% inaccurate in their estimations of their recent gambling outcomes,
then comparing self-reported outcomes between intervention and control samples or pre-
and post-intervention is unlikely to produce reliable information about the effectiveness of
an intervention.
There is a need to replicate gambling studies relying on self-reports using objective
expenditure and frequency data to ensure the veracity of our understanding of gamblingPRE-PRINT: ACCURACY OF SELF-REPORTED GAMBLING 20
related phenomena. The data sources mentioned above—online gambling account data,
loyalty card data, and information collected by financial institutions—can provide reliable ex-
penditure data and the hosting organisations should be encouraged to make their anonymized
data available for research purposes. Currently, only online gambling expenditure can be
reliably tracked. The increasing move towards cashless gambling payments (Gainsbury &
Blaszczynski, 2020; Taskinson, 2020) will assist with overcoming the major limitation of
these data sources—namely, the absence of information about cash expenditure. There has
also been increased interest in the extent to which financial institutions can add a valuable
source of gambling-related data due to the ability to track expenditure across multiple types
of gambling (e.g., online and casino). Swanton et al. (2019) have suggested that financial
institutions could take a more active role in informing customers about their gambling
expenditure, and our findings support the value of this strategy.
Finally, our findings support previous studies (Auer & Griffiths, 2017; Braverman et al.,
2014) in showing that demographic characteristics, namely age and gender, are not associated
with self-report inaccuracy in this context. Indeed, none of the variables in our regression
models—other than the actual values for net outcome and frequency—were predictive of
inaccurate self-reports and our models were, overall, poor at explaining variability in the
outcomes. Future research should explore the predictive value of other characteristics
hypothesized to be associated with self-report accuracy, such as the presence of mood and
substance disorders (Braverman et al., 2014).
Conclusions
This study aimed to test whether people can accurately recall their past gambling
outcomes and behavior. Our findings call into question the reliability of self-reported
gambling expenditure and frequency and support the value of using actual betting data to
study gambling-related phenomena. Further, findings suggest governments and gambling
operators should not presume that individuals are making informed choices about their
betting based on an accurate understanding of their outcomes.You can also read