A Semi-quantitative Food Frequency Questionnaire Has Relative Validity to Identify Groups of NOVA Food Classification System Among Mexican Adults
←
→
Page content transcription
If your browser does not render page correctly, please read the page content below
ORIGINAL RESEARCH
                                                                                                                                              published: 03 February 2022
                                                                                                                                            doi: 10.3389/fnut.2022.737432

                                               A Semi-quantitative Food Frequency
                                               Questionnaire Has Relative Validity to
                                               Identify Groups of NOVA Food
                                               Classification System Among
                                               Mexican Adults
                                               Cecilia Isabel Oviedo-Solís 1 , Eric A. Monterrubio-Flores 1 , Sonia Rodríguez-Ramírez 1 ,
                                               Gustavo Cediel 2 , Edgar Denova-Gutiérrez 1* and Simón Barquera 1
                                               1
                                                Center for Nutrition and Health Research, National Institute of Public Health, Cuernavaca, Mexico, 2 School of Nutrition and
                                               Dietetics, University of Antioquia, Medellín, Colombia

                                               Background: Ultra-processed foods are recognized as indicators of an unhealthy
                                               diet in epidemiological studies. In addition to ultra-processed foods, the NOVA food
                                               classification system identifies three other groups with less processing. Unprocessed
                           Edited by:          foods that, together with minimally processed foods (MPF), make NOVA group 1, NOVA
                       Soham Al Snih,
                                               group 2 is processed culinary ingredients, and NOVA group 3 is processed foods.
 University of Texas Medical Branch at
              Galveston, United States         Objective: To assess the relative validity of the semi-quantitative food frequency
                        Reviewed by:           questionnaire (SFFQ) to estimate the energy intake for each group NOVA classification
                         Rosaura Leis,
             University of Santiago de
                                               system by comparing it with two 24 h-dietary-recall (24DRs) Mexican adults.
                   Compostela, Spain
                                               Methods: We analyzed dietary information from 226 adults included
Oviedo-Solís et al.                                                                                             SFFQ and NOVA Food Classification

INTRODUCTION                                                                MATERIALS AND METHODS
In epidemiological studies, ultra-processed foods are                       Study Design and Participants
recognized as an unhealthy diet indicator (1–12). As                        The diet information for the present study was obtained from
defined by the NOVA food classification system (belonging                   the Mexican National Health Nutrition Survey 2012 (ENSANUT
to NOVA group 4), ultra-processed foods are industrial                      2012, by its Spanish acronym). The ENSANUT 2012 is a
formulations of food substances often modified by a                         nationally representative survey, probabilistic with multi-stage
chemical process and frequent use of cosmetic additives                     stratified sampling. The coverage and methodology design of the
and sophisticated packaging (13). In adults, high consumption               national survey was previously published (28). ENSANUT 2012
of ultra-processed food is associated with adverse health                   obtained information of 46,303 adults (≥20 years). The collection
outcomes (14–16).                                                           of the ENSANUT 2012 data was carried out between October
    In addition to ultra-processed foods, the NOVA food                     2011 and May 2012. Detailed dietary information was collected
classification system identifies three other groups with a lesser           from a random subsample. Adults with complete information
degree of processing. Unprocessed and minimally processed                   of one SFFQ and two 24DRs were 252 of them, 178 adults
Oviedo-Solís et al. SFFQ and NOVA Food Classification
(27), and the second was obtained on non-consecutive days. The Then, we estimated % of energy intake and energy intake for
mean number of days between the first and second 24DR was 24DRs and SFFQ by NOVA categories.
2.4 ± 1.2 days (31). Participants were asked in detail about their To assess relative validity, we compared SFFQ against the
food consumption during the previous day. At the beginning of 24DRs for % energy intake and energy intake (kcal) for all
the interview, participants listed the foods they had consumed four of the NOVA categories and unprocessed and minimally
during the previous day. Afterward, the interviewer returned to processed foods group and processed culinary ingredients group
the preliminary food list and helped the interviewer remember jointly. We calculated mean, confidence intervals, and median,
frequently omitted foods. Subsequently, the list of foods was Q1–Q3, and reported significance with paired t-tests (parametric
organized according to the moment and context in which each distribution) or Wilcoxon signed-rank test (non-parametric
food was consumed. Then, detailed information about each distribution), spearman correlations, and intra-class correlations
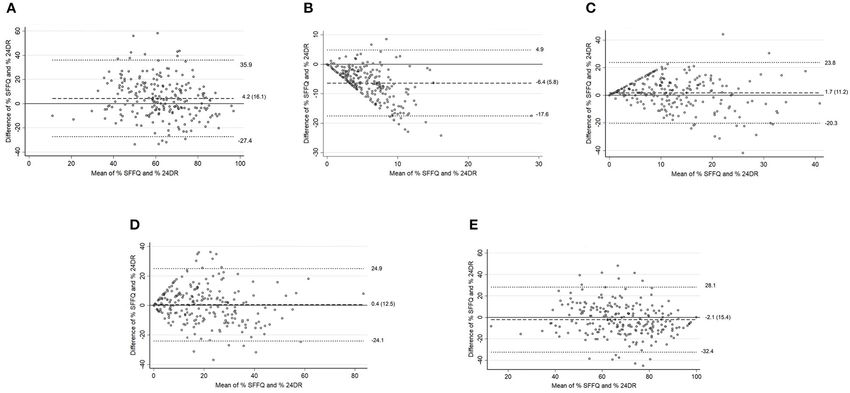
food was collected. Finally, a review of the final food list was between measures. We generated Bland–Altman plots with limits
performed to obtain additional information or to correct any of agreement (95%).
specific information that was incorrectly registered. The extended We categorized energy intake by quintiles to assess the ranking
description of multiple pass 24DR was previously reported (30). ability of the SFFQ, as the proportion of participants who were
correctly classified (same quintile), adjacently classified (same or
Food Classification next quintile), or grossly misclassified (highest quintile by SFFQ
The foods and beverages reported in the two 24DRs and an and lowest by 24DRs, or vice versa).
SFFQ were classified according to the extent and purpose To interpret the strength of agreement, Landis and Koch
of food processing with the NOVA classification system (34) suggest the following interpretations for below 0.0 poor,
(Supplementary Figure 1). The foods were classified as (a) 0.00–0.20 slight, 0.21–0.40 fair, 0.41–0.60 moderate, 0.61–0.80
unprocessed and minimally processed foods group (e.g., fruits, substantial, 0.81–1.00 almost perfect.
vegetables, fresh meat, legumes, tortilla); (b) processed culinary Finally, we calculated weighted kappa to eliminate the random
ingredients group (e.g., plant oils, sugar, animal fats); (c) effect. Significance was considered when P < 0.05. The Stata
processed foods group (e.g., unpackaged fresh bread, cheese, statistical software version 14.0 was used for all analyses.
salted meat, preserved vegetables, and fruits); (d) ultra-
processed foods group (e.g., carbonated soft drinks, sweet
snacks, confectionery, reconstituted meat products, industrial RESULTS
packaged bread, ready-to-eat products like “nuggets”, and
“sticks”). Additionally, we analyzed unprocessed and minimally We analyzed dietary information from 226 adults; 70% (n = 158)
processed foods group and processed culinary ingredients wereOviedo-Solís et al. SFFQ and NOVA Food Classification
TABLE 1 | Characteristics of the participants in the relative validation study.
Total adults Adults (Oviedo-Solís et al. SFFQ and NOVA Food Classification
TABLE 2 | Percentage energy intakes and difference mean between SFFQ and 24DRs in adults and older adults in NOVA foods groups.
NOVA foods groups 24DRs SFFQ Mean differencea (95% CI) between SFFQ
and 24DRs
Total adults Adults Older adults Total adults Adults Older adults Total adults Adults Older adults
(Oviedo-Solís et al. SFFQ and NOVA Food Classification
TABLE 3 | Correlation between SFFQ and 24DRs in adults and older adults in NOVA foods groups.
NOVA foods groups Spearman correlation coefficient (95% CI) Intra-Class correlation coefficient (95% CI)
between SFFQ and 24DRs between SFFQ and 24DRs
Total adults Adults (Oviedo-Solís et al. SFFQ and NOVA Food Classification FIGURE 2 | Adults (
Oviedo-Solís et al.                                                                                                                             SFFQ and NOVA Food Classification

TABLE 4 | Cross classification by quintiles of energy consumption between SFFQ and 24DRs in NOVA foods groups.

NOVA foods groups                                     Correctly                    Correctly or adjacently                    Grossly misclassified               Weighted kappa
                                                   classified (%)a                     classified (%)b                                (%)c                             (SD)

                                                                                      Total adults
                                                             Unprocessed and minimally processed foods group
Energy intake percentage                                  38.1                                  75.7                                     2.2                        0.39 (0.05)d
                                                                      Processed culinary ingredients group
Energy intake percentage                                  29.2                                  59.3                                     6.2                        0.17 (0.05)d
                                                                              Processed foods group
Energy intake percentage                                  29.6                                  65.5                                     3.1                        0.23 (0.05)d
                                                                           Ultra-processed foods group
Energy intake percentage                                  37.2                                  78.8                                     1.8                        0.43 (0.05)d
                                   Unprocessed and minimally processed foods group and processed culinary ingredients group
Energy intake percentage                                  38.9                                  78.3                                     2.2                        0.43 (0.05)d
                                                                                    Adults (
Oviedo-Solís et al. SFFQ and NOVA Food Classification
personnel was trained and standardized to collect all the required Salud Pública. The patients/participants provided their written
information through face-to-face interviews to ensure the quality informed consent to participate in this study.
of the information (28).
These results, coming from a representative sample, are the AUTHOR CONTRIBUTIONS
first of this type in Mexico and Latin America in general,
which can serve as a baseline to carry out other studies of CIO-S developed research questions, analyzed and interpreted
a longitudinal nature, evaluating the effects of ultra-processed the data, and wrote the first draft of the manuscript. EAM-F and
foods group consumption using the SFFQ. Ultra-processed SR-R contributed data collection and support analyzed the data.
foods consumption is one of the trending topics due to its GC, ED-G, and SB support interpreted the data and assisted in
relationship with chronic illnesses and new politics in public the writing of the manuscript. All authors read and approved the
health (45). final manuscript before submission.
In conclusion, the SFFQ had acceptable validity to rank the
percentage of energy intake from unprocessed and minimally FUNDING
processed foods group and ultra-processed foods group in
Mexican adults, both in adults under 60 years and who were 60 This work was carried during the period from 2017 to 2021. CIO-
years old or older. However, the SFFQ was not recommended S received a grant from CONACyT to study for a Ph.D. degree
to identify processed culinary ingredients group according to the (589934).
NOVA classification system.
ACKNOWLEDGMENTS
DATA AVAILABILITY STATEMENT
The authors thank David I. Oviedo-Solís for his help in preparing
The raw data supporting the conclusions of this article will be the results figures.
made available by the authors, without undue reservation.
SUPPLEMENTARY MATERIAL
ETHICS STATEMENT
The Supplementary Material for this article can be found
The studies involving human participants were reviewed and online at: https://www.frontiersin.org/articles/10.3389/fnut.2022.
approved by Comité de Investigación del Instituto Nacional de 737432/full#supplementary-material
REFERENCES 8. Monteiro CA, Levy RB, Claro RM, de Castro IRR, Cannon G.
Increasing consumption of ultra-processed foods and likely impact
1. Rauber F, da Costa Louzada ML, Steele E, Millett C, Monteiro CA, Levy RB. on human health: evidence from Brazil. Public Health Nutr. (2010)
Ultra-Processed food consumption and chronic non-communicable diseases- 14:5–13. doi: 10.1017/S1368980010003241
related dietary nutrient profile in the UK (2008–2014). Nutrients. (2018) 9. Moubarac J-C, Martins APB, Claro RM, Levy RB, Cannon G, Monteiro
10:587. doi: 10.3390/nu10050587 CA. Consumption of ultra-processed foods and likely impact on human
2. Cediel G, Reyes M, da Costa Louzada ML, Martinez Steele E, health. Evidence from Canada. Public Health Nutr. (2013) 16:2240–
Monteiro CA, Corvalán C, et al. Ultra-processed foods and added 8. doi: 10.1017/S1368980012005009
sugars in the Chilean diet (2010). Public Health Nutr. (2018) 10. Julia C, Martinez L, Allès B, Touvier M, Hercberg S, Méjean C,
21:125–133. doi: 10.1017/S1368980017001161 et al. Contribution of ultra-processed foods in the diet of adults from
3. Marrón-Ponce JA, Flores M, Cediel G, Monteiro CA, Batis C. Associations the French NutriNet-Santé study. Public Health Nutr. (2018) 21:27–
between consumption of ultra-processed foods and intake of nutrients related 37. doi: 10.1017/S1368980017001367
to chronic non-communicable diseases in Mexico. J Acad Nutr Diet. (2019) 11. Moubarac JC, Batal M, Louzada ML, Martinez Steele E, Monteiro CA.
119:1852–65. doi: 10.1016/j.jand.2019.04.020 Consumption of ultra-processed foods predicts diet quality in Canada.
4. Hall KD, Ayuketah A, Brychta R, Cai H, Cassimatis T, Chen KY, et al. Ultra- Appetite. (2017) 108:512–20. doi: 10.1016/j.appet.2016.11.006
processed diets cause excess calorie intake and weight gain: An inpatient 12. Martínez Steele E, Popkin BM, Swinburn B, Monteiro CA. The share of ultra-
randomized controlled trial of Ad libitum food intake. Cell Metab. (2019) processed foods and the overall nutritional quality of diets in the US: evidence
30:67–77.e3. doi: 10.1016/j.cmet.2019.05.008 from a nationally representative cross-sectional study. Popul Health Metr.
5. Louzada ML da C, Martins APB, Canella DS, Baraldi LG, (2017) 15:6. doi: 10.1186/s12963-017-0119-3
Levy RB, Claro RM, et al. Impact of ultra-processed foods on 13. Monteiro CA, Cannon G, Levy RB, Moubarac J-C, Louzada ML, Rauber
micronutrient content in the Brazilian diet. Rev Saude Publica. (2015) F, et al. Ultra-processed foods: what they are and how to identify
49:1–8. doi: 10.1590/S0034-8910.2015049006211 them. Public Health Nutr. (2019) 22:936–941. doi: 10.1017/S136898001800
6. Louzada ML da C, Martins APB, Canella DS, Baraldi LG, Levy RB, Claro 3762
RM, et al. Ultra-processed foods and the nutritional dietary profile in 14. Elizabeth L, Machado P, Zinöcker M, Baker P, Lawrence M. Ultra-
Brazil. Rev Saude Publica. (2015) 49. doi: 10.1590/S0034-8910.20150490 Processed foods and health outcomes: a narrative review. Nutrients. (2020)
06132 12:1955. doi: 10.3390/nu12071955
7. Louzada MLC, Ricardo CZ, Steele EM, Levy RB, Cannon G, Monteiro 15. Lane MM, Davis JA, Beattie S, Gómez-Donoso C, Loughman A, O’Neil
CA. The share of ultra-processed foods determines the overall A, et al. Ultraprocessed food and chronic noncommunicable diseases: a
nutritional quality of diets in Brazil. Public Health Nutr. (2018) systematic review and meta-analysis of 43 observational studies. Obes Rev.
21:94–102. doi: 10.1017/S1368980017001434 (2021) 22:1–19. doi: 10.1111/obr.13146
Frontiers in Nutrition | www.frontiersin.org 9 February 2022 | Volume 9 | Article 737432Oviedo-Solís et al. SFFQ and NOVA Food Classification
16. Silva Meneguelli T, Viana Hinkelmann J, Hermsdorff HHM, Zulet MÁ, 33. Frankenfield D, Roth-Yousey L, Compher C. Comparison of
Martínez JA, Bressan J. Food consumption by degree of processing and predictive equations for resting metabolic rate in healthy nonobese
cardiometabolic risk: a systematic review. Int J Food Sci Nutr. (2020) 71:678– and obese adults: a systematic review. J Am Diet Assoc. (2005)
92. doi: 10.1080/09637486.2020.1725961 105:775–89. doi: 10.1016/j.jada.2005.02.005
17. Fangupo LJ, Haszard JJ, Leong C, Heath A-LM, Fleming EA, Taylor RW. 34. Landis JR, Koch GG. The measurement of observer agreement for categorical
Relative validity and reproducibility of a food frequency questionnaire to data. Biometrics. (1977) 33:159. doi: 10.2307/2529310
assess energy intake from minimally processed and ultra-processed foods in 35. Sierra-Ruelas É, Bernal-Orozco MF, MacEdo-Ojeda G, Márquez-Sandoval
young children. Nutrients. (2019) 11:1290. doi: 10.3390/nu11061290 YF, Altamirano-Martínez MB, Vizmanos B. Validation of semiquantitative
18. Willet W, Lenart E. Reproducibility and validity of food frequency FFQ administered to adults: a systematic review. Public Health Nutr. (2020)
questionnaires. In: Nutritional Epidemiology. Oxford University Press (2013). 24:3399–418. doi: 10.1017/S1368980020001834
19. López-Ridaura R. Metodología y validez del cuestionario de frencuencia de 36. Willett W. Nutritional Epidemiology. Oxford University Press
consumo utilizado en la ensanut 2012 de México. Salud Publica Mex. (2016) (2012). doi: 10.1093/acprof:oso/9780199754038.001.0001
58:602. doi: 10.21149/spm.58i6.8398 37. Biró G, Hulshof K, Ovesen L, Amorim Cruz J. Selection of
20. FAO. Guidelines on the Collection of Information on Food Processing Through methodology to assess food intake. Eur J Clin Nutr. (2002) 56:S259632.
Food Consumption Surveys. Rome: FAO (2015). doi: 10.1038/sj.ejcn.1601426
21. Hernández-Avila M, Romieu I, Parra S, Henández-Avila J, Madrigal H, Willet 38. Leblanc V, Bégin C, Corneau L, Dodin S, Lemieux S. Gender differences
W. Validity and reproducibility of a food frequency questionnaire to assess in dietary intakes: WHAT is the contribution of motivational
dietary intake of women living in Mexico City. Salud Publica Mex. (1998) variables? J Hum Nutr Diet. (2015) 28:37–46. doi: 10.1111/jhn.
40:133–40. doi: 10.1590/S0036-36341998000200005 12213
22. Rodríguez-Ramírez S, Mundo-Rosas V, Jiménez-Aguilar A, Shamah-Levy T. 39. de Vries JHM, de Groot LCPGM, van Staveren WA. Dietary assessment in
Methodology for the analysis of dietary data from the Mexican national elderly people: experiences gained from studies in the Netherlands. Eur J Clin
health and nutrition survey 2006. Salud Publica Mex. (2009) 51:S523– Nutr. (2009) 63:S69–74. doi: 10.1038/ejcn.2008.68
9. doi: 10.1590/S0036-36342009001000007 40. McNeill G, Winter J, Jia X. Diet and cognitive function in later life:
23. Rivera JA, Irizarry LM, de Cossío TG. Overview of the nutritional status of a challenge for nutrition epidemiology. Eur J Clin Nutr. (2009) 63:S33–
the Mexican population in the last two decades. Salud Publica Mex. (2009) 7. doi: 10.1038/ejcn.2008.62
51:S645–56. doi: 10.1590/S0036-36342009001000020 41. Oviedo-Solís CI, Monterrubio-Flores EA, Cediel G, Denova-Gutiérrez
24. Morales Ruán MC, Valenzuela Bravo DG, Jiménez Aguilar A, Cuevas E, Barquera S. Relative validity of a semi-quantitative food frequency
Nasu L, Méndez Gómez Humarán I, Shamah Levy T. Diversidad de questionnaire to estimate dietary intake according to the NOVA
la dieta en mujeres que habitan en inseguridad alimentaria en México, classification in Mexican children and adolescents. J Acad Nutr Diet.
beneficiarias de un programa de ayuda alimentaria. Nutr Hosp. (2018) 35:408– (2021). doi: 10.1016/j.jand.2021.11.002
15. doi: 10.20960/nh.1620 42. De la Cruz-Góngora V, Martínez-Tapia B, Cuevas-Nasu L, Flores-
25. Ramírez-Silva I, Jiménez-Aguilar A, Valenzuela-Bravo D, Martinez-Tapia B, Aldana M, Shamah-Levy T. Dietary intake and adequacy of energy
Rodríguez-Ramírez S, Gaona-Pineda EB, et al. Methodology for estimating and nutrients in Mexican older adults: results from two national health
dietary data from the semi-quantitative food frequency questionnaire of the and nutrition surveys. Salud Publica Mex. (2017) 59:285. doi: 10.2114
Mexican national health and nutrition survey 2012. Salud Publica Mex. (2016) 9/7851
58:629. doi: 10.21149/spm.v58i6.7974 43. Thompson FE, Subar AF. Dietary assessment methodology. In: Coulston AM,
26. Denova-Gutiérrez E, Ramírez-Silva I, Rodríguez-Ramírez S, Jiménez-Aguilar Boushey CJ, Ferruzzi MG. Nutrition in the Prevention Treatment of Disease.
A, Shamah-Levy T, Rivera-Dommarco JA. Validity of a food frequency Elsevier, 5–46. doi: 10.1016/B978-0-12-391884-0.00001-9
questionnaire to assess food intake in Mexican adolescent and adult 44. FAO. Dietary Assessment: A Resource Guide to Method Selection and
population. Salud Publica Mex. (2016) 58:617. doi: 10.21149/spm.v58i6.7862 Application in Low Resource Settings. Rome: FAO (2018).
27. Denova-Gutiérrez E, Tucker KL, Salmerón J, Flores M, Barquera S. 45. Pan American Health Organization. Front-of-Package Labeling as a Policy Tool
Relative validity of a food frequency questionnaire to identify dietary for the Prevention of Noncommunicable Diseases in the Americas. Washington,
patterns in an adult Mexican population. Salud Publica Mex. (2016) DC: Pan American Health Organization (2020).
58:608. doi: 10.21149/spm.v58i6.7842
28. Romero-Martínez M, Shamah-Levy T, Franco-Núñez A. Encuesta nacional Conflict of Interest: The authors declare that the research was conducted in the
de salud y nutrición 2012:diseño y cobertura. Salud Publica Mex. (2013) absence of any commercial or financial relationships that could be construed as a
55:332. doi: 10.21149/spm.v55s2.5132 potential conflict of interest.
29. Instituto Nacional de Salud Publica. Base de datos de valor nutritivo de
los alimentos. [National Institute of Public Health. Food Composition Table.] Publisher’s Note: All claims expressed in this article are solely those of the authors
Compilación del Instituto Nacional de Salud Publica. Cuernavaca: National and do not necessarily represent those of their affiliated organizations, or those of
Institute of Public Health (Un Published).
the publisher, the editors and the reviewers. Any product that may be evaluated in
30. Ramírez-silva I, Rodríguez-ramírez S, Barragán-vázquez S, Castellanos A.
this article, or claim that may be made by its manufacturer, is not guaranteed or
Prevalence of inadequate intake of vitamins and minerals in the Mexican
population , by nutrient retention factors, Ensanut 2016. Salud Publica Mex. endorsed by the publisher.
(2020) 62:521–31. doi: 10.21149/11096
31. López-Olmedo N, Carriquiry AL, Rodríguez-Ramírez S, Ramírez-Silva I, Copyright © 2022 Oviedo-Solís, Monterrubio-Flores, Rodríguez-Ramírez, Cediel,
Espinosa-Montero J, Hernández-Barrera L, et al. Usual intake of added sugars Denova-Gutiérrez and Barquera. This is an open-access article distributed under the
and saturated fats is high while dietary fiber is low in the Mexican population. terms of the Creative Commons Attribution License (CC BY). The use, distribution
J Nutr. (2016) 146:1856S−65S. doi: 10.3945/jn.115.218214 or reproduction in other forums is permitted, provided the original author(s) and
32. Institute of Medicine. Dietary Reference Intakes for Energy, Carbohydrate, the copyright owner(s) are credited and that the original publication in this journal
Fiber, Fat, Fatty Acids, Cholesterol, Protein, and Amino Acids. Washington, is cited, in accordance with accepted academic practice. No use, distribution or
D.C.: National Academies Press (2005). doi: 10.17226/10490 reproduction is permitted which does not comply with these terms.
Frontiers in Nutrition | www.frontiersin.org 10 February 2022 | Volume 9 | Article 737432You can also read