A Rental Housing Needs Analysis for the City of Albert Lea, Minnesota - City of Albert Lea
←
→
Page content transcription
If your browser does not render page correctly, please read the page content below
A Rental Housing Needs Analysis for the
                City of Albert Lea, Minnesota

Prepared for:
City of Albert Lea
Albert Lea, MN

March 2021

                                           2823 Hamline Ave North
                                           Roseville, MN 55113
                                           612.338.0012
                                           www.maxfieldresearch.com
April 1 2021

Ms. Megan Boeck
City Planner
City of Albert Lea
221 E Clark Street
Albert Lea, MN 56007

Ms. Boeck:

Attached is the market report titled, “A Rental Housing Needs Analysis for the City of Albert Lea,
Minnesota.” The Needs Analysis examines current general occupancy rental housing market
conditions and provides detailed recommendations for rental housing types identified as
needed in the short and long-term.

The scope of this study includes: an analysis of the demographic and economic characteristics
of the City compared to the surrounding Market Area; a review of the existing rental housing
stock and its characteristics; an evaluation of rental market conditions in the City and surround-
ing area; calculation of demand for general occupancy rental housing and an assessment of
housing affordability. Recommendations on the number and types of rental housing products
that should be considered in the City are also supplied.

Please contact us if you have questions or require additional information.

Sincerely,

MAXFIELD RESEARCH AND CONSULTING, LLC

Mary C Bujold                                           Brian Smith
President                                               Senior Associate

Attachment

                                (main) 612-338-0012 (fax) 612-904-7979
                             2823 Hamline Avenue North, Roseville, MN 55113
                                       www.maxfieldresearch.com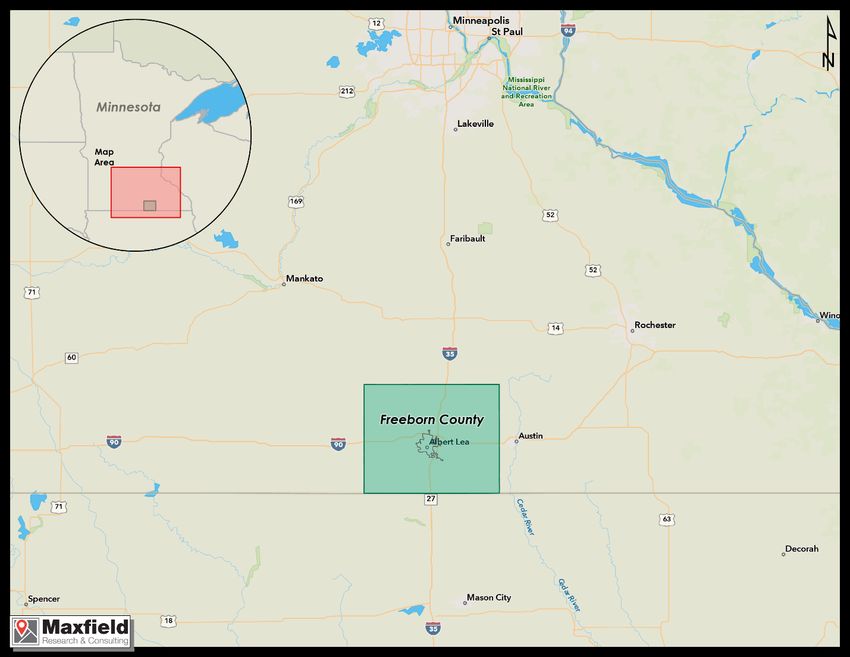
TABLE OF CONTENTS

Title                                                                                                                                 Page

EXECUTIVE SUMMARY ................................................................................................                      1

PURPOSE AND SCOPE OF STUDY .................................................................................                            5

DEMOGRAPHIC ANALYSIS ...........................................................................................                        6
  Introduction ...................................................................................................................      6
  Market Area Definition ..................................................................................................             6
  Population and Household Growth Trends ...................................................................                            7
  Age Distribution .............................................................................................................        9
  Household Income .........................................................................................................           12
  Household Tenure by Income ........................................................................................                  15
  Household Tenure by Age ..............................................................................................               17
  Tenure by Household Size..............................................................................................               20
  Household Type .............................................................................................................         23

EMPLOYMENT TRENDS ...............................................................................................                      24
  Introduction ...................................................................................................................     24
  Resident Employment ....................................................................................................             24
  Commuting Patterns ......................................................................................................            27
  Employment Growth Trends..........................................................................................                   30
  Industry Employment and Wage Data ...........................................................................                        31
  Major Employers ............................................................................................................         34
  Employer Survey ............................................................................................................         35

HOUSING CHARACTERISTICS .......................................................................................                        38
  Introduction ...................................................................................................................     38
  Housing Unit Occupancy ................................................................................................              38
  Housing Stock by Structure Type ...................................................................................                  41
  Age of Housing Stock                      ......................................................................................     43
  Residential Construction Trends ....................................................................................                 44
  Renter-Occupied Units by Contract Rent ......................................................................                        46

RENTAL MARKET ANALYSIS.........................................................................................                        47
   Introduction ...................................................................................................................    47
   Overview of Rental Market Conditions .........................................................................                      47
   General Occupancy Rental Housing Projects.................................................................                          52
   Pending Rental Developments.......................................................................................                  60

TABLE OF CONTENTS
                                                              (continued)

Title                                                                                                                                Page

HOUSING AFFORDABILITY ..........................................................................................                      62
  Introduction ...................................................................................................................    62
  Rent and Income Limits .................................................................................................            63
  Housing Cost Burden......................................................................................................           64
  Housing Costs as Percentage of Household Income .....................................................                               66
  Naturally Occurring Affordable Housing (NOAH) ..........................................................                            67

DEMAND ANALYSIS ...................................................................................................                   69
  Introduction ...................................................................................................................    69
  Rental Housing Demand Analysis ..................................................................................                   69

CONCLUSIONS & RECOMMENDATIONS ......................................................................                                  72
  Introduction ...................................................................................................................    72
  Housing Demand Summary ...........................................................................................                  73
  General Occupancy Rental Housing Recommendations ...............................................                                    74
LIST OF TABLES
Table Number and Title Page
Demographic Analysis
D-1 Population and Household Growth Trends and Projections,
Albert Lea Market Area, 1990 to 2030 ...................................................................... 8
D-2 Population Age Distribution, Albert Lea Market Area, 2000-2025 ........................... 11
D-3 Household Income by Age of Householder, City of Albert Lea, 2020 & 2025........... 14
D-4 Household Income by Age of Householder, Albert Lea Market Area, 2020 & 2025 . 15
D-5 Household Tenure by Income, Albert Lea Market Area, 2020 .................................. 16
D-6 Tenure by Age of Householder, Albert Lea Market Area, 2010 & 2020 .................... 18
D-7 Tenure by Household Size, Albert Lea Market Area, 2010 & 2020 ........................... 21
D-8 Household Type, Albert Lea Market Area, 2010 & 2020 ........................................... 24
Employment Trends
E-1 Labor Force and Resident Employment Trends, Albert Lea Market Area,
2008 though 2020 ...................................................................................................... 25
E-2 Commuting Inflow/Outflow Characteristics, City of Albert Lea, 2018 ...................... 29
E-3 Commuting Patterns, City of Albert Lea, 2018 .......................................................... 30
E-4 Employment Growth Trends and Projections, Albert Lea Market Area, 2000 to 2030 31
E-5 Quarterly Census of Employment and Wages, Albert Lea Market Area,
Q3 2019 – Q3 2020 .................................................................................................... 34
E-6 Major Employers, City of Albert Lea, March 2021..................................................... 36
Housing Characteristics
HC-1 Housing Unit Occupancy, Albert Lea Market Area, 2020 .......................................... 39
HC-2 Housing Units by Structure Type and Tenure, Albert Lea Market Area, 2020 .......... 41
HC-3 Housing Units by Year Structure Built, Albert Lea Market Area, 2020 ...................... 42
HC-4 Residential Building Permit Trends, City of Albert Lea, 2010 - 2020 ......................... 43
HC-5 Renter-Occupied Housing Units by Contract Rent, Albert Lea Market Area, 2020... 46
Rental Market Analysis
RM-1 Rental Housing Vacancy & Rent Estimates, City of Albert Lea .................................. 49
RM-2 Bedrooms by Gross Rent, Renter-Occupied Housing Units,
Albert Lea Market Area, 2020.................................................................................... 50
RM-3 Unit Type Summary, Affordable/Subsidized Rental Developments,
Albert Lea Market Area, March 2021 ........................................................................ 53
RM-4 Unit Type Summary, Market Rate Rental Developments, Albert Lea Market Area,
March 2021 ................................................................................................................ 55
RM-5 General Occupancy Rental Properties, Freeborn County, February 2021 ................ 56
RM-6 Pending General Occupancy Rental Developments, City of Albert Lea, February 2021 60LIST OF TABLES
(continued)
Table Number and Title Page
Housing Affordability
HA-1 2020 Income Limits and Maximum Gross Rents, Freeborn County,
Effective Date: 04/01/2020........................................................................................ 63
HA-2 Maximum Rent Based on Household Size and Area Median Income,
Freeborn County - 2020 ............................................................................................. 64
HA-3 Housing Cost Burden, Albert Lea Market Area, 2020 ................................................ 65
HA-4 Housing Affordability – Based on Household Income, Albert Lea Market Area,
March 2021 ................................................................................................................ 66
HA-5 Assessment of Market Rate Rental Housing by Affordability, Albert Lea Market Area,
March 2021 ................................................................................................................ 68
Demand Analysis
D-1 Demand for General Occupancy Rental Housing, City of Albert Lea, 2020 to 2030 . 70
Conclusions and Recommendations
CR-1 Recommended Rental Housing Development, City of Albert Lea, 2020 to 2030 ..... 76EXECUTIVE SUMMARY
Purpose and Scope of Study
Maxfield Research and Consulting, LLC was engaged by the City of Albert Lea, Minnesota to pre-
pare a Rental Housing Needs Analysis. The Needs Analysis examines current rental housing
market conditions and provides detailed recommendations for rental housing types identified
as needed in the short and long-term.
The scope of this study includes: an analysis of the demographic and economic characteristics
of the City compared to the surrounding Market Area; a review of the existing rental housing
stock and its characteristics; an evaluation of rental market conditions in the City and surround-
ing area; demand calculations for general occupancy rental housing and an assessment of hous-
ing affordability. Recommendations on the number and types of rental housing products that
should be considered for development are also supplied.
Demographic Analysis
• As of 2010, Albert Lea had 18,016 people and 7,774 households. It is estimated that the
City’s population contracted by 1% between 2010 and 2020 to 17,840, while the number of
households decreased 0.5% to 7,710.
• Between 2020 and 2030, Albert Lea’s population is projected to decline by another 140
people (-1%) and 30 households (-0.4%).
• In 2020, the largest adult cohort by age in Albert Lea is estimated to be the 55 to 64 group,
totaling an estimated 2,367 people (13% of the population), followed by the 75 and older
age group with an estimated 2,231 people (12%).
• Although growth is not projected for Albert Lea overall, growth is expected to occur among
older adults in Albert Lea. Aging of baby boomers led to an increase of 359 people (9%) in
the 65 and older population in Albert Lea between 2010 and 2020. By 2025, the 65 and
older age group is project to grow by another 7.5% (290 people).
• In 2020, the median household income was estimated at $44,210 in Albert Lea. Based on
the overall median household income, a household could afford rents of $1,105, allocating
30% of their income on housing.
• An estimated 58% of households under age 25 rent in Albert Lea. The percentage of renters
declines with age as 52% of the 25 to 34 age group rents, 36% of those ages 35 to 44 and
21% of those in the 45 to 54 age group.
• In 2020, an estimated 32% of households in Albert Lea were single-person households while
37% were two-person households. An estimated 11.5% were three-person and another
11% were four-person households. Five-, six- and seven-person households represented 7%
of all households in the City.
MAXFIELD RESEARCH AND CONSULTING, LLC 1EXECUTIVE SUMMARY
Employment Analysis
• Due to job losses related to the COVID-19 pandemic, unemployment rates increased dra-
matically in the Market Area in the first half of 2020, climbing to 9.1% in Albert Lea in May
2020 and 5.7% in 2020 overall. Albert Lea has followed a similar pattern as the SE Minne-
sota economic region and the State of Minnesota.
• An estimated 37% of the jobs in Albert Lea are filled by workers commuting into the City.
The highest proportion of workers coming into the City are aged 30 to 54 and earn more
than $3,333 per month ($40,000 per year). The “All Other Services” sector brings in most of
the employees (47%).
• An estimated 4,949 workers come into Albert Lea for employment (inflow) daily, while
3,908 resident workers commute out of the City (outflow). An estimated 5,193 people live
and work in the City (interior flow).
• An estimated 61% of employees who work in Albert Lea commute less than 10 miles while
18% commute 10 to 24 miles. There is 14% of the job force that travel over 50 miles and
another 7% 25 to 50 miles.
• The MN Department of Employment and Economic Development (MN DEED) identified Edu-
cation & Health Services as the largest employment sector in Albert Lea (25% of total jobs)
in Q3 2020. Trade, Transportation, & Utilities and Manufacturing sectors follow close be-
hind representing 24% and 23% of total employment, respectively.
• Average weekly wages in Albert Lea were $841 in Q3 2020. A household earning the aver-
age weekly wage in the City of Albert Lea should be able to afford an apartment renting for
an estimated $1,093 per month to not exceed 30% of its monthly income on housing costs,
significantly higher than the average rent for existing market rate rental properties in the
PMA ($675).
Housing Characteristics
• A total of 152 residential housing units were permitted in Albert Lea from 2010 through
2020, averaging 15 new units per year.
• An estimated 43% of the housing permitted units since 2010 were for detached single-fam-
ily homes (66 units), while 28% were for townhome units (42 units) and nearly 29% were for
multifamily units (44 units).
• As of 2020, it was estimated that 28% of occupied housing units were renter households.
One-unit, detached (single-family) homes accounted for the largest number of occupied
rental units at 10% followed by units in buildings with 20 or more units (9%).
MAXFIELD RESEARCH AND CONSULTING, LLC 2EXECUTIVE SUMMARY
• Albert Lea’s housing stock is aging as over half the housing units were built prior to 1960.
Another 25% were built from 1970 to 1980. Therefore, an estimated 80% of the housing
units are 40 years or older.
• An estimated 73% of rental units in Albert Lea have median monthly contract rents ranging
from $250 to $749. Only 9% of rental units have rents of more than $1,000.
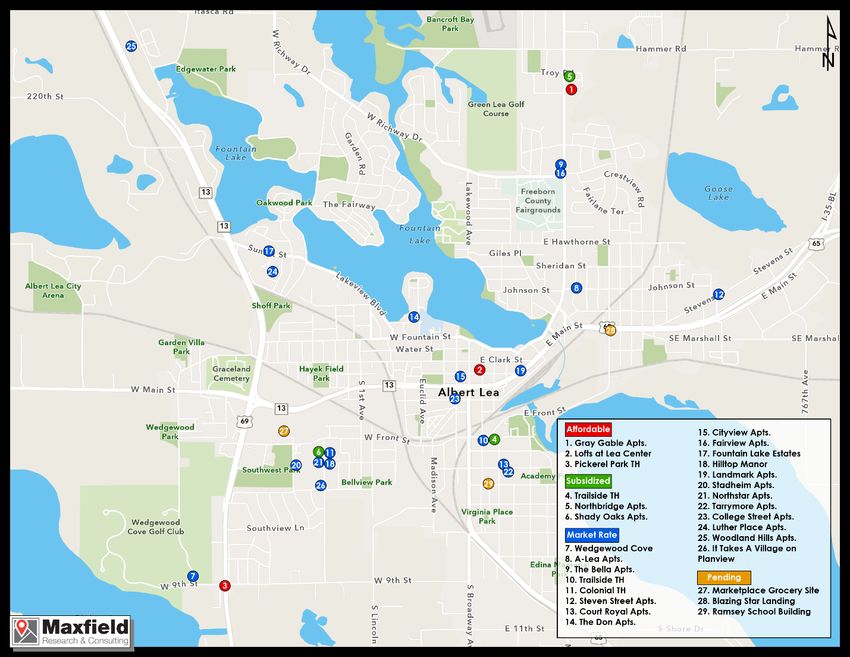
Rental Housing Market Analysis
• Maxfield Research compiled detailed information for general occupancy rental housing
properties in Albert Lea and Freeborn County, including three shallow-subsidy (affordable)
properties, eight deep-subsidy (subsidized) properties and 21 market rate properties. These
properties represent 106 shallow-subsidy units, 292 deep-subsidy units and 444 market rate
units.
• The inventory of rental properties in the PMA was 1.9% vacant as of March 2021, including
a 0% vacancy rate among the affordable properties, 3.1% among the subsidized properties
and a 1.6% vacancy rate in the market rate properties. The equilibrium vacancy rate for
rental housing is considered to be 5.0%, which allows for normal turnover and an adequate
supply of alternatives for prospective renters. The vacancy rates identified indicate that
there is a substantial need for additional rental housing in Albert Lea and that the market
appears exceptionally tight.
• The average rental rate across all market rate general occupancy properties is $675 per
month, with one-bedroom units averaging $545 per month; two-bedroom units averaging
$781 per month and three-bedroom units averaging $849 per month. On a per square-foot
basis, the general occupancy market rate properties have an average rent of $0.97 per
square foot.
• There were two rental developments under construction at the time of the survey. The
Marketplace grocery site is being developed into 50 market rate rental units and the former
Ramsey School Building into 12 market rate units. Two additional developments are
planned. Blazing Star Landing is planning 48 units with 38 market rate and 10 affordable
units and the former VFW building is planned to be redeveloped into 21 market rate rental
units.
Housing Affordability
• An estimated 44% of all renter households in Albert Lea pay more than 30% of their income
on housing which is on par with Minnesota at 44%.
• The number of cost burdened households increases proportionally based on lower incomes.
In Albert Lea, an estimated 70% of renters with incomes below $35,000 are cost burdened.
MAXFIELD RESEARCH AND CONSULTING, LLC 3EXECUTIVE SUMMARY
These percentages are lower than in Minnesota, where 74% of renter households and 50%
of owner households, respectively, are cost burdened.
Housing Demand Analysis
• Maxfield Research calculated the following general occupancy rental housing demand for
Albert Lea between 2020 and 2030. All rental units currently under construction were
taken into consideration in the demand calculation.
o Market rate rental 160 units
o Shallow subsidy rental 118 units
o Deep subsidy rental 42 units
Conclusions and Recommendations
• Based on the finding of the analysis, the following charts summarize the recommended de-
velopment concepts by product type for Albert Lea to 2030. Detailed findings are described
in the Conclusions & Recommendations section of this report.
• There are 121 units in the development process in Albert Lea. Of which, 62 market rate
units are under construction and another 69 units have been approved. If all of these units
are developed by 2022, they will satisfy some of the projected demand through 2030 in the
short term.
RECOMMENDED RENTAL HOUSING DEVELOPMENT
CITY OF ALBERT LEA
2020 to 2030
Monthly No. of Development
Rent Range¹ Units Timing
Market Rate Rental Housing
Townhome-style $1,100/2BR - $1,300/3BR 30 - 40 2021+
Apartment-style $900/1BR - $1,200/3BR 40 - 50 2023+
Apartment-style $900/1BR - $1,200/3BR 40 - 50 2023+
Affordable Rental Housing
Apartment-style Moderate Income2 35 - 40 2021+
1BR/2BR/3BR
Townhome-style Moderate Income2 25 - 35 2021+
2BR/3BR/4BR
¹ Pricing in 2021 dollars. Pricing can be adjusted to account for inflation. Pricing is an estimate of what the
current rental market could absorb.
2
Affordablity subject to income guidelines per US Department of Housing and Urban Development (HUD)
Note - Recommended development concepts represent a hypothetical potential project and do
not necessarily reflect total calculated demand
Source: Maxfield Research & Consulting, LLC
MAXFIELD RESEARCH AND CONSULTING, LLC 4PURPOSE AND SCOPE Purpose and Scope of Study Maxfield Research and Consulting, LLC was engaged by the City of Albert Lea, Minnesota to pre- pare a Rental Housing Needs Analysis. The Needs Analysis provides recommendations on the amount and types of general occupancy rental housing that may be developed to meet the needs of current and future households residing in the City. The scope of this study includes: an analysis of the demographic and economic characteristics of the City compared to the surrounding Market Area; a review of the existing rental housing stock and its characteristics; an evaluation of rental market conditions in the City and surround- ing area; calculations of demand and an assessment of housing affordability. Recommenda- tions on the number and types of rental housing products that should be considered in the City are also supplied. MAXFIELD RESEARCH AND CONSULTING, LLC 5
DEMOGRAPHIC ANALYSIS

Introduction

Demographic characteristics and trends are important factors when evaluating housing needs
in any given market. This section of the report examines the demographic and economic char-
acteristics of Albert Lea and the surrounding Market Area. A review of these characteristics
provides insight into the demand for various types and styles of rental housing in the City.

General occupancy rental housing demand in Albert Lea is expected to be driven primarily by
demand and supply in the City. A portion of the housing demand, however, will be generated
from outside the City, so comparisons are made to Freeborn County and the Southeast Eco-
nomic Development Region. The “Albert Lea Market Area,” which is referenced throughout the
study, consists of Freeborn County.

The following map illustrate Albert Lea’s location in the Market Area and its location in the re-
gion.

                                     Regional Location Map

MAXFIELD RESEARCH AND CONSULTING, LLC                                                               6
DEMOGRAPHIC ANALYSIS
Population and Household Growth Trends
Table D-1 on the following page presents population and household growth trends in the Mar-
ket Area from 1990 to 2030. The 1990, 2000, and 2010 figures are from the U.S. Census. The
2020 population and household estimates for Albert Lea, the Albert Lea Market Area (Freeborn
County) and the Remainder of the Market Area are provided by ESRI Inc. (a nationally recog-
nized demographics firm). Estimates for 2020 and projections to 2030 are based on infor-
mation from ESRI (a national demographics service provider) and the Minnesota State Demog-
rapher and adjusted by Maxfield Research and Consulting, LLC.
• As depicted in the following graph, Albert Lea’s population grew from 1900 to 1970, but de-
clined between 1970 and 1990 before increasing slightly during the 1990s. Population then
fell again by 2010 and is estimated and projected to continue to decline through 2030. The
largest population increase occurred from 1950 to 1960 when the population increased by
3,563 people (26% growth).
Albert Lea Population Growth
1900 - 2030
25,000
19,418 19,200
20,000 18,310 18,016 17,700
17,108
13,545 18,356
Population
15,000 17,886
12,200
10,169
10,000 8,056
6,192
4,500
5,000
0
• As of 2010, Albert Lea had 18,016 people and 7,774 households in which the City’s popula-
tion contracted 2% and households fell by less than 1%. We estimate that the City’s popula-
tion decreased by 1% between 2010 and 2020 to 17,886, while the number of households
decreased by 0.5% to 7,736.
• The average household size in Albert Lea decreased from 2.43 persons per household in
1990 to 2.32 in 2010. The trend appears to be stabilizing as the Millennial generation en-
ters their prime child-bearing years as the estimated household size declined to 2.31 in
2020 and down to 2.30 by 2030.
MAXFIELD RESEARCH AND CONSULTING, LLC 7DEMOGRAPHIC ANALYSIS
TABLE D-1
POPULATION AND HOUSEHOLD GROWTH TRENDS AND PROJECTIONS
ALBERT LEA MARKET AREA
1990 to 2030
Population
City of Freeborn County
Albert Lea Remainder of PMA (PMA)
1990 18,310 14,750 33,060
2000 18,356 14,228 32,584
2010 18,016 13,239 31,255
2020 Estimate 17,886 12,836 30,722
2025 Forecast 17,840 12,560 30,400
2030 Forecast 17,700 12,200 29,900
Change No. Pct. No. Pct. No. Pct.
1990 - 2000 46 0.3% -522 -3.5% -476 -1.4%
2000 - 2010 -340 -1.9% -989 -7.0% -1,329 -4.1%
2010 - 2020 -130 -0.7% -403 -3.0% -533 -1.7%
2020 - 2025 -46 -0.3% -276 -2.2% -322 -1.0%
2025 - 2030 -140 -0.8% -360 -2.9% -500 -1.6%
Households
City of Freeborn County
Albert Lea Remainder of PMA (PMA)
1990 7,533 5,496 13,029
2000 7,785 5,571 13,356
2010 7,774 5,403 13,177
2020 Estimate 7,736 5,314 13,050
2025 Forecast 7,710 5,290 13,000
2030 Forecast 7,680 5,230 12,910
Change No. Pct. No. Pct. No. Pct.
1990 - 2000 252 3.3% 75 1.4% 327 2.5%
2000 - 2010 -11 -0.1% -168 -3.0% -179 -1.3%
2010 - 2020 -38 -0.5% -89 -1.6% -127 -1.0%
2020 - 2025 -26 -0.3% -24 -0.5% -50 -0.4%
2025 - 2030 -30 -0.4% -60 -1.1% -90 -0.7%
Sources: Minnesota State Demographic Center; Minnesota Department of Employment and
Economic Development (DEED); Maxfield Research & Consulting, LLC
• Over the next decade, Albert Lea is project to continue to lose population and households.
Between 2020 and 2030, Albert Lea is projected to lose 186 people (-1%) and 56 households
(-1%). The decline is likely due to an aging population and a lack of affordable housing pro-
duction to keep pace with job growth.
MAXFIELD RESEARCH AND CONSULTING, LLC 8DEMOGRAPHIC ANALYSIS
• Future household growth in Albert Lea will be highly dependent on the availability of suita-
ble housing options. Growth in population and households will be difficult to realize with-
out the addition of new housing units in the City catering to a variety of household types.
Age Distribution
The age distribution of a community’s population helps in assessing the type of housing
needed. For example, younger and older people are more attracted to higher-density housing
located near urban services and entertainment while middle-aged people (particularly those
with children) traditionally prefer lower-density single-family homes.
Table D-2 presents the age distribution of the Market Area population from 2000 to 2025. In-
formation from 2000 and 2010 is sourced from the U.S. Census. The 2020 estimates and pro-
jections for 2025 were provided by ESRI, with adjustments made by Maxfield Research.
• In 2020, the largest adult cohort by age in Albert Lea is 55 to 64, totaling an estimated 2,367
people (13% of the population), followed by the 75+ age group with an estimated 2,231
people (12.5%). In Freeborn County, the 55 to 64 cohort is the largest age group (15% of
the population) in 2020, followed by 45 to 54 cohort and the 65 to 74 cohort (12%).
• The most rapid growth is estimated to have occurred among older adults in the Market
Area. Aging of baby boomers led to an increase of 374 people (21%) in the 65 to 74 popula-
tion in Albert Lea and 784 people (26%) in the Market Area between 2010 and 2020.
• As this group ages, the 65 and older age cohorts are expected to experience increases in the
next several years. The 75 and older age group which is projected to grow 11% in the Mar-
ket Area adding 376 people while the 65 to 74 age group is projected to expand 381 people
10%) from 2020 to 2025.
• The Market Area is expected to experience declines in most adult age cohorts with the larg-
est decline expected in the 55 to 64 age group between 2020 and 2025, which is projected
to contract 472 people (10%) and 185 people in Albert Lea (-8%).
• The loss projected for this cohort is a result of the comparatively small number of people
who will move into this age group between 2020 and 2025, a phenomenon known as the
“baby bust.” The “baby bust” is often referred to the generation of children born between
1965 and 1980, an era when the United States birthrate dropped sharply.
MAXFIELD RESEARCH AND CONSULTING, LLC 9DEMOGRAPHIC ANALYSIS
• Contraction is also forecast for younger adults in the Market Area between 2020 and 2025,
as the 20 to 34 cohort is projected to decline 9.5% (-476 people). Albert Lea is projected to
experience a decline in the 20 to 34 cohort of 178 people (-6%).
• After estimated growth for the 25 to 34 age cohort (5%) between 2010 and 2020, the PMA
is expected to experience growth in the age 35 to 44 cohort, adding 111 people (3%
growth), as the peak of the “echo boom” moves into this age group.
• Traditionally, this age group has been a target market for entry level and/or move-up own-
ership housing, although a higher proportion of this cohort is now likely to rent their hous-
ing longer than in the past versus shifting over into the for-sale market due to lifestyle and
economic factors.
Projected Population Growth by Age Group: 2020-2025
-1.0
Total -2.2
-0.3
11.0
75+ 16.2
8.3
10.0
65-74 16.7
4.8
-10.3
55-64 -13.0
Age Group
-7.8
-8.7
45-54 -8.3
-9.0
3.3
33-44 0.0
5.8
-8.8
25-34 -14.4 Freeborn County
-5.5
-11.2 Remainder PMA
20-24 -20.2
-6.2
1.0 Albert Lea
U-20 -0.7
2.3
-25.0 -20.0 -15.0 -10.0 -5.0 0.0 5.0 10.0 15.0 20.0
Percent
• Based on age distribution projections for Albert Lea, demand is expected to be strongest for
housing units catering to the senior population and rental housing targeting the 35 to 44
age group.
• Typical housing products sought by households in various age groups include:
- Rental housing targeting the young adult (25 to 34) age group;
- Maintenance-free, single-level housing (ownership or rental) targeting the empty nester
population (55 to 74 age group);
- Entry-level ownership housing for first-time home buyers (age 25 to 34);
- Entry-level and move-up ownership housing for family households (age 35 to 54); and,
- Age-restricted active adult or service-enhanced (i.e. assisted living) housing for seniors.
MAXFIELD RESEARCH AND CONSULTING, LLC 10DEMOGRAPHIC ANALYSIS
TABLE D-2
POPULATION AGE DISTRIBUTION
ALBERT LEA MARKET AREA
2000 - 2025
Change
Census Estimate Projection 2010-2020 2020-2025
Age 2000 2010 2020 2025 No. Pct. No. Pct.
City of Albert Lea
Under-20 4,664 4,293 4,088 4,181 -205 -4.8 93 2.3
20 to 24 1,000 1,007 966 906 -41 -4.1 -59 -6.2
25 to 34 1,998 2,033 2,182 2,063 149 7.3 -119 -5.5
35 to 44 2,518 1,921 1,928 2,040 7 0.4 112 5.8
45 to 54 2,365 2,462 1,969 1,791 -493 -20.0 -177 -9.0
55 to 64 1,893 2,273 2,367 2,182 94 4.1 -185 -7.8
65 to 74 1,675 1,781 2,155 2,259 374 21.0 104 4.8
75+ 2,243 2,246 2,231 2,417 -15 -0.7 186 8.3
Total 18,356 18,016 17,886 17,840 -130 -0.7 -46 -0.3
Remainder of Market Area
Under-20 4,016 3,297 2,860 2,839 -719 -17.9 -21 -0.7
20 to 24 582 529 535 427 -53 -9.1 -108 -20.2
25 to 34 1,437 1,296 1,319 1,129 -141 -9.8 -190 -14.4
35 to 44 2,369 1,574 1,436 1,435 -795 -33.6 -1 0.0
45 to 54 2,070 2,317 1,639 1,503 247 11.9 -137 -8.3
55 to 64 1,516 1,944 2,210 1,923 428 28.2 -287 -13.0
65 to 74 1,197 1,255 1,665 1,942 58 4.8 278 16.7
75+ 1,041 1,027 1,171 1,361 -14 -1.3 189 16.2
Total 14,228 13,239 12,836 12,560 -989 -7.0 -276 -2.2
Freeborn County
Under-20 8,680 7,590 6,948 7,020 -642 -8.5 72 1.0
20 to 24 1,582 1,536 1,501 1,333 -35 -2.3 -167 -11.2
25 to 34 3,435 3,329 3,501 3,192 172 5.2 -309 -8.8
35 to 44 4,887 3,495 3,364 3,475 -131 -3.8 111 3.3
45 to 54 4,435 4,779 3,608 3,294 -1,171 -24.5 -314 -8.7
55 to 64 3,409 4,217 4,577 4,105 360 8.5 -472 -10.3
65 to 74 2,872 3,036 3,820 4,202 784 25.8 381 10.0
75+ 3,284 3,273 3,402 3,778 129 3.9 376 11.0
Total 32,584 31,255 30,722 30,400 -533 -1.7 -322 -1.0
Sources: U.S. Census Bureau; ESRI; Maxfield Research & Consulting, LLC
MAXFIELD RESEARCH AND CONSULTING, LLC 11DEMOGRAPHIC ANALYSIS
Household Income
Household income data helps ascertain the demand for different types of owned and rented
housing based on the size of the market at specific cost levels. In general, housing costs of up
to 30% of income are considered affordable by the Department of Housing and Urban Develop-
ment (HUD). Tables D-3 and Table D-4 present data on household income by age of house-
holder for Albert Lea and the PMA in 2020 and 2025. The information is estimated by ESRI.
Household Income by Age of Householder
The estimated distribution of household incomes in the City of Albert Lea and the Freeborn
County Market Area for 2020 and 2025 are shown in Tables D-3 and D-4. The data was esti-
mated by Maxfield Research based on income trends provided by ESRI. The data helps ascer-
tain the demand for different housing products based on the size of the market at specific cost
levels.
The Department of Housing and Urban Development defines affordable housing costs as 30% of
a household’s adjusted gross income. For example, a household with an income of $40,000 per
year would be able to afford a monthly housing cost of about $1,000. Maxfield Research uti-
lizes a figure of 30% for younger households and 40% or more for seniors, since seniors gener-
ally have lower living expenses and can often sell their homes and use the proceeds toward
rent payments.
• In 2020, the median household income is estimated to be $44,210 in Albert Lea, 44% lower
than $63,816 in the Southeast Development Region and 16% lower than Freeborn County
($51,213) overall.
• By 2025, the median household income is projected to rise slightly by 1% to $44,700 in Al-
bert Lea, compared to 7% growth in the Southeast Development Region and 3% in Freeborn
County. The average annual increase of 0.2% in Albert Lea is much lower than the historical
annual inflation rate of 1.8% over the past ten years.
• As households age through the lifecycle, household incomes tend to peak in their mid-40s
to mid-50s. This trend is evident in the Market Area as the age 45 to 54 cohort has the high-
est estimated income at $54,393 in Albert Lea, compared to $63,697 in Freeborn County for
ages 35 to 44 and $63,816 in the Southeast Development Region (35 to 44 age cohort).
• Rental housing typically targets younger renter households. The median household income
in Albert Lea was estimated at $35,065 for the under-25 age group and $49,062 for the 25
to 34 age group as of 2020. Households earning the median income for these age groups
could afford monthly housing costs based on spending 30% if their income estimated at
$877 and $1,227, respectively.
MAXFIELD RESEARCH AND CONSULTING, LLC 12DEMOGRAPHIC ANALYSIS
2020 Median Household Income by Age of Householder
$90,000
$80,000
$84,697
$83,715
$70,000
$74,351
$60,000
$65,104
$63,816
$63,697
$62,798
$50,000
$56,880
$55,199
$55,003
$54,393
$54,292
$51,213
$49,961
$49,062
$47,544
$40,000
$44,210
$43,942
$37,767
$30,000 $37,376
$35,245
$35,065
$32,632
$30,650
$20,000
$10,000
$-
TotalDEMOGRAPHIC ANALYSIS
• Based on affordability at 60% of AMI and average one-bedroom rents set at $750, house-
holds would need incomes between $30,000 and $35,000 to qualify and afford a one-bed-
room unit. In 2020, an estimated 450 households (6% of the total households) in Albert Lea
have incomes of between $30,000 and $35,000.
• Households with incomes below $15,000 are typically a market for deep-subsidy (i.e. pro-
ject-based Section 8) rental housing. An estimated 13% (1,011 households) of Albert Lea’s
households in 2020 had incomes of less than $15,000.
TABLE D-3
HOUSEHOLD INCOME BY AGE OF HOUSEHOLDER
CITY OF ALBERT LEA
2020 & 2025
Age of Householder
TotalDEMOGRAPHIC ANALYSIS
TABLE D-4
HOUSEHOLD INCOME BY AGE OF HOUSEHOLDER
ALBERT LEA MARKET AREA
2020 & 2025
Age of Householder
TotalDEMOGRAPHIC ANALYSIS
while middle-aged households in their prime earning years typically allocate 20% to 25% of
their income to housing.
• Typically, as income increases, so does the rate of homeownership. This can be seen in Al-
bert Lea where the homeownership rate increases from 42.5% of households with incomes
below $15,000 to 94% of households with incomes above $100,000.
TABLE D-5
TENURE BY HOUSEHOLD INCOME
ALBERT LEA MARKET AREA
2020
Albert Lea Remainder of MA Freeborn County
No. Pct. No. Pct. No. Pct.
Owner Households
Less than $15,000 426 42.5 212 67.0 638 48.4
$15,000 to $24,999 461 52.2 317 78.0 778 60.3
$25,000 to $34,999 500 65.4 353 81.8 853 71.3
$35,000 to $49,999 953 62.5 594 81.2 1,547 68.6
$50,000 to $74,999 1,253 80.4 1,072 91.3 2,325 85.1
$75,000 to $99,999 734 79.8 794 92.0 1,529 85.7
$100,000+ 1,018 94.0 1,318 94.8 2,336 94.4
Subtotal: 5,346 69.1 4,660 87.7 10,006 76.7
Renter Households
Less than $15,000 576 57.5 104 33.0 680 51.6
$15,000 to $24,999 422 47.8 89 22.0 512 39.7
$25,000 to $34,999 264 34.6 79 18.2 343 28.7
$35,000 to $49,999 571 37.5 137 18.8 708 31.4
$50,000 to $74,999 306 19.6 102 8.7 408 14.9
$75,000 to $99,999 186 20.2 69 8.0 255 14.3
$100,000+ 65 6.0 73 5.2 137 5.6
Subtotal: 2,390 30.9 654 12.3 3,044 23.3
Total Households 7,736 100.0 5,314 100.0 13,050 100.0
Sources: U.S. Census Bureau; ESRI; Maxfield Research & Consulting, LLC
• The highest proportion of renter households had incomes less than $15,000 and $35,000 to
$49,999 in Albert Lea, both consisting of 24% of the total renter households. By compari-
son, the highest proportion of renters in the Remainder of Freeborn County had incomes
from $35,000 to $49,999. Households with incomes under $15,000 accounted for 16% of
renter households in the Remainder of the County. Renters with household incomes of
$100,000 or more accounted for only 3% of renter households in Albert Lea but 11% in the
Remainder of the County.
• An estimated 576 households had incomes less than $15,000 and 1,000 renter households
in Albert Lea had incomes less than $25,000 (i.e. the income threshold for one- and two-
person households the target market for deep-subsidy rental housing), which represents an
estimated 24% and 32% of all renter households in the City, respectively.
MAXFIELD RESEARCH AND CONSULTING, LLC 16DEMOGRAPHIC ANALYSIS
Albert Lea Household Tenure by Income
2020
$100,000+ 65
1,018
$75,000 to $99,999 186
734
Household Income
$50,000 to $74,999 306
1,253
$35,000 to $49,999 571
953
$25,000 to $34,999 264
500
$15,000 to $24,999 422
461
Less than $15,000 576
426
- 250 500 750 1,000 1,250 1,500
rent own Households
Household Tenure by Age
Table D-6 shows household tenure by age of householder for the Market Area in 2010 and
2020. Data for 2010 is obtained from the Decennial Census, while the 2020 data is based on
the 2015-2019 American Community Survey and adjusted by Maxfield Research to reflect up-
dated household estimates. The table shows the number and percent of renter- and owner-oc-
cupied households in the Market Area. All data excludes unoccupied units and group quarters
such as dormitories and nursing homes.
Household tenure information is important in understanding households’ preferences to rent
or own their housing. In addition to preferences, factors that contribute to these proportions
include mortgage interest rates, household age and lifestyle considerations, among others.
• In Albert Lea, 69% of all households owned in 2020, giving it a homeownership rate lower
than the Remainder of the Market Area (88%) and Freeborn County (77%).
• Typically, the youngest and oldest households rent their housing in greater proportions than
middle-age households. This pattern is apparent among the younger Market Area house-
holds as 55% of the population under the age of 35 rented in Albert Lea compared to 32% in
the Remainder of the Market Area.
MAXFIELD RESEARCH AND CONSULTING, LLC 17DEMOGRAPHIC ANALYSIS
TABLE D-6
TENURE BY AGE OF HOUSEHOLDER
ALBERT LEA MARKET AREA
2010 & 2020
City of Albert Lea Remainder of Market Area Market Area (Freeborn County)
2010 2020 2010 2020 2010 2020
Age No. Pct. No. Pct. No. Pct. No. Pct. No. Pct. No. Pct.
Under 25 Own 75 21.2 142 41.9 58 42.3 56 50.3 133 27.1 198 44.0
Rent 278 78.8 197 58.1 79 57.7 55 49.7 357 72.9 252 56.0
Total 353 100.0 338 100.0 137 100.0 111 100.0 490 100.0 449 100.0
25-34 Own 535 53.8 589 45.8 448 73.6 407 71.8 983 61.3 996 53.7
Rent 460 46.2 698 54.2 161 26.4 160 28.2 621 38.7 858 46.3
Total 995 100.0 1,286 100.0 609 100.0 567 100.0 1,604 100.0 1,854 100.0
35-44 Own 703 66.4 579 64.2 690 82.0 671 87.0 1,393 73.3 1,250 74.7
Rent 356 33.6 322 35.8 151 18.0 100 13.0 507 26.7 422 25.3
Total 1,059 100.0 901 100.0 841 100.0 771 100.0 1,900 100.0 1,672 100.0
45-54 Own 1,054 74.9 1,069 78.8 1,094 88.9 801 88.4 2,148 81.5 1,870 82.7
Rent 353 25.1 287 21.2 136 11.1 105 11.6 489 18.5 392 17.3
Total 1,407 100.0 1,356 100.0 1,230 100.0 906 100.0 2,637 100.0 2,262 100.0
55-64 Own 1,120 83.1 962 74.9 1,010 92.0 1,223 90.9 2,130 87.1 2,185 83.1
Rent 227 16.9 322 25.1 88 8.0 122 9.1 315 12.9 444 16.9
Total 1,347 100.0 1,284 100.0 1,098 100.0 1,345 100.0 2,445 100.0 2,629 100.0
65 + Own 1,942 74.3 2,006 78.1 1,360 91.4 1,502 93.1 3,302 80.5 3,508 83.9
Rent 671 25.7 564 21.9 128 8.6 111 6.9 799 19.5 675 16.1
Total 2,613 100.0 2,570 100.0 1,488 100.0 1,613 100.0 4,101 100.0 4,183 100.0
TOTAL Own 5,429 69.8 5,346 69.1 4,660 86.2 4,660 87.7 10,089 76.6 10,006 76.7
Rent 2,345 30.2 2,390 30.9 743 13.8 654 12.3 3,088 23.4 3,044 23.3
Total 7,774 100.0 7,736 100.0 5,403 100.0 5,314 100.0 13,177 100.0 13,050 100.0
Sources: U.S. Census Bureau; ESRI; Maxfield Research & Consulting, LLC
MAXFIELD RESEARCH AND CONSULTING, LLC 18DEMOGRAPHIC ANALYSIS
Household Tenure by Age of Householder
Percentage of Renters in 2020
70.0
60.0
50.0
Percent
40.0
30.0
20.0
10.0
0.0
Under
25-34 35-44 45-54 55-64 65+ Total
25
Albert Lea 58.1 54.2 35.8 21.2 25.1 21.9 30.9
PMA 49.7 28.2 13.0 11.6 9.1 6.9 12.3
Freeborn County 56.0 46.3 25.3 17.3 16.9 16.1 23.3
• Renter household growth was estimated to have occurred only among the 25 to 34 and 55
to 64 age groups.
• As depicted in the following chart, the largest overall increase in renter households oc-
curred in 25 to 34 age group in Albert Lea between 2010 and 2020, as 238 renter house-
holds (52% growth) were added.
Household Growth by Age Group and Tenure
City of Albert Lea (2010-2020)
350
300
250
200
150
Households
100
50
0
-50
-100
-150
-200
Under 25 25-34 35-44 45-54 55-64 65+
Rent -81 238 -34 -66 95 -107
Own 67 54 -124 15 -158 64
• Strong renter household growth was also estimated to have occurred in the 55 to 64 age
group, adding 95 renter households (42% growth). Overall, Albert Lea grew by an estimated
45 renter households over the decade, or 2%.
MAXFIELD RESEARCH AND CONSULTING, LLC 19DEMOGRAPHIC ANALYSIS
• The under-25 age group declined by an estimated 81 renter households (-29%) and the 35
to 44 age group also declined by an estimated 34 renter households (-9.5%).
• By comparison, owner households declined overall in Albert Lea, losing an estimated 83
households (-1.5%).
Tenure by Household Size
Table D-7 shows household tenure by size of household in the Market Area during 2010 and
2020 from the U.S. Census and American Community Survey, with adjustments made by
Maxfield Research to reflect updated household estimates. The table shows the number and
percent of renter- and owner-occupied housing units by household size.
Household size for renters tends to be smaller than for owners. This trend is a result of the typ-
ical market segments for rental housing, including households that are younger and less likely
to be married with children, as well as older adults and seniors who choose to downsize from
their single-family homes.
• In 2010, the average renter household in Albert Lea had 2.06 people, while the average
owner household included 2.32 people. By 2020, the average renter household size is esti-
mated to have decreased to 2.04 people and the average owner household size decreased
to 2.30 people.
Household Size by Tenure
2010 & 2020
2.50
2.40
2.30
Persons/HH
2.20
2.10
2.00
1.90
1.80
Albert Lea Albert Lea RemainderRemainder Freeborn Freeborn
Own Rent Own Rent Own Rent
2010 2.32 2.06 2.35 2.07 2.39 2.10
2020 2.30 2.04 2.33 2.05 2.37 2.08
• As depicted in the following table, two-person households were the most common house-
hold size in the Market Area, followed closely by one-person households.
MAXFIELD RESEARCH AND CONSULTING, LLC 20DEMOGRAPHIC ANALYSIS
TABLE D-7
TENURE BY HOUSEHOLD SIZE
ALBERT LEA MARKET AREA
2010 & 2020
CITY OF ALBERT LEA REMAINDER OF MARKET AREA FREEBORN COUNTY
2010 2020 2010 2020 2010 2020
HH Size No. Pct. No. Pct. No. Pct. No. Pct. No. Pct. No. Pct.
1-Person Own 1,480 54.5 1,454 57.4 938 75.3 938 77.7 2,418 61.0 2,392 63.9
Rent 1,235 45.5 1,081 42.6 308 24.7 268 22.3 1,543 39.0 1,349 36.1
Total 2,715 100 2,535 100 1,246 100 1,206 100 3,961 100 3,741 100
2-Person Own 2,314 83.1 2,255 78.6 2,088 91.5 2,225 92.4 4,402 86.8 4,480 84.9
Rent 472 16.9 615 21.4 195 8.5 182 7.6 667 13.2 797 15.1
Total 2,786 100 2,870 100 2,283 100 2,407 100 5,069 100 5,277 100
3-Person Own 708 73.0 604 67.3 655 87.2 664 91.4 1,363 79.2 1,268 78.1
Rent 262 27.0 293 32.7 96 12.8 63 8.6 358 20.8 356 21.9
Total 970 100 897 100 751 100 727 100 1,721 100 1,624 100
4-Person Own 541 75.5 638 74.4 590 89.0 455 86.6 1,131 82.0 1,092 79.0
Rent 176 24.5 220 25.6 73 11.0 70 13.4 249 18.0 290 21.0
Total 717 100 857 100 663 100 525 100 1,380 100 1,382 100
5-Person Own 249 69.6 260 70.2 274 84.6 248 85.9 523 76.7 509 77.1
Rent 109 30.4 111 29.8 50 15.4 41 14.1 159 23.3 151 22.9
Total 358 100 371 100 324 100 289 100 682 100 660 100
6-Person Own 75 60.5 92 56.4 81 84.4 89 83.6 156 70.9 181 67.2
Rent 49 39.5 71 43.6 15 15.6 17 16.4 64 29.1 88 32.8
Total 124 100 163 100 96 100 106 100 220 100 269 100
7-Person Own 62 59.6 43 100.0 34 85.0 42 77.9 96 66.7 85 87.6
Rent 42 40.4 0 0.0 6 15.0 12 22.1 48 33.3 12 12.4
Total 104 100 43 100 40 100 54 100 144 100 97 100
TOTAL Own 5,429 69.8 5,346 69.1 4,660 86.2 4,660 87.7 10,089 76.6 10,006 76.7
Rent 2,345 30.2 2,390 30.9 743 13.8 654 12.3 3,088 23.4 3,044 23.3
Total 7,774 100 7,736 100 5,403 100 5,314 100 13,177 100 13,050 100
Avg. HH Size Own 2.32 2.30 2.35 2.33 2.39 2.37
Rent 2.06 2.04 2.07 2.05 2.10 2.08
Sources: U.S. Census Bureau; ESRI; Maxfield Research & Consulting, LLC
MAXFIELD RESEARCH AND CONSULTING, LLC 21DEMOGRAPHIC ANALYSIS
Household Size Distribution in 2020
Albert Lea Market Area
Freeborn County 29% 40% 12% 11% 5%
Remainder 23% 45% 14% 10% 5%
Albert Lea 33% 37% 12% 11% 5%
0% 20% 40% 60% 80% 100%
1-Person 2-Person 3-Person 4-Person 5-Person 6-Person 7-Person
• Between 2010 and 2020, the largest increase occurred in the number of two-person renter
households, climbing an estimated 30% with the addition of 143 households in Albert Lea.
One-person renter households declined an estimated 12.5% (-154 households).
• Smaller households comprised the largest proportions of renter households in Albert Lea as
of 2020 where an estimated 45% of renter households were singles and 25% were two-per-
son households.
Growth by Household Size and Tenure
Albert Lea (2010-2020)
200
150
100
Households
50
0
-50
-100
-150
-200
1-Person 2-Person 3-Person 4-Person 5-Person 6-Person 7-Person
Rent -154 143 31 44 2 22 -42
Own -26 -59 -104 97 11 17 -19
MAXFIELD RESEARCH AND CONSULTING, LLC 22DEMOGRAPHIC ANALYSIS
Household Type
Table D-8 shows household type trends in Albert Lea compared to the Remainder of the Market
Area and Freeborn County in 2010 and 2020. Data for 2010 is obtained from the Decennial
Census, while the 2020 data is based on the 2015-2019 American Community Survey and ad-
justed by Maxfield Research to reflect current year household estimates. Shifting household
types can stimulate demand for a variety of housing products.
- Married couple family households typically generate demand for single-family detached
ownership housing.
- Married couples without children often desire multifamily housing for convenience rea-
sons. Married couple families without children are generally made up of younger cou-
ples that have not had children (and may not have children) and older couples with
adult children that have moved out of the home.
- Other family households, defined as a male or female householder with no spouse pre-
sent (typically single-parent households), often require affordable housing.
- Changes in non-family households (households living alone and households composed
of unrelated roommates) often drive demand for rental housing.
Household Type Comparison
2020
0% 20% 40% 60% 80% 100%
Albert Lea '10 35% 5% 14% 31% 15%
Albert Lea '20 33% 6% 14% 28% 18%
Remainder '10 23% 5% 20% 41% 11%
Remainder '20 23% 6% 17% 43% 11%
Freeborn County '10 30% 5% 17% 35% 13%
Freeborn County '20 29% 6% 16% 34% 15%
Living Alone Roommates Married w/ Child Married w/o Child Other Family
• In 2020, family households comprised an estimated 61% of all households in Albert Lea
compared to 71% in the Remainder of the MA.
• In Albert Lea, single-person households were estimated to be the most common household
type in 2020 (33%), followed by married couples without children (28%).
MAXFIELD RESEARCH AND CONSULTING, LLC 23DEMOGRAPHIC ANALYSIS
• Family households experienced an estimated 1% growth between 2010 and 2020 in Albert
Lea, increasing by 67 households, while family households declined 3% in the Remainder of
the MA.
• Albert Lea experienced an estimated 9% decrease in the number of married couples with-
out children after subtracting 227 households between 2010 and 2020, while the number of
married couples with children grew slightly by 2% (18 households). The reverse was experi-
enced in the Remainder of the MA as married couples with children declined 3% while mar-
ried without children grew 2%.
• Between 2010 and 2020, non-family households decreased by an estimated 3% (-105
households) in Albert Lea but increased 2% in the Remainder of the PMA.
• The number of single-person households decreased by an estimated 7% (-180 households)
in Albert Lea while the number of roommate households increased by 75 households (18%)
from 2010 to 2020.
TABLE D-8
HOUSEHOLD TYPE
ALBERT LEA MARKET AREA
2010 & 2020
Albert Lea Remainder of MA Freeborn County
2010 2020 2010 2020 2010 2020
Total Households 7,774 7,736 5,403 5,314 13,177 13,050
Non-Family Households 3,130 3,025 1,492 1,520 4,622 4,544
Living Alone 2,715 2,535 1,246 1,206 3,961 3,741
Other (Roommates) 415 490 246 314 661 804
Family Households 4,644 4,711 3,911 3,794 8,555 8,506
Married w/ Children 1,082 1,100 1,105 928 2,187 2,027
Married w/o Children 2,416 2,189 2,230 2,269 4,646 4,458
Other Family 1,146 1,422 576 598 1,722 2,020
Change (2010 - 2020) Albert Lea Remainder of MA Freeborn County
No. Pct. No. Pct. No. Pct.
Total Households -38 -0.5% -89 -1.6% -127 -1.0%
Non-Family Households -105 -3.4% 28 1.8% -78 -1.7%
Living Alone -180 -6.6% -40 -3.2% -220 -5.6%
Other (Roommates) 75 18.1% 68 27.5% 143 21.6%
Family Households 67 1.4% -117 -3.0% -49 -0.6%
Married w/ Children 18 1.6% -177 -16.1% -160 -7.3%
Married w/o Children -227 -9.4% 39 1.7% -188 -4.0%
Other Family 276 24.1% 22 3.9% 298 17.3%
Sources: U.S. Census; ESRI; Maxfield Research & Consulting, LLC
MAXFIELD RESEARCH AND CONSULTING, LLC 24EMPLOYMENT TRENDS
Introduction
Employment characteristics are pertinent when evaluating housing needs in any given market
area. These trends warrant consideration since employment growth often fuels household
growth. Typically, households prefer to live near work for convenience, which is a primary fac-
tor in choosing a housing location. Many households commute greater distances to work pro-
vided their housing is affordable enough to offset the additional transportation costs.
Resident Employment
Table E-1 shows information on the resident labor force and employment in Albert Lea com-
pared to Freeborn County and the Southeast Development Region. The data is sourced from
the Minnesota Department of Employment and Economic Development (MN DEED). Resident
employment data reveals the workforce and number of employed people living in the area.
Not all these individuals necessarily work in the area.
TABLE E-1
LABOR FORCE AND RESIDENT EMPLOYMENT TRENDS
ALBERT LEA MARKET AREA
2008 through 2020
ALBERT LEA Freeborn County (MA) Southeast Development Region
Labor Employed UE Labor Employed UE Labor Employed UE
Year Force Residents Rate Force Residents Rate Force Residents Rate
2020* 9,030 8,513 5.7% 16,336 15,484 5.2% 286,002 271,769 5.0%
2019 8,922 8,584 3.8% 16,185 15,612 3.5% 288,108 279,431 3.0%
2018 8,855 8,549 3.5% 16,044 15,532 3.2% 283,416 275,864 2.7%
2017 8,911 8,552 4.0% 16,145 15,565 3.6% 282,049 273,488 3.0%
2016 8,873 8,505 4.1% 16,331 15,708 3.8% 281,883 272,251 3.4%
2015 8,903 8,545 4.0% 16,341 15,727 3.8% 278,869 269,557 3.3%
2014 8,912 8,482 4.8% 16,245 15,541 4.3% 276,399 265,774 3.8%
2013 9,073 8,556 5.7% 16,459 15,640 5.0% 277,839 265,343 4.5%
2012 9,210 8,602 6.6% 16,675 15,707 5.8% 277,984 263,876 5.1%
2011 9,408 8,720 7.3% 17,051 15,919 6.6% 276,515 260,038 6.0%
2010 9,439 8,637 8.5% 17,087 15,767 7.7% 276,681 257,676 6.9%
2009 8,792 7,921 9.9% 16,527 15,136 8.4% 273,813 253,779 7.3%
2008 8,640 8,083 6.4% 16,347 15,417 5.7% 269,365 255,673 5.1%
*2020 Data during COVID-19 Pandemic
Sources: Minnesota DEED; Maxfield Research & Consulting, LLC
• In 2020, Albert Lea had a labor force of 9,030 with 8,513 employed residents, which equates
to a 5.7% unemployment rate. By comparison, unemployment rates were at 5.2% in Free-
born County and 5.0% in the Southeast Development Region.
• It is unknown to what extent the shutdowns in response to Covid-19 will have on long term
employment projections. The data in Table E-1 shows employment is down in Albert Lea,
Freeborn County and the Southeast Development Region but not significantly.
MAXFIELD RESEARCH AND CONSULTING, LLC 25EMPLOYMENT TRENDS
Labor Force vs. Employment Growth
Albert Lea
9,600
9,400
9,200
9,000
8,800
8,600
8,400
8,200
8,000
7,800
2008 2009 2010 2011 2012 2013 2014 2015 2016 2017 2018 2019 2020
Labor Force Employment
• Albert Lea’s labor force declined steadily from 2010 through 2016, losing an estimated 565
people (-6%) before fluctuating over the next four years and ultimately increasing by 157
people (2%) from 2016 to 2020. Overall, the labor force in Albert Lea declined by 4% over
the decade.
• Resident employment in Albert Lea declined at lesser rate (-1%, -124 jobs) over the decade
compared to the labor force -4% (-409 people).
• Increased hiring over the decade drove the unemployment rate down in Albert Lea as
growth in the number of employed residents outpaced labor force growth since 2010.
• Albert Lea’s unemployment rate has consistently tracked higher than Freeborn County and
the Southeast Development Region.
• The following charts illustrate how unemployment in the Market Area has mirrored national
trends but has remained well below the national rate throughout much of the past decade.
Albert Lea’s and Southeast Minnesota Economic Development Region’s unemployment
rates have consistently tracked with unemployment trends in the State.
MAXFIELD RESEARCH AND CONSULTING, LLC 26EMPLOYMENT TRENDS
Annual Unemployment Rate Comparison
12.0%
10.0%
8.0%
6.0%
4.0%
2.0%
6.4%
9.9%
8.5%
7.3%
6.6%
5.7%
4.8%
4.0%
4.1%
4.0%
3.5%
3.8%
5.7%
0.0%
'08 '09 '10 '11 '12 '13 '14 '15 '16 '17 '18 '19 '20
Albert Lea Freeborn Cnty. SE MN MN US
UNEMPLOYMENT RATE january 2020 - February 2021
14.0%
Albet Lea
13.0% 13.0%
Minnesota
12.0%
U.S.
11.0% 11.1%
SE MN
10.0% 9.1%
9.0%
8.0%
8.5%
7.0%
6.6%
6.0%
5.0% 4.6%
4.0% 4.6%
4.0% 3.9% 4.3%
3.0%3.7%
3.4%
2.0%
1.0%
0.0%
Jan. Feb. March April May June July Aug. Sept. Oct. Nov. Dec. Jan. Feb.
2020 2020 2020 2020 2020 2020 2020 2020 2020 2020 2020 2020 2021 2021
MAXFIELD RESEARCH AND CONSULTING, LLC 27You can also read