A multilevel scenario based predictive analytics framework to model the community mental health and built environment nexus
←
→
Page content transcription
If your browser does not render page correctly, please read the page content below
www.nature.com/scientificreports
OPEN A multilevel scenario based
predictive analytics framework
to model the community mental
health and built environment nexus
Sayanti Mukherjee1*, Emmanuel Frimpong Boamah2, Prasangsha Ganguly1 &
Nisha Botchwey3
The built environment affects mental health outcomes, but this relationship is less studied and
understood. This article proposes a novel multi-level scenario-based predictive analytics framework
(MSPAF) to explore the complex relationships between community mental health outcomes and
the built environment conditions. The MSPAF combines rigorously validated interpretable machine
learning algorithms and scenario-based sensitivity analysis to test various hypotheses on how the
built environment impacts community mental health outcomes across the largest metropolitan areas
in the US. Among other findings, our results suggest that declining socio-economic conditions of
the built environment (e.g., poverty, low income, unemployment, decreased access to public health
insurance) are significantly associated with increased reported mental health disorders. Similarly,
physical conditions of the built environment (e.g., increased housing vacancies and increased travel
costs) are significantly associated with increased reported mental health disorders. However, this
positive relationship between the physical conditions of the built environment and mental health
outcomes does not hold across all the metropolitan areas, suggesting a mixed effect of the built
environment’s physical conditions on community mental health. We conclude by highlighting future
opportunities of incorporating other variables and datasets into the MSPAF framework to test
additional hypotheses on how the built environment impacts community mental health.
The physical and socio-economic aspects of the built environment impact population mental health outcomes
of a community. The physical aspects include human-created infrastructure systems, such as transportation
and housing infrastructure systems, which support the functioning of people within a community1. The socio-
economic aspects refer to the economic, racial and ethnic, and relational conditions that may influence a person’s
ability to function well, both physically and psychologically, within their communities. Studies have examined
how such physical and socio-economic aspects of the built environment impact a community’s overall health
and well-being in terms of crime r ates2, educational performance, property v alues3, and various health outcomes
such as obesity, heart disease, cancer, stroke, respiratory disease, diabetes, and suicide r ates4–7. More specifically,
understanding and predicting health outcomes as a function of the built environment is a significant focus among
urban planning, public health and allied professionals. The SARS-COV-2 pandemic has further exacerbated
the urgency to understand how such aspects of the built environment influence health outcomes. Examples
include—studying the reasons for faster disease spread within the vulnerable and minority population based
on the socio-economic conditions and physical setting of their surrounding built e nvironment8,9, investigating
how the different conditions within the built environment (e.g., sanitation conditions and closed and open
areas) or different types of physical surfaces (e.g., metal and other solid surfaces, and water) aid in the spread
of the virus10,11.
Mental health is one of the specific health outcomes impacted by the built environment. Mental illness or
disorder contribute significantly to the global burden of disease, accounting for 32.4% of years lived with disability
1
Department of Industrial and Systems Engineering, School of Engineering and Applied Sciences, University at
Buffalo - The State University of New York, Buffalo, NY 14260, USA. 2Department of Urban and Regional Planning,
School of Architecture and Planning, University at Buffalo - The State University of New York, Buffalo, NY 14214,
USA. 3School of City & Regional Planning, College of Design, Georgia Institute of Technology, Atlanta, GA 30332,
USA. *email: sayantim@buffalo.edu
Scientific Reports | (2021) 11:17548 | https://doi.org/10.1038/s41598-021-96801-x 1
Vol.:(0123456789)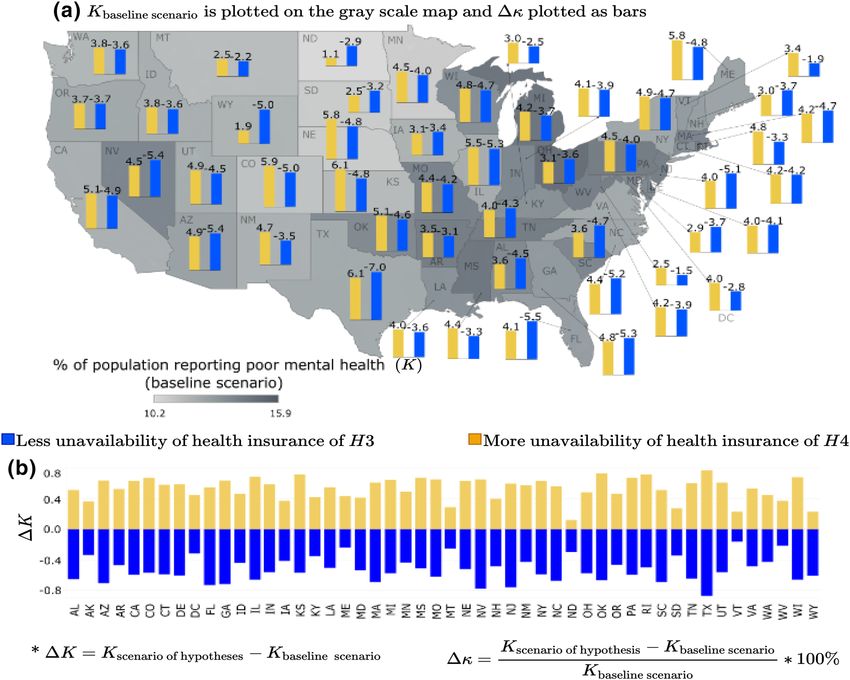
www.nature.com/scientificreports/
(YLDs) and 13.0% of disability-adjusted life-years (DALYs), globally12. As of 2016, global estimates revealed
that mental discourses (e.g., chronic depression, anxiety, substance use disorders) were significant contributors
to disability in young adults; depressive and anxiety disorders were high among females, while substance use
and autism spectrum disorders were high among m ales13. In the US, suicide ideation in adults is increasing,
with 10.3 million adults diagnosed with severe thoughts of s uicide14, and over two million youth having severe
depression15. In fact, depression and hopelessness are the key predictors of suicide ideation and attempts in young
adults6. Based on the commissioning report on mental health and the sustainable development goals (SDGs)16,
mental health is considered a “global public good”, but both developed and developing countries struggle to
understand and address the complex physical, social, and environmental influences that interact with genetic,
neuro-developmental, and psychological processes driving the mental health and well-being of p eople16.
Although the built environment impacts mental health, there are gaps in the literature about the complex
and non-linear relationships between mental health outcomes and the built environment. Studies examining the
socio-economic determinants of mental health have shown that poverty, childhood adversity, and violence are
the key risk factors of mental health disorders17. Studies have also indicated a disparity among large and medium/
small metropolitan areas’ suicide rates with the latter being higher than the f ormer7. Variations in population
demographics and socio-economic factors such as unemployment rates, household income, and climate are the
key factors associated with such d isparities7. Other studies have also looked at the link between mental health
and low quality of care for mental health disorders as well as human rights abuses18. However, there are gaps in
the literature about the link between the various aspects of built environment and mental health outcomes. In
what they delineate as the “neighborhood domain”, the commissioning report on the SDGs and mental health
indicates that poorly planned or deteriorating neighborhoods (e.g., housing vacancy and declining quality of
housing and community infrastructure) pose mental health challenges on individual-level biological markers16.
Various studies attempt to explain the link between population mental health and the built environment. For
example, one study found that adolescents living in physically deteriorated neighborhoods had more health prob-
lems, including depression and anxiety than those living in ordered neighborhoods19. Another research project
that studied 1355 residents in the New York City found that populations living in poor quality neighborhoods
had a greater likelihood of experiencing chronic depression, after controlling for their income, race/ethnicity,
age, and neighborhood-level i ncome20. A cross-sectional study of adults (16 years and above) residing in north
London showed that the prevalence of depression had a statistically significant relationship with living in areas
characterized by deck access homes (i.e., abundant with graffiti and without shared recreational spaces), after
adjusting for individuals’ internal characteristics of their dwellings and socio-economic s tatus21. A systematic
review of 45 studies reveals that 37 reported at least one built environment characteristic associated with depres-
sion or depressive s ymptoms22.
However, despite some advancements in understanding the interplay between the built environment and
mental health, there are limited methodological frameworks to parse the nonlinear relationships between the
built environment and mental health outcomes23, which this article aims to contribute. For instance, apart
from genetic, lifestyle, and physio-psychological factors, mental health is influenced by a complex interplay of
the physical and socio-economic aspects of the built environment (e.g., neighborhood decline, transportation
conditions, unemployment, income, race, age, social capital, education). The complex, non-linear relationship
between the built environment factors and mental health outcomes constrains the traditionally-used linear and
static models’ explanatory and predictive a bilities24. Even though these complex interactions are acknowledged,
studies are yet to leverage recent advances in big data analytics to explore such complexities.
In this study, we demonstrate a novel data-driven approach to study the complex associations between men-
tal health of adults within a metropolitan community and the physical and socio-economic aspects of the built
environment, thus guiding how properly planned neighborhoods may improve the overall mental health out-
comes of the adult population within a community. Specifically, we develop and employ a novel methodologi-
cal framework, a multi-level scenario-based predictive analytics framework (MSPAF), to explore the complex
relationships between mental health outcomes and conditions in the built environment. The MSPAF combines
rigorously validated interpretable machine learning algorithms and scenario-based sensitivity analysis to test
several hypotheses on how the built environment affects mental health outcomes across the largest metropoli-
tan areas in the US. The scenario-based analysis predicts how the community mental health outcomes in these
metropolitan areas change under plausible perturbations of various built environment factors.
Results
Predictive performance of interpretable machine learning models and model selection. This
study leveraged a library of supervised interpretable machine learning models to assess the associations between
community mental health outcomes and, the built environment’s physical and socio-economic aspects. Inter-
pretable machine learning models, ranging from parametric, semi-parametric to non-parametric models, vary
widely in their degree of complexity, robustness, flexibility, and interpretability (discussed further in “Overview
of statistical learning” section)25,26. The statistical learning techniques are used in different research areas, such
as energy demand modeling27, infrastructure vulnerability assessment28 or crime prediction2. The parametric
modeling technique (e.g., linear regression models), where a parametric function is fitted to the training data
(e.g., via mechanisms such as least-squares), is the most popular modeling approach in healthcare research.
Although such models are simple and easier to interpret, they often fail to approximate the true function since
real relationships are often not linear. On the other hand, non-parametric data-driven models do not make any
unrealistic assumptions about the functional form, thereby better approximating the true functional form. How-
ever, flexibility comes at the cost of interpretability25. Although such data-driven non-parametric algorithms
have seen their wide application in various domains of risk assessment such as crime risk m odeling2, energy
Scientific Reports | (2021) 11:17548 | https://doi.org/10.1038/s41598-021-96801-x 2
Vol:.(1234567890)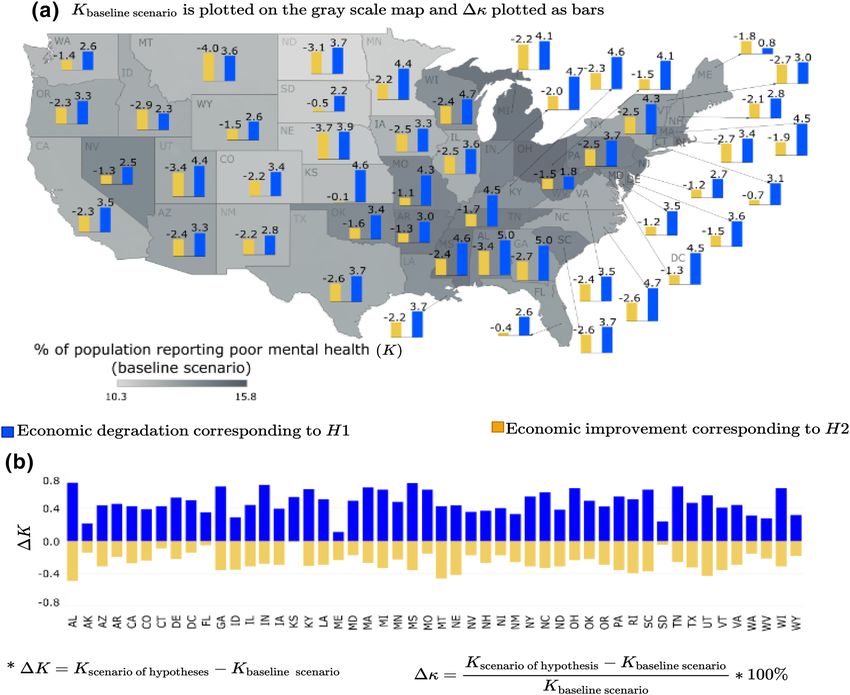
www.nature.com/scientificreports/
In-sample Out-of-sample
Model R2 RMSE MAE RMSE MAE
Generalized linear model 0.987 0.387 0.295 0.389 0.295
Ridge regression 0.971 0.584 0.457 0.588 0.459
Lasso regression 0.962 0.661 0.517 0.665 0.519
Generalized additive model 0.991 0.315 0.238 0.319 0.240
Multivariate adaptive regression splines [MARS] 0.983 0.441 0.328 0.442 0.328
MARS [degree=2] 0.982 0.454 0.343 0.456 0.344
MARS [degree=3] 0.982 0.454 0.342 0.456 0.343
MARS [degree=3; penalty=2] 0.981 0.454 0.361 0.456 0.343
Random forest 0.996 0.199 0.139 0.493 0.347
Gradient boosting method 0.994 0.261 0.197 0.309 0.282
Bayesian additive regression trees 0.997 0.182 0.136 0.221 0.159
Null NA 3.382 2.773 3.386 2.774
Table 1. Model performance comparison.
supply inadequacy risk27,29–34, infrastructure risk assessment35, natural disaster risk assessment28,36,37, among
others, these methods are significantly under-explored in healthcare research despite their robustness and flex-
ibility. To bridge this gap, this study assessed the predictive performance of eight interpretable machine learn-
ing models ranging from parametric to non-parametric—generalized linear model (GLM)38, ridge regression
(RR)39, lasso regression (LR)40, generalized additive model (GAM)41, multivariate adaptive regression splines
(MARS)42, gradient boosting method43, random forest (RF)44, and Bayesian additive regression tree (BART)45.
Leveraging an 80–20 randomized percentage holdout cross-validation technique, we estimated the generaliza-
tion performances of the models and selected the model that outperformed all the other models in terms of both
in-sample goodness-of-fit and out-of-sample predictive accuracy (see “Overview of statistical learning” section).
The model performances of the various models are depicted in the Table 1. Our results indicate that BART out-
performed all the other models which is, thus, leveraged for the relevant statistical inferencing (see “Key factors
attributing to socio-economic and physical aspects of the built environment” section).
Key factors attributing to socio‑economic and physical aspects of the built environment. We
leveraged the variable importance plot (VIP) (see Supplementary Information) and the partial dependence plots
(PDPs) to identify the key built environment predictors of mental health outcomes, and evaluated their associ-
ated relationships (see “Overview of statistical learning” section for mathematical details of the VIP and PDP).
For our analysis, we also controlled for behavioral and underlying health conditions (e.g., smoking habit, prin-
cipal components of underlying physical health conditions) that significantly influence mental health outcomes.
Since this study focuses on the built environment factors, our subsequent discussions will focus on the built
environment’s physical and socio-economic aspects, which remain under-explored and are central to this article.
Partial dependence plots (PDPs) of the socio-economic aspects of the built environment, are depicted in
Fig. 1. The PDP of poverty, shown in Fig. 1a, indicates a strong positive correlation with mental health outcomes.
This relationship suggests that as the percentage of families below the poverty level increases from 10 to 80%, the
percentage of adults (> 18 years) reporting poor mental health (mental health not good for ≥ 14 days) increases
from 12.8 to 13.8% in the community on average. The narrow confidence interval (represented by the shaded grey
area) indicates that the estimates are associated with less uncertainty. Other significant factors in this category
include economic variables such as median family income and change in the unemployment rate (2005–2014).
The partial dependence plot of median family income (Fig. 1b) shows a negative correlation. More specifically, we
observe that as the median family income decreases from around $130,000 to $20,000, the percentage of adults
reporting mental health disorders increases from 13.0 to 13.3% on average in a community. However, the wider
confidence interval around the larger income values indicates that the estimated mental health outcomes for
adults in the higher income range significantly vary. On the other hand, the relationship between unemployment
changes and the percentage of adults reporting poor mental health is relatively uncertain Fig. 1c. Besides the
economic status of a community, access to medical insurance plays a major role in predicting the community
mental health outcomes. The PDP of the percentage of families with no health insurance (Fig. 1d) shows that it
has a strong positive correlation with mental health outcomes. It is observed that as the percentage of families
with no health insurance in a community increases from 5 to 35%, the percentage of adults reporting poor mental
health increases from 12 to 14.5%. The narrow confidence interval indicates lower uncertainty and variations
in the estimated relationship across the US metropolitans. Our results also suggest that the insurance type plays
a major role in influencing mental health of adults within a metropolitan community. The PDP of insurance
type, representing the ratio of percentage of families with public health insurance to private health insurance,
is plotted in Fig. 1e. From the plot, we observe that as the proportion of families having public health insurance
compared to that having private health insurance approximately doubles, the percentage of adults reporting poor
mental health declines from 13.4 to 13.0% on average. The decreasing trend indicates that increased access to
public health insurance is associated with decreased mental health disorders reported by adults in a metropolitan
community on average.
Scientific Reports | (2021) 11:17548 | https://doi.org/10.1038/s41598-021-96801-x 3
Vol.:(0123456789)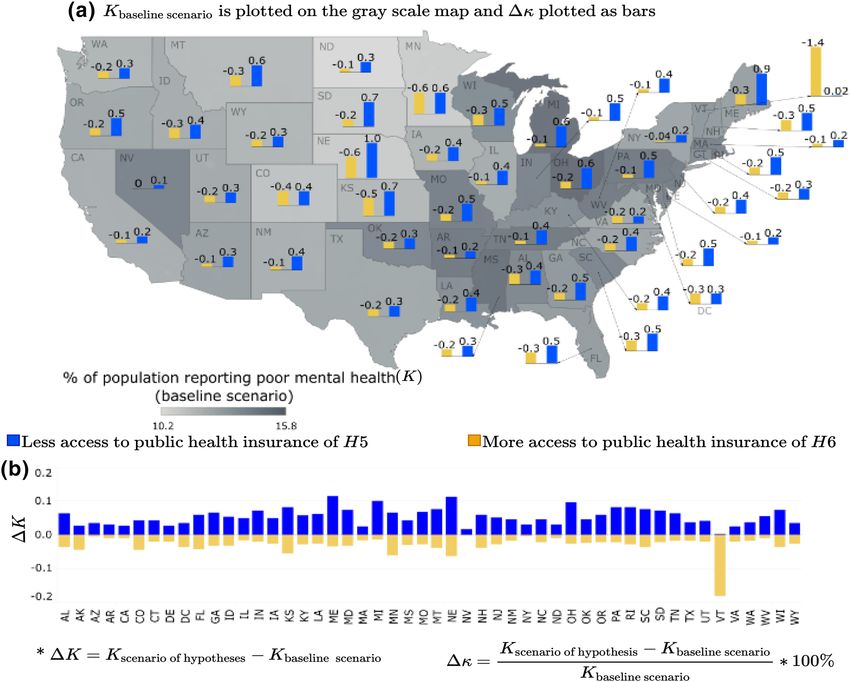
www.nature.com/scientificreports/

                                            Figure 1.  Partial Dependence Plots (PDPs) of the key socio-economic aspects of the built environment: (a) %
                                            of families below poverty level, (b) median family income, (c) % change in unemployment rate, (d) % families
                                            with no health insurance, (e) ratio of % of families with public health insurance vs. private health insurance. In
                                            each sub-figure, on the x-axis, the values of the particular independent variable is plotted, and on the y-axis,
                                            the partial effect of the independent variable on the response variable is depicted. The black curve is the average
                                            partial effect of the predictor variable and blue lines indicate the 95% confidence intervals.

                                            Figure 2.  Partial Dependence Plots (PDPs) of the key physical aspects of the built environment: (a) % of the
                                            transportation cost as a percentage of income and (b) average number of vacant properties. In each sub-figure,
                                            on the x-axis, the values of the particular independent variable is plotted, and on the y-axis, the partial effect of
                                            the independent variable on the response variable is depicted. The black curve is the average partial effect of the
                                            predictor variable and blue lines indicate the 95% confidence intervals.

                                                Our result shows that transportation or commuting cost (percentage of household income spent on transpor-
                                            tation) and the average number of vacant properties, which constitute the built environment’s physical aspect,
                                            are the key predictors of community mental health. The PDP of transportation cost shows a positive correlation
                                            with poor mental health (Fig. 2a). More specifically, we observe that as household transportation expenditures
                                            increase from 20 to 100% on average, the percentage of adults reporting poor mental health increases from 13.0
                                            to 13.10% on average. Although this increment seems small, it should be noted that these numbers only indicate
                                            the national average of large metropolitan communities, with some US states experiencing much higher negative
                                            impacts than others. Our scenario based sensitivity analysis (refer to “Data and methods” section) emphasizes
                                            such variations across the various metropolitan areas in the US states. However, the relationship between average
                                            number of vacant properties and community mental health is uncertain (Fig. 2b). We observe a slightly increas-
                                            ing trend in the percentage of adults reporting poor mental health as the average number of vacant properties
                                            increases. However, as the trend reaches the threshold point around 900 vacant properties in a community on
                                            average, the association flattens, that is, the number of reported mental health issues becomes insensitive to
                                            changes in vacant properties at a certain threshold level.

          Scientific Reports |   (2021) 11:17548 |               https://doi.org/10.1038/s41598-021-96801-x                                                     4

Vol:.(1234567890)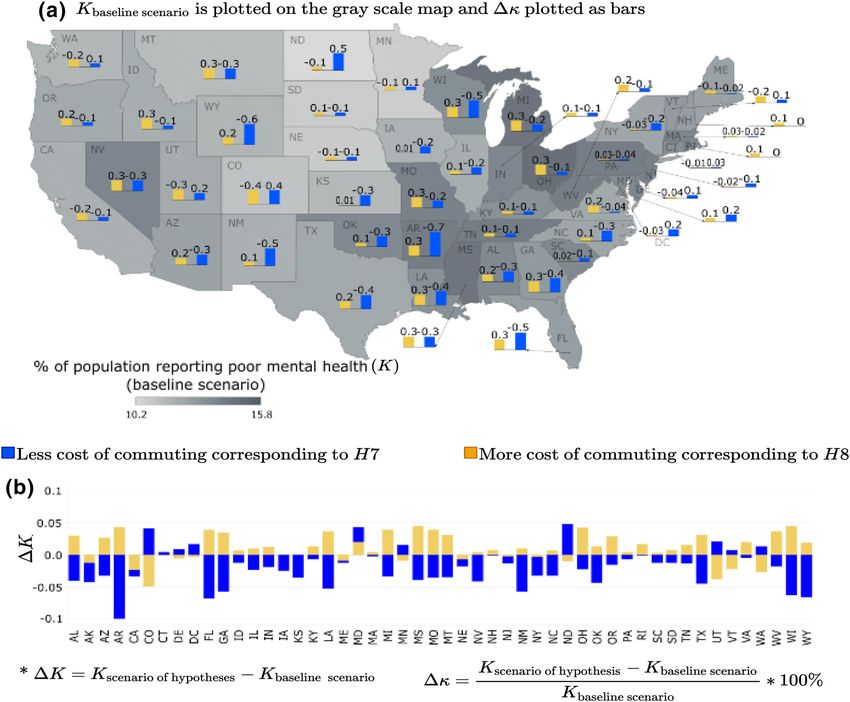
www.nature.com/scientificreports/
Independent variable category Perturbation scenario and implications Hypothesis index Hypothesis statement
Economic degradation increase in % families below
Economic degradation leads to degradation in community
poverty level and unemployment rate by 1σ ; decrease in H1
mental health or increase in K
median household income by 1σ
Economic characteristics
Economic improvement decrease in % families below
Economic improvement leads to improvement in com-
poverty level and unemployment rate by 1σ ; increase in H2
munity mental health or decrease in K
median household income by 1σ
Less unavailability of health insurance % families with no Less unavailability of health insurance leads to improve-
H3
health insurance decreases by 1σ ment in community mental health or decrease in K
Unavailability of health insurance
More unavailability of health insurance % families with no More unavailability of health insurance leads to degrada-
H4
health insurance increases by 1σ tion in community mental health or increase in K
Decreased access to public health insurance Ratio of % Decreased access to public insurance leads to degradation
H5
families with public vs. private insurance decreases by 1σ in community mental health or increase in K
Category of health insurance
Increased access to public health insurance Ratio of % fami- Increased access to public insurance leads to improvement
H6
lies with public vs. private insurance increases by 1σ in community mental health or decrease in K
Cheaper mode of travel and/or shorter commuting distance Decreased transportation cost leads to improvement in
H7
to work annual transportation cost decreases by 1σ community mental health or decrease in K
Transportation cost
Expensive mode of travel and/or longer commuting distance Increased transportation cost leads to degradation in com-
H8
to work annual transportation cost increases by 1σ munity mental health or increase in K
People moving into the metropolitan areas (community
Decrease in vacancy would lead to improvement in com-
expanding) average number of vacant properties decreases H9
munity mental health or decrease in K
by 1σ
Average number of vacant properties
People moving out of the metropolitan areas (community
Increase in vacancy would lead to degradation in com-
shrinking) average number of vacant properties increases H10
munity mental health or increase in K
by 1σ
Table 2. Summary of the hypotheses.
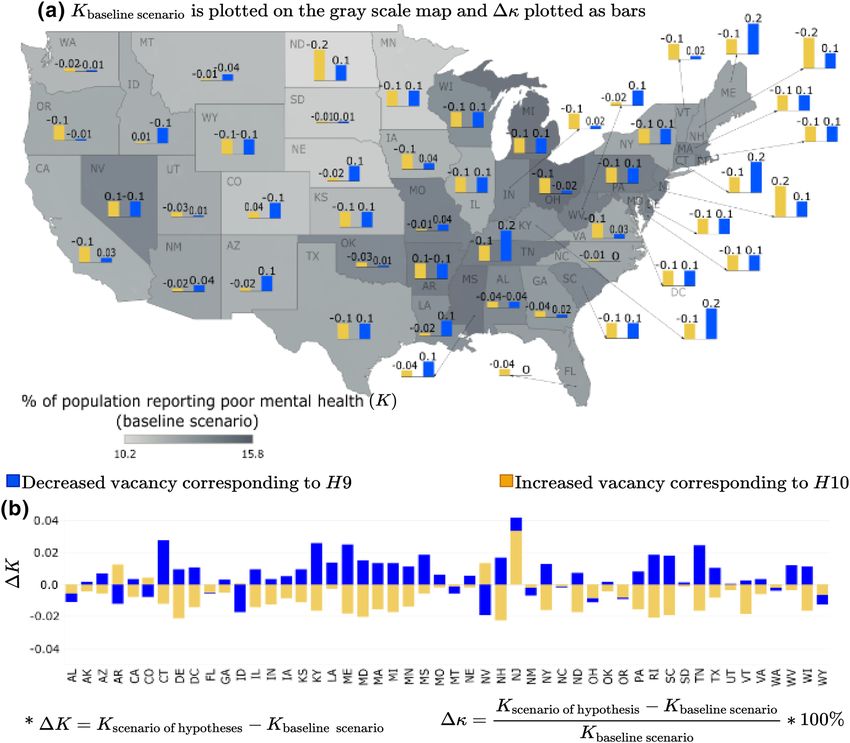
Projected community mental health burden under plausible perturbations. Having identified
the key built environment factors associated with mental health outcomes, we employed a scenario-based sen-
sitivity analysis to understand how mental health outcomes may change under different built environment sce-
narios. Plausible future scenarios are captured through perturbations of the socio-economic and physical aspects
of the built environment. Traditionally, in modern epidemiological studies, the sensitivity and uncertainty analy-
ses for any disease burden and risk factor estimates are conducted using different weighting mechanisms and
discount rate techniques46. However, due to large degrees of uncertainties associated with value judgments and
built environment conditions, the choice of discount rates is challenging and often cannot capture the wide
range of future uncertainties47. To overcome these challenges, we limited our analysis to statistical perturbation.
The statistical perturbation consists of three significant steps described as follows: (1) we statistically perturbed
the socio-economic and physical aspects of the built environment, which may lead to increase (e.g., economic
growth) or decrease (e.g., economic recession) in the independent variable under consideration; (2) following
a general intuition, we hypothesized whether the increase (decrease) in the independent variable leads to bet-
ter (worse) mental health outcomes and vice-versa; and, (3) leveraging our predictive model, we verify if our
hypothesis is valid nationally or only for certain US states (see “Data and methods” section for details on creating
scenarios and list of hypotheses summarized in Table 2).
For illustration purpose, consider K represents the community mental health (response variable in our analy-
sis), measured in terms of “% adults aged > 18 suffering from poor mental health for > 14 days”. Hence, improve-
ment in mental health is depicted by a decrease in K, and deterioration of community mental health is observed
when there is an increase in K. The predictor or independent variables under consideration for scenario-based
sensitivity analysis are grouped into five categories, viz., (i) economic factors consisting of median household
income, % of population below the poverty level and unemployment rate (ii) percentage of families with no health
insurance, (iii) proportions of families having public insurance compared to private insurance, (iv) percentage
of transportation cost spent as a % of household income, and (v) the average number of vacant properties (as
of 2014). The first three categories of independent variables capture the socio-economic characteristics of the
built environment and the last two categories represent the physical aspects of built environment. We assume,
two hypothetical scenarios at a given time in our study: (1) the mean of the distributions of the socio-economic
parameters (i.e., economic conditions, access to health insurance, and type of health insurance) and the physi-
cal aspects (i.e., travel cost and housing vacancy) of built environment of a community shifts by +1 standard
deviation from their historical mean, which represents the base case or as-is scenario; and, (2) the mean of those
distributions shift by −1 standard deviation from their historical mean. Note that, these statistical perturbations
help to provide important insights regarding the trends of community mental health outcomes under plausible
scenarios. However, it should be noted that our framework is generalized enough that it can be used to predict
how the community mental health outcomes may change in the future, given the forecasted data on socio-
economic aspects and built environment is available. Our study presents the framework illustrating how future
mental health outcomes might be affected under various future scenarios. Furthermore, to understand whether
such shifts results in a favorable outcome (improved mental health) or not, we compared the projections with the
base case scenario of mental health outcomes by constructing ten hypotheses (see Table 2 in “Data and methods”
section). Finally, we validated our hypotheses based on our model results and outcomes.
Scientific Reports | (2021) 11:17548 | https://doi.org/10.1038/s41598-021-96801-x 5
Vol.:(0123456789)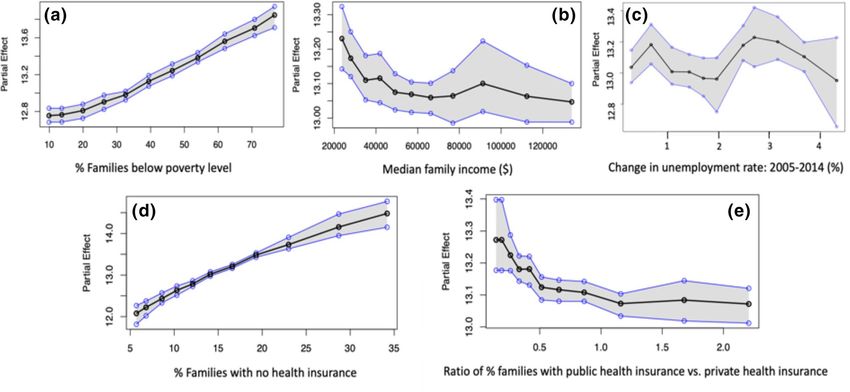
www.nature.com/scientificreports/
Figure 3. Economic condition scenario for % of adults aged > 18 years reporting poor mental health for > 14
days (K): (a) �κ is plotted as the bars and K for base line scenario is plotted as gray scale intensity on the US
map; and for (b) K is plotted. The maps are created using Tableau 2021.2 (Tableau 2021.2 New Features) and
Adobe Illustrator (Software and services for creative business teams | Adobe Creative Cloud for teams).
The socio‑economic aspects of built environment. Overall, our scenario-based sensitivity analysis indicates that
the metropolitan areas in the eastern part of the US have poor mental health outcomes. We discuss the observed
variations in the community mental health outcomes across the 50 states in the US under the six different
scenarios of the socio-economic aspects of built environment—worst- and best-case scenarios of (a) economic
condition, (b) lack of health insurance, and (c) access to public health insurance.
Economic condition. The economic conditions capture the interplay of poverty, median household income,
and unemployment rate of the population in a metropolitan area. Since economic condition comprises three
variables, for simplicity the hypothetical scenario is constructed by perturbing all the three variables simultane-
ously. It was hypothesized that during declining economic conditions, the expected percentage of people report-
ing poor mental health (K) would increase (hypothesis: H1), and the opposite effect would be observed during
an increase in economic growth/boom (hypothesis: H2). The scenario-based analysis conducted herein supports
these two hypotheses throughout all the states in the US. As depicted in Fig. 3, when economic depression sets in
(blue bars), all the states observe a deterioration in community mental health depicted by �K > 0. On the other
hand, when the community experiences an economic boom (yellow bars), improvement in community mental
health is observed depicted by �K < 0. The scenario analysis, depicted in Fig. 3, shows that the percentage
change (increase or decrease) in reported mental disorders among adults is more pronounced in metropolitan
areas within states such as Alabama, Georgia, Indiana, Massachusetts, Kentucky, Michigan, Mississippi, Mon-
tana, Ohio, South Carolina, Tennessee, Utah, and Wisconsin. A recent systematic review identifies economic
conditions as one of the social determinants of mental h ealth48. These conditions are linked to p overty16,48,
income49, and u nemployment50. The scenario-based analysis confirms some of these earlier studies, but it also
goes a step further to provide a metropolitan-level analysis of how improving or declining economic conditions
Scientific Reports | (2021) 11:17548 | https://doi.org/10.1038/s41598-021-96801-x 6
Vol:.(1234567890)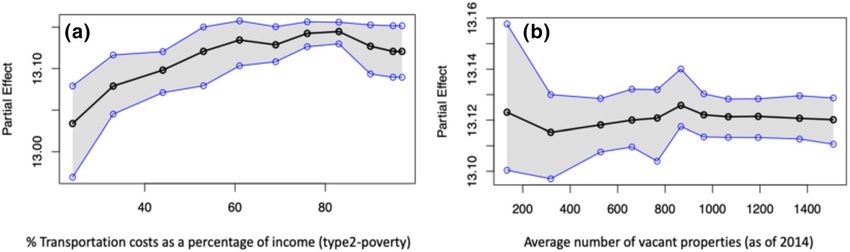
www.nature.com/scientificreports/
Figure 4. Unavailability of health insurance scenario for % of adults aged > 18 years reporting poor mental
health for > 14 days (K): (a) �κ is plotted as the bars and K for base line scenario is plotted as gray scale
intensity on the US map; and for (b) K is plotted. The maps are created using Tableau 2021.2 (Tableau 2021.2
New Features) and Adobe Illustrator (Software and services for creative business teams | Adobe Creative Cloud
for teams).
affect the mental health of adults in specific metropolitan areas in the US. Moreover, we also observe that com-
munity mental health is more sensitive to economic depression (longer blue bars for economic degradation)
than economic boom (shorter yellow bars representing economic growth).
Unavailability of health insurance. In this case, the variable under consideration is the percentage of fami-
lies with no health insurance or lack of access (unavailability) to health insurance. It was hypothesized that an
overall improvement in community mental health would be observed when the unavailability of mental health
will decrease, i.e., more families will have health insurance (hypothesis: H3). An opposite effect is expected
with increased unavailability of health insurance, or in other words when, more families are being deprived of
health insurance, which may lead to worsening mental health problems (hypothesis: H4). The scenario-based
analysis in Fig. 4 suggests that these two hypotheses generally hold true for all the metropolitan areas across
the US, considered in this study. From Fig. 4, we observe that when the percentage of families with no health
insurance increases (yellow bars), the number of adults reporting poor mental health in the community (K)
increases, compared to the baseline scenario. An opposite effect, i.e., decrease in the number of people reporting
poor mental health is observed for the scenario depicting higher percentage of families in a community having
health insurance (blue bars). However, a change (increase or decrease) in access to health insurance results in a
minimum shift in the percentage of adults reporting mental disorders in the metropolitan areas of the states such
as Montana, North Dakota, South Dakota, and Vermont. Studies show that states providing better access to men-
tal health insurance minimize suicide r ates51, but another study found that Australia’s mental health insurance
under its “Better Access scheme” has had no significant effect on the mental health of Australians52. The underly-
ing logic follows that increasing access to health insurance and, specifically, mental health insurance will likely
increase the likelihood of more number of people accessing mental healthcare53,54, which will ultimately improve
Scientific Reports | (2021) 11:17548 | https://doi.org/10.1038/s41598-021-96801-x 7
Vol.:(0123456789)www.nature.com/scientificreports/
Figure 5. Access to public health insurance scenarios for % of adults aged > 18 years reporting poor mental
health for > 14 days (K): (a) �κ is plotted as the bars and K for base line scenario is plotted as gray scale
intensity on the US map; and for (b) K is plotted. The maps are created using Tableau 2021.2 (Tableau 2021.2
New Features) and Adobe Illustrator (Software and services for creative business teams | Adobe Creative Cloud
for teams).
overall mental health outcomes. The scenario-based analysis results contribute to this debate by explicitly look-
ing at how the lack of access to health insurance in general, not only mental health insurance, may contribute to
adults’ increasing stress and poor mental health outcomes.
Access to public health insurance. Building on the health insurance scenario analysis, we hypothesized preva-
lence of differential impacts of the two different types of health insurance, i.e., public vs. private health insurance
on the community mental health outcomes. Specifically, we hypothesized that with decreased access to public
health insurance (i.e., a lower proportion of people with access to public health insurance), the overall mental
health of the community would worsen, leading to an increase in K (hypothesis: H5). The opposite effect of
improving mental health would be observed with increased access to public health insurance (hypothesis: H6).
However, these hypotheses were minimally supported in the scenario results across the states, as depicted in
Fig. 5. Although the trend of increasing or decreasing mental health outcomes was found to be consistent across
all the states having �K < 0 for all the states when access to public health increases (yellow bars) and �K > 0 for
all the states when access to public health decreases (blue bars), the magnitude of such deviations significantly
varies, ranging between −0.5% to +1.0%. This varying range indicates that the overall mental health outcomes
across the US’s metropolitan areas are not very sensitive to the type of health insurance. However, the hypothesis
of decreasing K with increasing access to public health insurance (hypothesis: H6) was significantly supported
for the metropolitan areas in Vermont. For context, Vermont was the first state in the US to adopt legislation for
universal health care for its residents in 2011, making health insurance and healthcare publicly available to many
residents, including free preventative services such as mental health and substance-based disorder s ervices55.
Scientific Reports | (2021) 11:17548 | https://doi.org/10.1038/s41598-021-96801-x 8
Vol:.(1234567890)www.nature.com/scientificreports/
The physical aspect of the built environment. Travel/commuting cost. The scenario-based sensitivity analysis
for travel cost—measured by the “% of transportation cost spent as a % of household income”—illustrates the
extent to which the commuting cost within sprawling metropolitan areas can impact community mental health
outcomes. The hypotheses explored here are—(1) the percentage of adults reporting mental disorders (K) would
decrease with decreasing travel cost (hypothesis: H7) and, (2) the percentage of adults reporting mental disor-
ders (K) would increase with increasing travel cost (hypothesis: H8). However, our analysis shows that these two
hypotheses do not hold for some metropolitan areas in some of the states. For instance, the hypothesis (H8) that
increased mental health disorders (K) are reported as the travel cost increases do not hold in metropolitan areas
within the states such as Colorado, Delaware, Maine, Minnesota, Nebraska, North Dakota, Utah, Vermont, and
Washington. There is a decrease in mental health disorders reported by adults in these metropolitan areas as the
travel costs increase. For metropolitan areas in Washington DC, Maryland, and New Hampshire, an increase or
decrease in travel costs has the same effect, i.e., an increase in the percentage of adults reporting mental health
disorders. The decrease in mental health disorders as travel cost increases is generally consistent with findings
in the literature. An increase in travel cost is often associated with sprawling areas, i.e., travel cost increases with
sprawl56,57. Some studies found that increasing sprawl (or commuting cost) either had no association with men-
tal health disorders58,59 or was positively associated with better mental health, by allowing those living in low-
density sprawl areas to enjoy proximity to nature60,61. Some studies also found that shorter distances (decreased
travel cost) to the city center positively influence subjective w ellbeing62,63. On the other hand, some studies
found that increase sprawl or travel cost negatively impacts mental health, especially for residents living in auto-
dependent sprawling neighborhoods with no access to personal v ehicles64. The mixed results of how travel costs
impact mental health outcomes in our analysis resonates with the existing literature, and it signals the need for
an in-depth and granular inquiry into how the built environment’s physical aspect impacts mental health out-
comes in cities.
Housing vacancy. In the housing vacancy scenario, the hypotheses explored in this study investigated the
extent to which neighborhood decline impacts mental health outcomes in the metropolitan areas across the
50 states in the US. Specifically, we hypothesized that a decrease in housing vacancy would lead to a decline in
adults reporting poor mental health in metropolitan areas or K (hypothesis: H9). On the other hand, an increase
in vacant properties or a decline in neighborhood size was expected to increase the percentage of adults report-
ing mental disorders (hypothesis: H10). However, overall, these hypotheses were not supported in our study. As
depicted in Fig. 7, when the housing vacancy increased (yellow bars), most metropolitan areas across the US
states experience an improvement or deterioration in the community mental health (K). On the other hand,
when a community is expanding, attributed by decreased vacancy (blue bars), most of the metropolitan areas see
an increase in the percentage of adults reporting poor mental health (K). This result may be an outcome of the
“Behavioral Sink” phenomenon65,66. However, for some states the reverse phenomenon has been observed. For
instance, when the vacancy is decreasing, metropolitan areas of some states such as Alabama, Florida, Montana,
New Mexico, North Carolina, Ohio, Oregon, Washington, and Wyoming see an improvement in mental health
depicted by �K < 0. On the other hand, when the vacancy is increasing, some states’ metropolitan areas (Ari-
zona, Colorado, Nevada, and New Jersey) see a deterioration of mental health with �K > 0. The mixed results
from this scenario analysis support our earlier observations related to the transportation cost, emphasizing that
there is more to the story when parsing the impacts of the built environment on community mental health out-
comes. More granular-level analysis complemented by macro-level analyses might better help unpack how the
built environment’s physical conditions at the household, neighborhood, city, and county levels may impact an
individual’s mental health.
As discussed, the results depicting community mental health (K) sensitivity to housing vacancy are highly
varied across the US states. Hence, it is difficult to classify whether a particular scenario of housing vacancy
perturbation leads to the best case scenario, representing improvement in community mental health unanimously
across the US states; or if the perturbation leads to the worst-case scenario, where the community mental health
unanimously deteriorates across the nation. To address this, we aggregate the individual state-wide results into
the mean value of the response variable K (for detailed results, see Supplementary Information). If the mean value
of K = Kscenario under consideration − Kbase case scenario is (+)ve , then the perturbation scenario under considera-
tion is depicted as the worst-case scenario. Similarly, if the mean K is found to be (−)ve , then there is a decline
in the percentage of the adults reporting mental health issues, so the scenario is termed as a best-case scenario.
Discussion
This study employs a library of supervised interpretable machine learning models and scenario-based sensitivity
analyses to explore the relationship between adults’ mental health, and the socio-economic and physical aspects
of the built environment in the US largest metropolitan areas. The interpretable machine learning models and
scenario-based analyses elicit three essential issues for discussion and serve as crucial conversation points for
policy discourses and future research.
First, the built environment’s socio-economic aspects are vital to understanding the social determinants of
adults’ mental health in metropolitan communities across the US. The interpretable machine learning models
suggest that increasing poverty and unemployment levels are associated with a significant increase in adults
reporting mental health disorders. The scenario-based analysis supports this finding by showing that declining
economic conditions within metropolitan areas are expected to increase the number of adults reporting mental
disorders, and this is pronounced in metropolitan areas within states such as Georgia, Massachusetts, Kentucky,
Michigan, Ohio, and Wisconsin. A number of studies have long observed the impact of poor economic condi-
tions, manifesting in issues such as poverty, low-income, and unemployment, on mental h ealth16,49,50,67. This
Scientific Reports | (2021) 11:17548 | https://doi.org/10.1038/s41598-021-96801-x 9
Vol.:(0123456789)www.nature.com/scientificreports/
paper provides evidence to support such existing findings across multiple metropolitan areas, and it allows for
both within and across the states comparisons for policy conversations around how to center discussions on
community mental health within economic policies at local, state, and national levels.
Second, the results from both the interpretable machine learning models and scenario-based analysis provide
an opening to conversations around health insurance and mental health. The debate in the literature focuses on
whether or not access to mental health insurance schemes improves the likelihood of a person accessing mental
health services, which leads to improved mental health outcomes. While the evidence seems inconclusive based
on contradictory studies across c ountries51,52,68, the partial dependence analysis of the health insurance variables
in our study show that there is a strong increasing trend between lack of health insurance and adults report-
ing mental health disorders in metropolitan areas across the states in the US. This analysis goes a step further
to show that decreased access to public health insurance is linked to increased mental disorders reported. The
scenario-based analysis showed Vermont, the first state to adopt universal healthcare, as an outlier case. Increased
access to public health insurance was linked to a significant decrease in mental health disorders reported within
Vermont’s largest metropolitan area. This finding does not necessarily suggest the need for universal healthcare.
At the very least, it calls for an in-depth research inquiry and policy discourses around how the lack of health
insurance, a critical socio-economic need, can impact a person’s mental health.
Finally, the physical aspects of the built environment are found to have mixed impacts on community men-
tal health. Adults report increased mental health disorders as travel costs increase in some metropolitan areas,
but this does not hold across all the metropolitan areas in our data sample. Similarly, mental health disorders
reported increased as housing vacancy increased in some metropolitan areas, but this also does not hold in all
metropolitan areas. The commissioning about the SDGs and mental health rightly observes the need to under-
stand “how neighborhood domain” impact the community mental health. Specifically, it indicates that, besides
biological markers, the decline in neighborhood conditions should also be considered as one of the important
social determinants of mental h ealth16. In conclusion, this article adds to existing studies on how the built envi-
ronment impacts mental health o utcomes69, supporting concerns raised in the commissioning report. More
importantly, it also adds to the literature on how urbanization (e.g., increasing sprawl and associated commuting
costs) impacts mood disorders70. The mixed results call for caution when discussing how the built environment’s
physical aspects impact community mental health. Future studies may incorporate other physical properties of
the built environment such as street density, street connectivity, and land use mix into our proposed multi-level
scenario-based predictive analytics framework (MSPAF), to further examine the relationship between the built
environment and the community mental health outcomes. Although this article focuses on the large metropolitan
areas at a national scale, micro-level data can be collected to explore at a more granular-level, such as intra- and
inter-urban and rural dynamics in terms of built environment conditions and mental health outcomes. Future
studies may focus more on studying the dynamics within and across urban and rural areas, which remains vital
to developing context-specific urban planning, public health and public policy interventions to improve built
environment and mental health outcomes.
Data and methods
Data collection and pre‑processing. In this study, we conducted a nation-level study for all the met-
ropolitan regions in 50 states across the US. We obtained and aggregated data for public health characteristics,
built environment features, and socio-economic conditions from multiple sources. From the US Centers for
Disease Control and Prevention (CDC) Behavioral Risk Factor Surveillance System (BRFSS), information about
the health-related variables like, mental health conditions, pre-clinical conditions and behavioral factors for the
adults aged 18 or above are collected at a census tract level for the year 201471. The housing vacancy data for the
year 2014 is obtained from US Housing and Urban Development (HUD) at a census tract level72. Finally, the
socio-economic characteristics like, race, income, unemployment rate, marital status, education level, and access
to health insurance information are obtained for the census tract and metropolitan levels from the American
Community Survey (ACS) for the years 2011 to 201573. The travel cost data is obtained from the US Depart-
ment of Housing and Urban Development Low Transportation Cost Index (LAI)72, which uses data on hous-
ing costs from the American Community Survey (ACS) and estimates transportation costs based on land use
mix, commute patterns, and socio-economic information. The data from the multiple sources are matched and
aggregated to create the final data set. In our analysis, the percentage of participants who were adults aged 18 years
or more and reported that they were suffering from mental health issues for more than 14 days in the last month
is considered as the response variable. The other variables on health characteristics, built environment features
and socio-economic characteristics are considered as the predictors or independent variables. Out of all the cat-
egories of the predictor variables, the pre-clinical health condition related variables are found to be highly cor-
related. To consider the effect of all the pre-clinical variables while having a bound on the number of dimensions,
we performed principal component analysis (PCA) (see Supplementary Information). PCA is an unsupervised
learning method that uses orthogonal transformations to convert a multidimensional data set of observations of
possibly correlated variables into a new multidimensional data set of values of linearly uncorrelated v ariables74.
PCA is useful for dimension reduction purpose, because a fewer orthogonal components of the transformed
data can capture most of the variance of the original data. In this research, we considered three principal compo-
nents as they were able to express 92% variability of the observations of the original 12 pre-clinical health related
variables taken into consideration.
Overview of statistical learning. Given a dataset with a response variable Y and a set of p predictor vari-
ables X = X1 , X2 , . . . , Xp, interpretable machine learning algorithms try to identify the function f that relates
the predictors with the response variable as, Y = f (X) + ǫ26. Here, ǫ is the irreducible error term that arises
Scientific Reports | (2021) 11:17548 | https://doi.org/10.1038/s41598-021-96801-x 10
Vol:.(1234567890)www.nature.com/scientificreports/
from unobserved heterogeneity from the data and is normally distributed N(µ, σ 2 ) where, µ = mean and σ 2
= variance25. Using the training data which is a known set of data points, a model is trained to estimate f and
using an unknown set of data points known as test data, the performance of the model is evaluated. In this study,
we implemented a suite of interpretable machine learning models, which can be crudely classified into three
categories, viz. (i) parametric models, (ii) semi-parametric models and (iii) non-parametric models. In para-
metric models, the problem of estimating the unknown function f gets reduced to estimating a set of parameters
through which the model is represented. On the other hand, the non parametric models make no assumption
about the unknown function. A semi-parametric model is a hybrid of parametric and non-parametric models.
More specifically, we implemented the following algorithms—
1. Parametric models Generalized Linear m
odel38, Ridge regression39 and Lasso regression40
2. Semi-parametric models Generalized additive m
odel41, multi adaptive regression s plines42,
3. Non-parametric models Random forest and gradient boosting method43 Bayesian additive regression t rees45
44
To achieve optimal generalization performance for an interpretable machine learning model, it’s complexity
should be controlled using the bias-variance trade off technique. Cross validation is the most widely used tech-
nique for balancing models’ bias and variance. In this study, the best model was selected using an 80–20 ran-
domized percentage holdout cross validation technique, where the models were trained on randomly selected
80% of the data set and the remaining 20% of the data set were used as holdout set to assess the out-of-sample
predictive performance of the models. This technique is repeated 30 times to ensure each data point of the
original data set is used at least once for training the models. The metrics used to compare the performances
of the models are R2, RMSE (root mean squared error) and MAE (mean absolute error). This method of model
selection is a well-established method and has been used in various previous s tudies7,27–30,32–34. In the following
section, we described the Bayesian additive regression trees, which is the best model found in our analysis, and
leave the discussion on other methods in the Supplementary Information.
Bayesian additive regression trees. Bayesian additive regression tree (BART) is a sum-of-trees model
where the outputs from m ‘small’ decision trees are aggregated with an underlying Bayesian probability model to
generate the response function45,75. Mathematically, BART can be expressed as,
�m
Y = g(X; Tj , Mj ) + ǫ ǫ ∼ N(0, σ 2 ). (1)
j=1
There are m distinct regression trees Tj with their terminal node parameters Mj . The function g(X; Tj , Mj )
assigns the leaf node parameters M of tree T to the independent variables X for all m trees. The main difference of
BART compared to other tree ensemble methods is that, BART develops on an underlying Bayesian probability
model and consists of a prior, likelihood and posterior probability space. The prior terms are responsible for the
tree structure, model complexity, regularization and incorporating expert knowledge in the model. Generally,
the Metropolis–Hastings algorithm is used to generate draws from the posterior probability space.
Model inference. Although the non-parametric models outperform parametric models in terms of predic-
tive performance, the improved predictability comes at the cost of reduced interpretability. However, statistical
inferencing can be conducted for the non parametric models using the variable importance ranking and partial
dependence plots (PDPs)26,45,75. The importance of the variables are depicted by the inclusion proportion of
the variables which denote the number of times a particular variable has been selected to develop the model.
To understand how a particular predictor variable affects the response variable, the PDPs are used. The PDP is
estimated as follows:
n
1
pj (xj ) = pj (xj , x−j , i). (2)
n
i=1
Here, p is the statistical response surface; n denotes the number of observations, x−j represents all the inde-
pendent variables except xj.
Scenario‑based sensitivity analysis. The scenario-based sensitivity analysis implemented in this study
involves a systematic approach of statistical simulation. First, the independent variable or the set of independ-
ent variables for which the scenario is to be created are selected. For each state, the best parametric distribution
that fits the sample data of independent variables (predictors) is identified using the Chi-squared goodness of fit
and method of moments for parameter e stimation76. After the best distribution(s) of the predictors(s) is identi-
fied, for each state random sampling is implemented to obtain the base case values (BV). Then, according to the
hypothesized scenario, the mean of the historical parametric distribution of the variable of interest is perturbed.
Then, using random sampling, new values are obtained from the new distribution with the shifted mean, which
corresponds to the hypothesized scenario. The original values of the variable are then substituted by the new val-
ues corresponding to the scenario while keeping all the other variables same as original. Following this, using the
selected statistical learning model, the percentage of population reporting poor mental health are predicted for
the new data set. Finally, we identify whether any significant nation-level and/or state-level increase or decrease
in the response (compared to the original response variable) is observed or not.
Scientific Reports | (2021) 11:17548 | https://doi.org/10.1038/s41598-021-96801-x 11
Vol.:(0123456789)www.nature.com/scientificreports/
Figure 6. Travel cost scenarios for % of adults aged > 18 years reporting poor mental health for > 14 days (K):
(a) �κ is plotted as the bars and K for base line scenario is plotted as gray scale intensity on the US map; and
for (b) K is plotted. The maps are created using Tableau 2021.2 (Tableau 2021.2 New Features) and Adobe
Illustrator (Software and services for creative business teams | Adobe Creative Cloud for teams).
As described before, in this paper, we considered five categories of variables representing socio-economic and
physical aspects of a built environment: (i) the economic status of a community characterized by incidence of
poverty, unemployment rate and household income, (ii) % of families in a community with no health insurance,
(iii) access to public health insurance, (iv) transport cost expressed as a % of income spent towards transportation,
and (v) housing vacancy. The mean of each variable’s historical distribution is perturbed 1σ (standard deviation)
of the variable. Corresponding to these sets of variables, ten hypotheses are created (see Table 2).
For each category of the independent variables, we validate our hypotheses by predicting Kscenario of hypothesis
denoting the “% adults aged > 18 suffering from poor mental health for > 14 days” under the specific scenario
of independent variable perturbation (e.g., economic depression) considered for a particular hypothesis (e.g.,
H1). The change in the response corresponding to this perturbed condition is captured by,
K = Kscenario of hypothesis − Kbase case scenario .
To normalize the effect of the base line response value, we consider �κ which captures the projected change
in % of adults aged > 18 years reporting poor mental health for > 14 days and expressed as a percentage of the
baseline estimates.
Kscenario of hypothesis − Kbase case scenario
�κ = × 100%.
Kbase case scenario
In Figs. 3, 4, 5, 6 and 7, the output of the sensitivity analysis has been depicted. The K is plotted in part (b)
of each figure, representing the exact projected change in K. For each figure, in part (a), the �κ is plotted as the
Scientific Reports | (2021) 11:17548 | https://doi.org/10.1038/s41598-021-96801-x 12
Vol:.(1234567890)You can also read