A Feature Fusion Method with Guided Training for Classification Tasks
←
→
Page content transcription
If your browser does not render page correctly, please read the page content below
Hindawi
Computational Intelligence and Neuroscience
Volume 2021, Article ID 6647220, 11 pages
https://doi.org/10.1155/2021/6647220

Research Article
A Feature Fusion Method with Guided Training for
Classification Tasks

 Taohong Zhang ,1,2 Suli Fan,1,2 Junnan Hu,1,2 Xuxu Guo,1,2 Qianqian Li,1,2 Ying Zhang,3
 and Aziguli Wulamu 1,2
 1
 Department of Computer, School of Computer and Communication Engineering,
 University of Science and Technology Beijing (USTB), Beijing 100083, China
 2
 Beijing Key Laboratory of Knowledge Engineering for Materials Science, Beijing 100083, China
 3
 QingGong College, North China University of Science and Technology, Tangshan, Hebei 064000, China

 Correspondence should be addressed to Taohong Zhang; zth_ustb@163.com and Aziguli Wulamu; 13911983933@163.com

 Received 30 December 2020; Revised 7 February 2021; Accepted 11 February 2021; Published 15 April 2021

 Academic Editor: Mario Versaci

 Copyright © 2021 Taohong Zhang et al. This is an open access article distributed under the Creative Commons Attribution
 License, which permits unrestricted use, distribution, and reproduction in any medium, provided the original work is
 properly cited.
 In this paper, a feature fusion method with guiding training (FGT-Net) is constructed to fuse image data and numerical data for
 some specific recognition tasks which cannot be classified accurately only according to images. The proposed structure is divided
 into the shared weight network part, the feature fused layer part, and the classification layer part. First, the guided training method
 is proposed to optimize the training process, the representative images and training images are input into the shared weight
 network to learn the ability that extracts the image features better, and then the image features and numerical features are fused
 together in the feature fused layer to input into the classification layer for the classification task. Experiments are carried out to
 verify the effectiveness of the proposed model. Loss is calculated by the output of both the shared weight network and classification
 layer. The results of experiments show that the proposed FGT-Net achieves the accuracy of 87.8%, which is 15% higher than the
 CNN model of ShuffleNetv2 (which can process image data only) and 9.8% higher than the DNN method (which processes
 structured data only).

1. Introduction (LRN), dropout, and data augmentation methods to im-
 prove the generalization ability of the network. AlexNet won
In order to identify objects directly from images, researchers the first place in the ILSVRC2012 [3], and CNNs have re-
have proposed convolutional neural network (CNN), a deep ceived extensive attention from researchers since then. After
learning model or multilayer perceptron which is like ar- AlexNet, many excellent CNN models have appeared, and
tificial neural networks, to regard each pixel of the image as a there are three main development directions: (a) deeper: the
feature. CNN is commonly used to analyze visual images. network layer is deeper, and the representative network is
The first generation of CNN is LeNet [1], proposed by LeCun VggNet [4], ResNet [5]; (b) modularization: a modular
in 1998. This network structure is proposed to solve the network structure (Inception), the representative network is
visual task of handwritten digit recognition, and it is one of GoogleNet [6], Inceptionv2 [7], Inceptionv3 [8], and
the most representative structures in early CNNs. Since then, Inceptionv4 [9]; (c) faster: lightweight network model, for
the most basic architecture of CNNs has been determined: mobile devices, representative networks are SqueezeNet
the convolutional layer, the pooling layer, and the fully [10], MobileNet [11], ShuffleNet [12], MobileNetv2 [13],
connected layer. In 2012, Alex Krizhevsky proposed the ShuffleNetv2 [14], and MobileNetv3 [15].
AlexNet [2] network structure, which proposed new acti- Images can provide feature information such as texture,
vation function (ReLU), local response normalization morphology, and color for CNNs. When extracting features
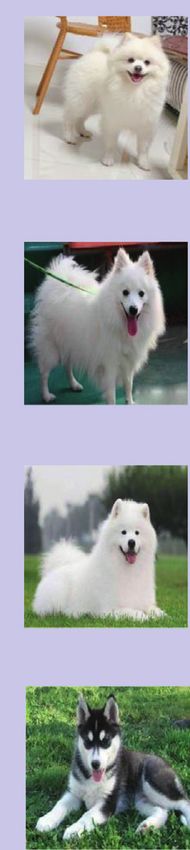
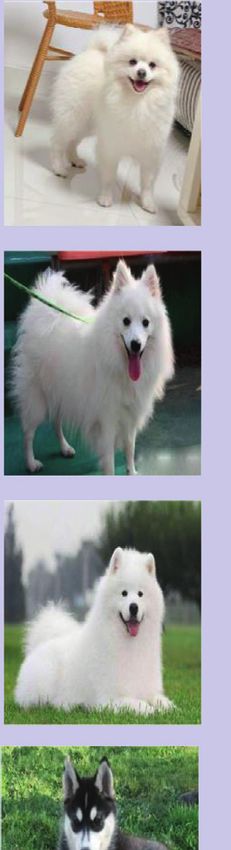
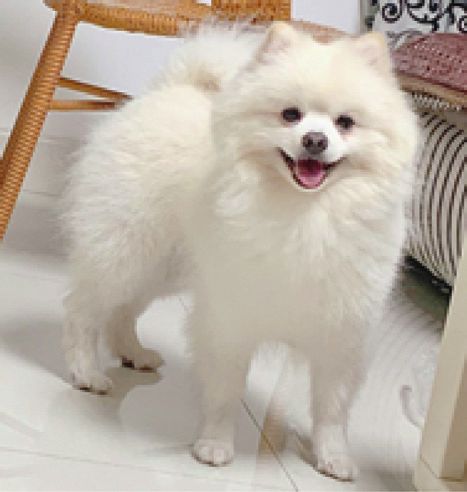
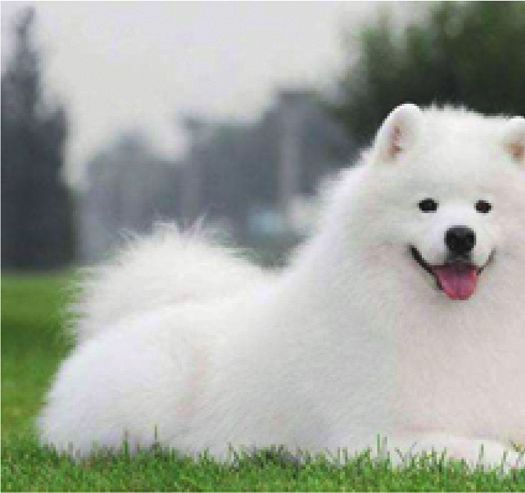
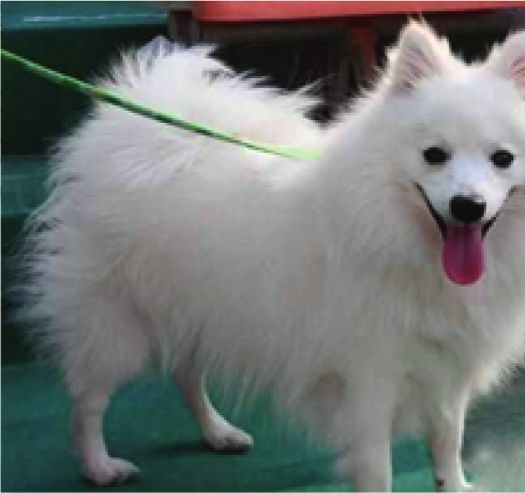
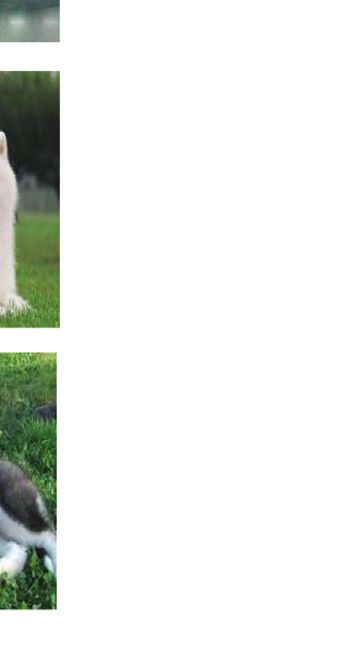
2 Computational Intelligence and Neuroscience

from images, images are always affected by various uncertain 2. Related Work
factors [16–18]. In order to reduce the impact of uncertainty,
researchers use some data enhancement methods [19–21]. 2.1. Intraclass and Interclass Variance. At present, the main
However, only image data is not adequate for some specific idea of classification of these categories with small gap is to
recognition tasks. For example, when a patient is diagnosed reduce the intraclass variance and increase the interclass
whether having a lung disease, the patient’s x-ray film in- variance. There are a lot of researches on reducing the
formation and the other clinical symptoms would be applied intraclass variance and increasing the interclass variance in
together to consider the patient’s condition and further the field of face recognition. When the traditional Softmax is
propose a treatment plan. Here, x-ray film information is used for training, the posterior probability of the sample’s
image data; the other clinical symptoms can be organized feature vector x (the input vector of the last fully connected
into structured data; the patient’s condition or diagnosis is layer) belongs to class i is ewi ∗x+bi/ nj�1 ewj ∗x+bj , where n is
the prediction result of classifier. In this case, image data is the number of classes, and w is weight of the last fully
not the unique and absolute criterion; the diagnosis should connected layer, b is bias. In [23–25], it is proposed to set bi
be made by the combination of image data and structured to 0, so wj ∗ x � ||wj || ∗ ||x|| ∗ cos(θj ); θj represents the
data. angle between x and the weight vector wj . In order to reduce
 Another example is about the recognition of three breeds the intraclass variance and increase the interclass variance,
of dogs, Pomeranian, Samoyed, and Japanese Spitz. If they the authors in [26] proposed L-Softmax by adding angle
are recognized only by images, as shown in Figure 1, it is constraint cos(mθ). On the basis of [26], SphereFace [23]
difficult to have a high recognition rate because they have normalized the module length of weight vector to 1. In order
similar textures, appearances, and colors in the images. But to further optimize the recognition effect, CosFace [24] and
the real sizes of the three dogs are different. The actual ArcFace [25] further normalized the module length of
physical sizes could not be objectively reflected by different feature vector x to 1, and further proposed margin term
images. Because it is hard for the shooting distances to be the cos(θ) − m in [24] and margin term cos(θ + m) in [25]. In
same in different images which are shot by different pho- addition, some researchers have proposed auxiliary loss
tographers and in different places. This kind of recognition function based on the existing loss function, such as Ringloss
problems should be executed by images and other infor- proposed by [27] and Qrthogonal loss function proposed by
mation together to obtain a high recognition accuracy. [28]. However, first of all, the same kind of images in face
 Therefore, in this paper, we design a novel framework to recognition comes from the same person, and the similarity
fuse image features (which are obtained by CNN method) is very large, while the images in our dataset belong to the
with numerical features (which are obtained from structured same category from different dogs, Therefore, the original
data) together to solve this kind of classification problems. dataset of face recognition has reduced the intraclass vari-
There are no such methods at present to combine CNN ance to a certain extent, while our dataset has larger
network with structured data in the same framework. intraclass variance, which makes classification more difficult.
Influenced by the idea of adaptive parameter selection in In addition, these face recognition researches, whether face
[22], the shared weight network is adopted as the training verification or face identify, in the actual recognition, either
part designed by guided training. The fused features become input two pictures for comparison to determine whether
a feature vector, which is input to the classifier. It should be they are the same identity (face verification), or input an
noted that our approach is effective for the problems which image, and compare with the existing image database, and
should be solved comprehensively by image data and determine whether the image belongs to the same category
structured data together. (face identify). In other words, face recognition needs an
 The contributions of this article are as follows: image database corresponding to the image to be recognized.
 The purpose of our research is to input only one sample and
 (1) A fusion framework FGT-Net is proposed, which has output the corresponding category of the sample directly;
 the capability of fusing image data and numerical that is, we do not need to compare the sample database, so
 data to enhance the representativeness of features for our task of identification is more difficult.
 the further classification.
 (2) A guided training method is proposed. The training
 method can promote the framework to learn the 2.2. Multisize Detecting. Recently, there are many methods
 features of images, so that the features of images for detecting multi size targets. Singh and Davis [29] pro-
 belonging to the same class are as the same as posed scaling an image at different scales, extracting features
 possible. at each scale, and fusing all features. The study in [30]
 detected the feature map of different resolutions, combined
 (3) The function of CNN structure is extended to struc-
 the prediction of multiple feature maps, and processed
 tured data except for image data. It increases the ability
 targets of various sizes. Cai et al. [31] used features of dif-
 of CNN to process image data and structured data at the
 ferent resolutions to detect targets of different scales. The
 same time and solves some specific problems which
 study in [32] combined bottom-up and top-down features to
 cannot be accurately classified according to images only.
 detect targets with different scales on different levels of
 There are many acronyms in this paper. The full names of feature maps. We find that these methods can only detect
all acronyms in this paper are listed in Table 1. objects of different sizes in the same image. If two objects
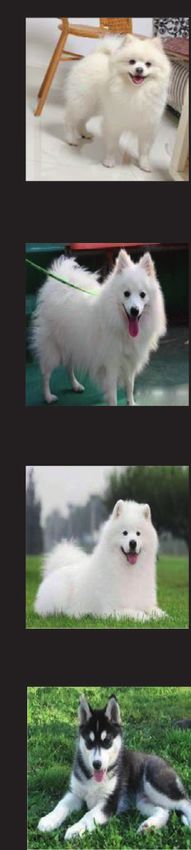
Computational Intelligence and Neuroscience 3

 (a) (b) (c)

 Figure 1: The image examples of Pomeranian (a), Japanese Spitz (b), and Samoyed (c).

 Table 1: Acronyms and full names in this paper.
Acronyms Full names
FGT-Net Feature fusion network with guided training
CNN Convolutional neural network
LRN Local response normalization
DDE Dynamic differential entropy
AHNF Attribute heterogeneous network fusion
DFF-ADML Deep feature fusion method based on adaptive discriminant metric learning
GAN Generative adversarial network
MF-Net Multifeature fusion neural network
SWN Shared weight network

come from two images, these methods cannot distinguish classification accuracy by combining the classification ability
the size of the two objects, because the scenes taken in these of multiple classifiers. Lai et al. [40] controlled the traffic
two pictures may be different. One may be obtained from a lights by fusing the signals of traffic lights on different roads,
distance from the camera, and the other may be obtained to improve the congestion of the whole road network. Bin
from a relatively close distance. The paper [33] proposed a et al. [41] proposed using two deep neural networks to
dynamic differential entropy (DDE) algorithm to extract the extract the features of urban structured numerical data and
features of electroencephalogram signals. After that, the housing property structured data, respectively, and then fuse
extracted DDE features were classified by convolutional the two type features to achieve more accurate property
neural networks. Therefore, here, we propose using auxiliary value assessment for the real estate industry. Ma et al. [42]
information to help further classification, such as weight and proposed an unsupervised framework based on generative
age, by fusing the features to distinguish objects in different adversarial network (GAN) [43] to realize the fusion of
images. To judge the three classes of dogs, only image data panchromatic images and low-resolution multispectral
are not adequate. The supplement data, for example, real size images, to obtain high-resolution multispectral images. Shao
or weight, need to be fused. et al. [44] proposed an enhancement deep feature fusion
 method for fault diagnosis of rotating machinery. This
 method can fuse the features of different layers from images
2.3. Feature Fusion. There have been some advances in the by neural network to further improve the quality of learning
direction of feature fusion. The study in [34] fuses textual features. Gómez-Rı́os et al. [45] built a classifier which can
data and structured numerical data to improve the recog- use two kinds of images, namely, texture image and structure
nition effect, and this feature fusion method improves the image, to identify the species of corals. The method first
accuracy of heart disease diagnosis. Yu et al. [35] proposed a identifies whether the input image is texture image or
generic data fusion model called attribute heterogeneous structure image by a ResNet model, and then constructs a
network fusion (AHNF), which encodes various internal ResNet model for texture image and structure image, re-
relations between objects and fuses information from spectively, to identify coral species. Wu and Li [46] proposed
multiple data sources. Wang et al. [36] proposed a deep an automatic architecture for detecting various kidney ab-
feature fusion method based on adaptive discriminant normalities, in which a multifeature fusion neural network
metric learning (DFF-ADML) to fuse different deep feature (MF-Net) was used to extract distinctive features for mul-
vectors of the same image. Cai et al. [37] constructed global tiple views of images based on two input images.
feature vectors by fusing different images of the same object All these studies have proved the importance of infor-
to achieve feature fusion. Tabik et al. [38] and Pan et al. [39] mation fusion, but there has never been a study on the fusion
achieved feature fusion by fusing feature vectors obtained of image data and structured numerical data. In this paper, a
from multiple classification network models, and improved novel network structure model, FGT-Net, is proposed to
4 Computational Intelligence and Neuroscience

improve the recognition rate of classification tasks by numerical data, so that the proposed model can utilize
combining numerical data with image data. features as many as possible for the further classification.
 The features from numerical data and the features
3. Proposed Approach extracted by image processing techniques are both numerical
 values. The feature vector extracted from the image is
The framework of FGT-Net is proposed and constructed to Xt � (xt1 , xt2 , . . . , xtn ) ∈ Rn ; Rn represents an n-dimensional
achieve this combined function. The structure of the FGT- vector. As shown in Section 2.1, Xt is the output of SWN2. It
Net model is shown in Figure 2. It has three layers: shared is the feature extracted by shared weight network layer and
weight network (SWN) layer, feature fusion layer, and expressed as a vector. Suppose the features obtained from
classification layer. The function of shared weight network numerical data are denoted as Xe � (xe1 , xe2 , . . . , xem ) ∈ Rm ;
layer is to extract the feature vector of the image. Feature Rm represents an m-dimensional vector. The feature fusion is
fusion layer is used to fuse the extracted image features and realized by the concatenation of Xe and Xt , and result is
the numerical data features (features beyond the image) of represented by Xf that is an (m + n)-dimensional vector. The
the target to enhance the representativeness of the target feature fusion is realized by the following formula:
features. After feature fusion, classification layer is used to
 Xf � Xt ⊕Xe � xt1 , xt2 , . . . , xtn , xe1 , xe2 , . . . , xem ,
classify the fused features and output the classification re-
sults. The training method of FGT-Net model is new: guided Xf ∈ Rn+m ,
training. Moreover, the structures of models applied for
 (2)
training and testing are slightly different. The detailed
processes are described as follows. The structure of the FGT- where the elements (xt1 , xt2 , . . . , xtn ) of Xt and the elements
Net is introduced in Section 3.1, Section 3.2, and Section 3.3. (xe1 , xe2 , . . . , xem ) of Xe construct a new vector
The introduction of guided training and test is in Section 3.4. (xt1 , xt2 , . . . , xtn , xe1 , xe2 , . . . , xem ) to express the fused
 feature vector Xf .
3.1. Shared Weight Network Layer. As shown in Figure 2,
Shared weight network layer consists of two identical CNNs, 3.3. Classification Layer. After the combination of the above
which are represented as SWN1 and SWN2, respectively, image mapped features and numerical features, we can
and they share weights. In the training, the input of SWN1 is complete our classification task based on the fused features. We
representative image set XXinput , and the input of SWN2 is use several fully connected layers to achieve classification. Each
the picture in the training set Xinput . In the test, only SWN2 neuron in the fully connected layer is fully connected with all
is used to extract the image features. Representative image the neurons in the previous layer. In order to improve network
set refers to the image set composed of one image of each performance, the activation function of each neuron in the fully
class. If there are C classes, the representative image set connected layer generally uses the ReLU function [48]. The last
contains C images. Therefore, SWN1 outputs the feature fully connected layer is the output layer, usually using the
vector set XXs � (Xs1 , Xs2 , . . . , XsC ) of the representative Softmax function as the activation function. The output layer
image set, and SWN2 outputs the feature vector Xt of the implements the final classification. The input of classification
training image. Here, Xt , Xs1 , Xs2 , and so on are all n-di- layer is Xf and the output is YO � (yO1 , yO2 , . . . , yOC ), a
mensional vectors, for example, Xt � (xt1 , xt2 , . . . , xtn ), C-dimensional feature vector in which the dimension is the
 Xs1 � (xs11 , xs12 , . . . , xs1n ). The purpose of designing such a same as the total number of classes. In order to make the model
shared weight network layer is to make the network learn the have better classification ability, cross-entropy loss function like
features of each image class more directionally, that is, to in [49] is used in this paper:
 C
learn the characteristics of specific categories of images from
the representative image set, so that the features of the same Loss2 � loss YO , Y � − yi log yOi . (3)
 i�1
image class are closer. In order to achieve our goal, a distance
loss function like in [47] the following equation is designed Here, Y � (y1 , y2 , . . . , yC ) represents the label of Xinput ,
in the output part of shared weight network layer: where yn � 1 if the class of Xinput is n; for the rest, y � 0.
 Loss1 can make the features of the same kind of images
 1 n output by the model closer to each other, while Loss2 is the
 Loss1 � loss Xsc , Xt � x − xti 2 . (1)
 n i�1 sci cross-entropy loss used by general classification models. In
 order to make the model have better classification ability, we
 Here, Xt � (xt1 , xt2 , . . . , xtn ) represents the output of set the loss function to guide the model training as the sum
SWN2, XXs � (Xs1 , Xs2 , . . . , XsC ) represents the output of of distance loss and classification loss, which is represented
SWN1, c represents the real class of input image Xinput , C by Losstotal :
represents the total number of classes, and n represents the
 Losstotal � Loss1 + Loss2. (4)
dimensions of Xsc and Xt .

3.2. Feature Fusion Layer. Feature fusion refers to the fusion 3.4. Guided Training and Test. Inspired by the method of
of feature vectors of training images extracted from shared guided filtering in [50], we adopt an unconventional training
weight network layer and feature vectors composed of other method: guided training, which is more conducive to model
Computational Intelligence and Neuroscience 5

 Shared weight network layer

 Representative images

 SWN1
 XXs
 Loss1
 Shared weights

 Classification
 layer

 SWN2 Xt
 Dataset

 Weight (kg) Age ... Yo
 Loss2
 5.0 3.0 ...
 Xf
 26.5 1.0 ...
 Xe True label
 11.2 2.0 ...
 Feature fusion layer
 Numerical data
 Figure 2: The framework of the FGT-Net model.

learning. Firstly, an image from each class in the dataset is learn the ability to obtain the image features during the
selected as the representative image set. The remaining training process, so that the characteristics of the images
images are divided into training set and test set according to belonging to the same category are closer. Once the training
a certain proportion. Firstly, the representative image set is is finished, the model has such ability, so this network layer is
input into SWN1 to obtain the corresponding feature vector not needed in the test. When testing, we only need to put the
group XXs � (Xs1 , Xs2 , . . . , XsC ); the image in the training image into SWN2, and then we can get the classification
set is input into SWN2 to obtain the feature vector result of the image through one forward propagation.
Xt � (xt1 , xt2 , . . . , xtn ). So far, the model can calculate the
Loss1. In this way, the feature vectors generated by shared 4. Experiments
weight network layer can be guided to be closer to the feature
vectors of the same class in the representative image set, and In order to verify the performance of the FGT-Net model
let feature vectors generated by the images belonging to the method, experiments were conducted and the results of
same class in the model closer. This is the main purpose of these experiments are shown below. The results of these
our proposed guided training. Then, in order to solve the experiments show that the FGT-Net framework can solve
problem that only using images cannot correctly identify the classification objects. The accuracy of our FGT-Net
specific tasks (such as medical diagnosis), we propose feature (fused with image data and structured data) is higher than
fusion. The fusion feature vector Xf is obtained by fusing the CNNs (with only image data).
feature vector Xt obtained from SWN2 and the feature
vector Xe composed of additional numerical data. Finally,
the classification layer is used to classify the fused feature 4.1. Dataset. The images used in the experiment are col-
vector Xf to get the classification result: YO . In this paper, lected from the Internet, the numerical data used are
the cross-entropy loss Loss2 is used to calculate the classi- artificially generated according to the actual situation of
fication loss, which makes the model learn better classifi- each dog, and a dataset was made as shown at the end of this
cation ability. paper. There are four classes of data in the dataset, in-
 In the test, SWN1 is no longer used shown in Figure 3, cluding class 0 (Japanese Spitz), class 1 (Pomeranian), class
because the function of the SWN1 is to guide the model to 2 (Samoyed), and class 3 (Husky). Each data in the dataset
6 Computational Intelligence and Neuroscience

 Pomeranian
 Feature fusion

 SWN2 Xt
 Japanese spitz

 Weight (kg) Age ...
 5.0 3.0 ...
 Xf
 26.5 1.0 ...
 Xe Samoyed
 11.2 2.0 ...
 Test images
 Numerical data

 Husky

 Figure 3: The FGT-Net model used in test.

contains an image and 3 structured numerical data: sex, data corresponding to each image in the dataset are also
weight, and age. Sex is represented by 0 and 1 (0 for male constituted into a numerical feature vector. There are 3
and 1 for female). The unit of weight is kg. Samoyed’s numerical features in this experiment, so the numerical
weight is less than 30 kg, Japanese Spitz’s weight is below feature vector is a 3-dimensional feature vector. Second, the
10 kg, Pomeranian’s weight is below 3.5 kg, and Husky’s above 1024-dimensional image feature vector and 3-di-
weight is below 30 kg. Age is based on months. If the age is mensional numerical feature vector are converted into a
less than 15 days, it is calculated as half a month, that is, 0.5 1027-dimensional feature vector using the feature fusion
months. If it is more than 15 days, it is calculated as one method described in Section 2.2; then, the feature fusion is
month. completed. Finally, two full connection layers and an output
 Among the dataset, representative image set includes 1 layer are added to the model, with 512 neurons, 256 neurons,
image of Japanese Spitz, 1 image of Pomeranian, 1 image of and 4 neurons (corresponding to the output of 4 classes),
Samoyed and 1 image of Husky, training set including 186 respectively. The combined 1027-dimensional feature vector
images of Japanese Spitz, 107 images of Pomeranian, 330 is used to complete the recognition of the object in the input
images of Samoyed, and 353 images of Husky, and test set image.
includes 46 images of Japanese Spitz, 27 images of Pom- The whole training process is carried out on GPU. The
eranian, 84 images of Samoyed, and 89 images of Husky. loss function described in Sections 2.1 and 2.3 was used in
Some examples of the data in the dataset are shown in the training of the model. Adam [51] was used as the op-
Figure 4. timizer; the initial learning rate is 0.001. There were 32
 samples in each training batch of the model, 100 epochs were
 trained for the whole training set, and the model parameters
4.2. The Model. The model used in the experiment is de- were updated 3100 times. The training and validation ac-
scribed in this section. curacy figures are shown in Figure 5, and the training and
 First, for shared weight network layer, SWN1 and SWN2 validation loss figures are shown in Figure 6. As shown in
are built for features extraction based on ShuffleNetv2. Only Figures 5 and 6, the model converges gradually, and the
the front of the full connection layer of ShuffleNetv2 is used, change trend of the two curves is basically the same, which
that is, only the portion from the input layer to the average shows that the model can learn the characteristics of par-
pooling layer. After the mapped features extraction, each ticles from the training dataset and can accurately identify
input image can be transformed into a 1024-dimensional the unknown wear particle samples in the verification
feature vector, which represents the mapped image features. dataset. Finally, the performance of the model is evaluated
At the same time, other numerical features from structured on the test set.
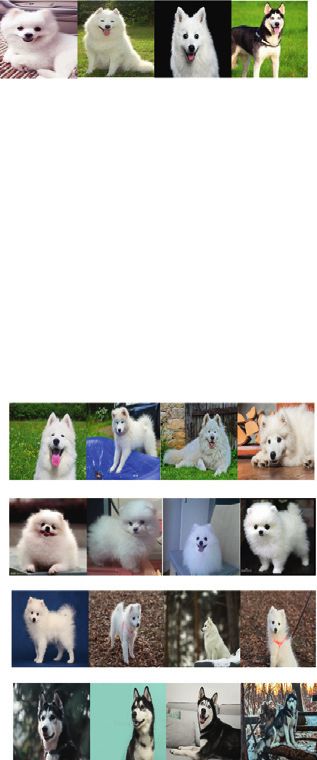
Computational Intelligence and Neuroscience 7

 Image Weight Age Sex Image Weight Age Sex

 5.8 5.5 0 25.5 9.5 0

 6.6 6 0 17.4 7 0

 9.5 8 0 22.4 9 1

 3.8 3.5 1 21.5 8.5 1

 7.8 6.5 1 6.5 4 0

 (a) (b)

 Image Weight Age Sex Image Weight Age Sex

 1.5 3 1 18.5 8.5 1

 1.4 2 0 21.5 15 1

 2.2 5 0 22.1 9 1

 1.2 2.5 0 14.2 6.5 0

 2.8 9 1 17.5 7.5 0

 (c) (d)

Figure 4: Data examples in the dataset. (a) Japanese Spitz data example (class 0), (b) Pomeranian data example (class 1), (c) Samoyed data
example (class 2), and (d) Husky data example (class 3).

4.3. Guided Training. The purpose of this part of the ex- 4.4. Discussion of Feature Fusion. In order to compare the
periment is to prove that the guided training is more performance of feature fusion, the comparison experiments
conducive to the final classification of the model. We were conducted with the same hyperparameter setting. In
designed two experiments to compare, Experiment 1: only the first comparison experiment, only image data was used
using SWN2 and classification layer, using training set to train CNN model (here ShuffleNetv2 is utilized) to predict
training model, test set testing; Experiment 2: using SWN1, the classes of dogs. In the second comparison experiment,
SWN2, and classification layer. The representative image set only structured numerical data was used to train a simple 5-
and training set are used to train the model, and the test set is layer-deep fully connected neural network (DNN) to predict
used to test the model. Experiment 2 uses the guided training the classes of dogs. The final experimental results are shown
method to train. The only difference between Experiment 1 in Table 3. As can be seen from the experimental results,
and Experiment 2 is whether to use SWN1 and represen- CNN model with only image data has relatively low rec-
tative image set. The experimental results are shown in ognition accuracy for Pomeranians and Japanese Spitzes
Table 2. It shows that the classification accuracy of the model when only image data was used to identify the classes of
with guided training method (Experiment 2) is higher than dogs. This is because the appearance, texture, color, and
that of the model learned by ordinary self-training mode other characteristics of Japanese Spitzes and Pomeranians
(Experiment 1). It is proved that the training mode designed are very similar, so only using these characteristics extracted
is more beneficial to the model training. from CNN model cannot accurately identify them.
8 Computational Intelligence and Neuroscience

 FGT-Net
 1
 0.8

 Accuracy
 0.6
 0.4
 0.2
 0

 1
 201
 401
 601
 801
 1001
 1201
 1401
 1601
 1801
 2001
 2201
 2401
 2601
 2801
 3001
 Iterations
 Validation
 Train
 Figure 5: Training and verification accuracy with the number of iterations.

 FGT-Net
 2.5
 2
 1.5
 Loss

 1
 0.5
 0
 1
 201
 401
 601
 801
 1001
 1201
 1401
 1601
 1801
 2001
 2201
 2401
 2601
 2801
 3001
 Iterations
 Validation
 Train
 Figure 6: Training and verification loss with the number of iterations.

 Table 2: The accuracy and other performance evaluation indexes of Experiment 1 and Experiment 2 of guided training.
Experiment Class TP FP FN Precision Recall F1-score Accuracy
 Japanese Spitz 10 9 36 0.526 0.217 0.308
 Pomeranian 9 4 18 0.692 0.333 0.450
Experiment 1 0.707
 Samoyed 69 49 15 0.585 0.821 0.683
 Husky 86 10 3 0.896 0.966 0.930
 Japanese Spitz 18 9 28 0.667 0.391 0.493
 Pomeranian 15 8 12 0.652 0.556 0.600
Experiment 2 0.728
 Samoyed 63 38 21 0.623 0.750 0.681
 Husky 83 12 6 0.873 0.933 0.902

Moreover, when only structured numerical data was used to structured numerical data. Secondly, although Huskies and
identify the classes of dogs, DNN model tends to confuse Samoyeds are similar in weight, their appearance, texture,
Huskies and Samoyeds, and the identification accuracy of color, or other features are quite different, so they can be
Huskies and Samoyeds is relatively low. This is because these identified by using image data features. Therefore, the FGT-
two kinds of dogs are very similar in weight features; they Net model can use both image data and structured nu-
cannot be well identified only by these structured numerical merical data to identify the classes of dogs. As shown in
features. However, when the FGT-Net model was used to Table 3, the recognition accuracy of the FGT-Net model
combine image data and structured numerical data, the two reaches 87.8%, the recognition accuracy of CNN (Shuf-
problems can be solved well. Firstly, although Pomeranians fleNetv2) model which is learned only by image data is
and Japanese Spitzes are similar in appearance, texture, 72.8%, and the recognition accuracy of the DNN model
color, and other characteristics, their weight features are which is learned only by structured numerical data is 78.0%.
quite different (Pomeranian is small sized dog and relatively From these experimental results, we can see that the FGT-
light in weight; Japanese Spitz is medium sized dog and Net model can identify not only Pomeranians and Japanese
relatively heavy), so they can be identified by using Spitzes well, but also Huskies and Samoyeds well.

Computational Intelligence and Neuroscience 9

 Table 3: The accuracy and other performance evaluation indexes of models with fused data and separate data.
Model Class TP FP FN Precision Recall F1-score Accuracy
 Japanese Spitz 40 6 6 0.870 0.870 0.870
 Pomeranian 27 6 0 0.818 1.000 0.900
FGT-Net (fused data) 0.878
 Samoyed 71 9 13 0.888 0.845 0.866
 Husky 78 9 11 0.897 0.876 0.886
 Japanese Spitz 18 9 28 0.667 0.391 0.493
 Pomeranian 15 8 12 0.652 0.556 0.600
CNN (ShuffleNetv2) (only image data) 0.728
 Samoyed 63 38 21 0.623 0.750 0.681
 Husky 83 12 6 0.873 0.933 0.902
 Japanese Spitz 45 0 1 1.000 0.978 0.989
 Pomeranian 27 1 0 0.964 1.000 0.982
DNN (only structured data) 0.780
 Samoyed 46 15 38 0.754 0.548 0.634
 Husky 74 38 15 0.661 0.831 0.736

 Table 4: Accuracy comparison with other advanced models. the fusion of image level features and numerical features
 extracted from structured data. The accuracy of the model
Model FGT-Net AlexNet VGG16 ResNet50 with guided tra[[parms resize(1),pos(50,50),si-
Accuracy 0.878 0.728 0.691 0.675 ze(200,200),bgcol(156)]]et is 2.1% higher than that of the
 model without guided training. The accuracy of FGT-Net
 reaches 87.8%, which is 15% higher than CNN model of
 Table 5: Time comparison with other advanced models. ShuffleNetv2 (which can process image data only) and 9.8%
 higher than DNN method (which processes structured data
Model FGT-
(s) Net
 AlexNet ShuffleNetV2 VGG16 ResNet50 only). The proposed model is feasible for the future appli-
 cations in the fields of industry or medical diagnosis which
Time 10.39 10.57 10.31 11.66 10.91
 are considered by the merging of image data and structured
 data together. And the framework of the proposed model
 can extend the processing ability of CNNs for the merging of
 Because ShuffleNetV2 belongs to lightweight net- image data and structured data.
work, the network level is not deep. In order to further
prove the effectiveness of our method, we compare FGT-
Net with other well-known CNNs (ResNet50, VGG16, Data Availability
and AlexNet). As shown in Table 4, FGT-Net achieves the
 The data used in the experiment were collected from public
highest accuracy, because FGT-Net is based on the fused
 on the Internet and we have built a dataset. The dataset is
features of image data and structured data. The other
 available at https://github.com/Fan-Suli/Datasets.
CNN models (ResNet50, VGG16, and AlexNet) are
produced with only image data. It proves that our method
is effective in solving the problems with comprehensive Conflicts of Interest
data merged by image and structured data. Our method is
 The authors declare that they have no conflicts of interest
a framework based on CNN structure, so it enlarges the
 regarding the present study.
function of CNN models. In terms of test time, as shown
in Table 5, FGT-Net is faster than other models except
that it is 0.08 seconds slower than ShuffleNetV2. Acknowledgments
Therefore, FGT-Net not only improves the accuracy, but
 The authors thank Yue Gao and Yue Zhao for their support
also improves the speed.
 and assistance in this study. This work was sponsored by the
 National Study Abroad Fund of China and supported by the
5. Conclusion National Key Research and Development Program of China
In some recognition tasks, there is a problem that images (2017YFB1002304) and Fundamental Research Funds for
 the Central Universities (FRF-GF-20-16B).
could not be the only criteria for classification, or objects
from different images cannot be well classified by CNN due
to the similar features (color, texture, appearance, etc.). In References
order to solve these kinds of problems, a novel FGT-Net
 [1] Y. LeCun, L. Bottou, Y. Bengio, and P. Haffner, “Gradient-
framework that can combine image data and structured
 based learning applied to document recognition,” Proceedings
numerical data is proposed. A guided training is adopted for of the IEEE, vol. 86, no. 11, pp. 2278–2324, 1998.
the learning process so that the feature vectors generated by [2] A. Krizhevsky, I. Sutskever, and G. E. Hinton, “Imagenet
the similar targets are closer to each other. Therefore, FGT- classification with deep convolutional neural networks,”
Net could surpass the ordinary training method and obtain Advances in Neural Information Processing Systems, vol. 25,
higher recognition accuracy. Experiments are executed for no. 2, 2012.
10 Computational Intelligence and Neuroscience

 [3] J. Deng, W. Dong, R. Socher, L. Li, K. Li, and L. Fei-Fei, [19] Y. Qu, Q. Fu, C. Shang et al., “Fuzzy-rough assisted refine-
 “ImageNet: a large-scale hierarchical image database,” in ment of image processing procedure for mammographic risk
 Proceedings of the 2009 IEEE Conference on Computer Vision assessment,” Applied Soft Computing, vol. 91, Article ID
 and Pattern Recognition, pp. 248–255, Miami, FL, USA, June 106230, 2020.
 2009. [20] H. Lu, M. Zhang, and X. Xu, “Deep fuzzy hashing network for
 [4] K. Simon and A. Zisserman, “Very deep convolutional net- efficient image retrieval,” IEEE Transactions on Fuzzy Systems,
 works for large-scale image recognition,” 2014, https://arxiv. vol. 29, no. 1, 2020.
 org/abs/1409.1556. [21] M. Cacciola, S. Calcagno, F. C. Morabito, and M. Versaci,
 [5] K. He, X. Zhang, S. Ren, and J. Sun, “Deep residual learning “Swarm optimization for imaging of corrosion by impedance
 for image recognition,” in Proceedings of the 2016 IEEE measurements in eddy current test,” IEEE Transactions on
 Conference on Computer Vision and Pattern Recognition Magnetics, vol. 43, no. 4, pp. 1853–1856, 2007.
 (CVPR), pp. 770–778, Las Vegas, NV, USA, July 2016. [22] W. Deng, H. Liu, J. Xu, H. Zhao, and Y. Song, “An improved
 [6] C. Szegedy, “Going deeper with convolutions,” in Proceedings quantum-inspired differential evolution algorithm for deep
 of the 2015 IEEE Conference on Computer Vision and Pattern belief network,” IEEE Transactions on Instrumentation and
 Recognition (CVPR), pp. 1–9, Boston, MA, USA, June 2015. Measurement, vol. 69, no. 10, pp. 7319–7327, 2020.
 [7] S. Ioffe and C. Szegedy, “Batch normalization: accelerating [23] W. Liu, Y. Wen, Z. Yu, M. Li, B. Raj, and L. Song,
 deep network training by reducing internal covariate shift,” ““Sphereface: deep hypersphere embedding for face recog-
 2015, https://arxiv.org/abs/1502.03167. nition,” in Proceedings of the 2017 IEEE Conference on
 [8] C. Szegedy, V. Vanhoucke, S. Ioffe, J. Shlens, and Z. Wojna, Computer Vision and Pattern Recognition, pp. 212–220,
 “Rethinking the inception architecture for computer vision,” Honolulu, HI, USA, July 2017.
 in Proceedings of the 2016 IEEE Conference on Computer [24] F. Wang, J. Cheng, W. Liu, and H. Liu, “Additive margin
 Vision and Pattern Recognition (CVPR), pp. 2818–2826, Las softmax for face verification,” IEEE Signal Processing Letters,
 Vegas, NV, USA, July 2016. vol. 25, no. 7, pp. 926–930, 2018.
 [9] C. Szegedy, S. Ioffe, and V. Vanhoucke, “Inception-v4, in- [25] J. Deng, J. Guo, N. Xue, and S. Zafeiriou, “Arcface: additive
 ception-resnet and the impact of residual connections on angular margin loss for deep face recognition,” in Proceedings
 learning,” in Proceedings of the Thirty-first AAAI conference on of the 2019 IEEE Conference on Computer Vision and Pattern
 artificial intelligence, San Francisco, CA, USA, February 2017.
 Recognition, pp. 4690–4699, Long Beach, CA, USA, June 2019.
[10] F. N. Iandola, S. Han, and M. W. Moskewicz, “SqueezeNet: [26] W. Liu, Y. Wen, Z. Yu, and M. Yang, “Large-margin softmax
 AlexNet-level accuracy with 50x fewer parameters and
 loss for convolutional neural networks,” in Proceedings of the
Computational Intelligence and Neuroscience 11

 ensemble deep learning and feature fusion,” Information
 Fusion, vol. 63, pp. 208–222, 2020.
[35] G. Yu, Y. Wang, J. Wang, C. Domeniconi, M. Guo, and
 X. Zhang, “Attributed heterogeneous network fusion via
 collaborative matrix tri-factorization,” Information Fusion,
 vol. 63, pp. 153–165, 2020.
[36] C. Wang, G. Peng, and B. De Baets, “Deep feature fusion
 through adaptive discriminative metric learning for scene
 recognition,” Information Fusion, vol. 63, pp. 1–12, 2020.
[37] H. Cai, Z. Qu, Z. Li, Y. Zhang, X. Hu, and B. Hu, “Feature-
 level fusion approaches based on multimodal EEG data for
 depression recognition,” Information Fusion, vol. 59,
 pp. 127–138, 2020.
[38] S. Tabik, R. F. Alvear-Sandoval, and M. M. Ruiz, “MNIST-
 NET10: a heterogeneous deep networks fusion based on the
 degree of certainty to reach 0.1% error rate ensembles
 overview and proposal,” Information Fusion, vol. 62,
 pp. 73–80, 2020.
[39] Y. Pan, L. Zhang, X. Wu, and M. J. Skibniewski, “Multi-
 classifier information fusion in risk analysis,” Information
 Fusion, vol. 60, pp. 121–136, 2020.
[40] J. W. Lai, J. Chang, L. K. Ang, and K. H. Cheong, “Multi-level
 information fusion to alleviate network congestion,” Infor-
 mation Fusion, vol. 63, pp. 248–255, 2020.
[41] J. Bin, B. Gardiner, E. Li, and Z. Liu, “Multi-source urban data
 fusion for property value assessment: a case study in Phila-
 delphia,” Neurocomputing, vol. 404, pp. 70–83, 2020.
[42] J. Ma, W. Yu, C. Chen, P. Liang, X. Guo, and J. Jiang, “Pan-
 GAN: an unsupervised pan-sharpening method for remote
 sensing image fusion,” Information Fusion, vol. 62, pp. 110–
 120, 2020.
[43] I. Goodfellow, J. Pouget-Abadie, and M. Mirza, “Generative
 adversarial nets,” Advances in Neural Information Processing
 Systems, pp. 2672–2680, MIT Press, Cambridge, MA, USA,
 2014.
[44] H. Shao, H. Jiang, F. Wang, and H. Zhao, “An enhancement
 deep feature fusion method for rotating machinery fault di-
 agnosis,” Knowledge-Based Systems, vol. 119, pp. 200–220,
 2017.
[45] A. Gómez-Rı́os, S. Tabik, J. Luengo, A. S. M. Shihavuddin, and
 F. Herrera, “Coral species identification with texture or
 structure images using a two-level classifier based on Con-
 volutional Neural Networks,” Knowledge-Based Systems,
 vol. 184, Article ID 104891, 2019.
[46] Y. Wu and Z. Yi, “Automated detection of kidney abnor-
 malities using multi-feature fusion convolutional neural
 networks,” Knowledge-Based Systems, vol. 200, Article ID
 105873, 2020.
[47] M. M. Deza and E. Deza, Encyclopedia of Distances, Springer,
 Berlin, Germany, 2009.
[48] X. Glorot, A. Bordes, and Y. Bengio, “Deep sparse rectifier
 neural networks,” in Proceedings of the Fourteenth Interna-
 tional Conference on Artificial Intelligence and Statistics,
 pp. 315–323, Ft. Lauderdale, FL, USA, 2011.
[49] X. Li, L. Yu, D. Chang, Z. Ma, and J. Cao, “Dual cross-entropy
 loss for small-sample fine-grained vehicle classification,” IEEE
 Transactions on Vehicular Technology, vol. 68, no. 5,
 pp. 4204–4212, 2019.
[50] S. Liu, T. Liu, L. Li, Q. Hu, J. Zhao, and C. Wang, “Con-
 volutional neural network and guided filtering for SAR image
 denoising,” Remote Sensing, vol. 11, no. 6, pp. 702–720, 2019.
[51] D. Kingma and J. Ba, “Adam: a method for stochastic opti-
 mization,” 2015, https://arxiv.org/abs/1412.6980.
You can also read