Deciphering Bitcoin Blockchain Data by Cohort analysis
←
→
Page content transcription
If your browser does not render page correctly, please read the page content below
www.nature.com/scientificdata

               OPEN           Deciphering Bitcoin Blockchain
Data Descriptor               Data by Cohort Analysis
                                                                   1,2,5 ✉
                              Yulin Liu1,4,5, Luyao Zhang                    & Yinhong Zhao1,3,5

                              Bitcoin is a peer-to-peer electronic payment system that has rapidly grown in popularity in recent years.
                              Usually, the complete history of Bitcoin blockchain data must be queried to acquire variables with
                              economic meaning. This task has recently become increasingly difficult, as there are over 1.6 billion
                              historical transactions on the Bitcoin blockchain. It is thus important to query Bitcoin transaction data
                              in a way that is more efficient and provides economic insights. We apply cohort analysis that interprets
                              Bitcoin blockchain data using methods developed for population data in the social sciences. Specifically,
                              we query and process the Bitcoin transaction input and output data within each daily cohort. This
                              enables us to create datasets and visualizations for some key Bitcoin transaction indicators, including
                              the daily lifespan distributions of spent transaction output (STXO) and the daily age distributions of the
                              cumulative unspent transaction output (UTXO). We provide a computationally feasible approach for
                              characterizing Bitcoin transactions that paves the way for future economic studies of Bitcoin.

                              Background & Summary
                              Bitcoin is a peer-to-peer electronic payment system that has rapidly grown in popularity in recent years1–4. As
                              a distributed ledger technology (DLT), Bitcoin records newly generated transactions in a decentralized way,
                              eliminating the need for intermediaries like banks and reducing transaction costs5–7.
                                  Bitcoin relies on recording the unspent transaction outputs (UTXO) to efficiently verify newly generated
                              transactions8–11. An illustrative example of UTXO is shown in Fig. 1. A UTXO can be generated either as block
                              rewards or outputs of transactions. Block rewards are newly minted bitcoins (BTC) distributed to miners for
                              their work to maintain the network, such as routing transactions and validating blocks. In fact, all UTXOs can
                              be dated back to block rewards. The timestamp is recorded when a UTXO is generated. A UTXO is spent and
                              converted into a spent transaction output (STXO) when it is used as the input of a transaction. A timestamp is
                              again recorded when the UTXO is spent, and each UTXO can be spent only once. Such a unique feature allows
                              us to calculate the age of each UTXO and the lifespan of each STXO as we do in population data. Take Fig. 1 as
                              an example. As of July 1, 2020, UTXOs 1–3 are 8.5-years, 1-year, and 1-day old, respectively. Immediately after
                              Alice’s payment to Bob on January 1, 2021, UTXOs 1–3 are converted to STXOs with ages of 9 years, 1.5 years,
                              and 0.5 years and 1-day old, respectively.
                                  Noticing the unique structure of the Bitcoin blockchain data, we apply cohort analysis12–16, originally devel-
                              oped for population data, to analyze it. To continue the analogy with the population data, we say a UTXO is born
                              when it is generated as block rewards or the output of a transaction, and we say a UTXO is dead when it is spent
                              as the input of another transaction. In this way, all UTXOs generated on the same day form a daily birth cohort,
                              and all UTXOs spent on the same day form a daily death cohort. We define the age of a UTXO as the difference
                              between “now” (the date on which we are working) and the time when it was born. We define the lifespan of
                              an STXO as the difference between the time when the STXO was dead and the time when it was born. Thus, all
                              UTXOs within an age range form an age cohort, and all STXOs within a lifespan range form a lifespan cohort.
                              With this framework, we naturally replicate in Bitcoin blockchain data a trinity of birth, death, and age cohorts
                              using population cohort analysis.
                                  Usually, we need to query the complete history of Bitcoin blockchain data to acquire variables with economic
                              meaning. With over 1.6 billion historical transactions on the Bitcoin blockchain, it has become increasingly
                              difficult and computationally intensive now to download the complete Bitcoin blockchain records. It is thus
                              important to query Bitcoin transaction data in a way that is more efficient and provides economic insights17.

                              1
                                SciEcon CIC, London, WC2H 9JQ, United Kingdom. 2Data Science Research Center and Social Science Division,
                              Duke Kunshan University, Kunshan, Jiangsu, 215316, China. 3Duke University, Durham, NC, 27708, United States.
                              4
                                Bochsler Finance, Zug, 6300, Switzerland. 5These authors contributed equally: Yulin Liu, Luyao Zhang, Yinhong
                              Zhao. ✉e-mail: lz183@duke.edu

  Scientific Data |   (2022) 9:136 | https://doi.org/10.1038/s41597-022-01254-0                                                               1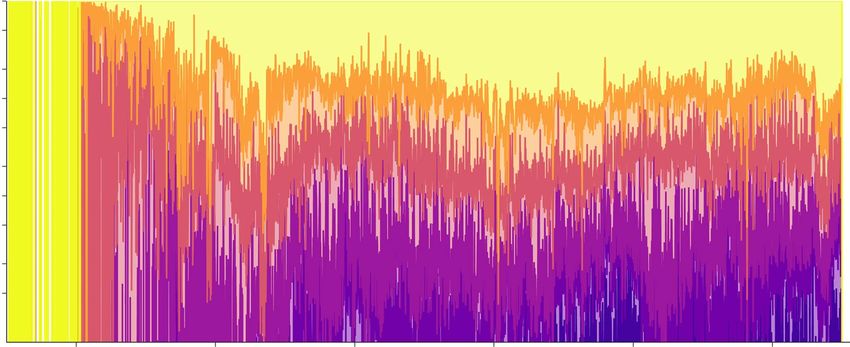
www.nature.com/scientificdata/                                                                    www.nature.com/scientificdata

                            Fig. 1 An example of UTXO birth and death. UTXOs 1, 2, and 3 were spent in a transaction taking place
                            between Alice and Bob and were transformed to UTXOs 4 and 5. UTXOs 1, 2, and 3 became STXOs after the
                            transaction.

                            Fig. 2 Workflow of cohort analysis on BTC UTXO data.

                            Cohort analysis provides a new perspective from which we can analyze data within each cohort separately before
                            integrating them into a time series.
                                Our workflow is displayed in Fig. 2. We query and process Bitcoin transaction input and output data within
                            each daily cohort. By doing so, we successfully create datasets and visualizations for some key Bitcoin transac-
                            tions indicators, including the daily lifespan distributions of STXOs as percentages (Fig. 3) and the cumulative
                            daily age distributions of UTXOs (Fig. 4). These visualizations can be used to study the functions of bitcoin
                            (BTC) as a currency. The three functions of a currency include acting as a store of value, unit of account, and
                            medium of exchange. For example, Fig. 4 shows the number of BTCs in UTXOs (i.e., BTCs that have not been
                            spent) by age distribution. By the end of 2020, approximately 2 million BTCs had not been transacted for more
                            than 10 years. In the past 5–10 years, 2–5 years, and 1–2 years, approximately 2 million, 4.5 million, and 3
                            million BTCs, respectively, remained inactive. This equals approximately 11.5 million BTCs not having been
                            transacted for more than 1 year. These BTCs serve as a time deposit and act as a store of value. Moreover, approx-
                            imately 5 million BTCs are alive for 1 month to 1 year. These BTCs are similar to a demand deposit. Frequently
                            transacted BTCs are those with ages between 1 day and 1 month (2 million) and less than 1 day (0.2 million).
                            These BTCs act as a medium of exchange.
                                Our final datasets include one dataset that characterizes STXOs and one that characterizes UTXOs, which
                            are both smaller than 1 MB. Moreover, cohort analysis keeps data querying and processing to a minimum for

Scientific Data |   (2022) 9:136 | https://doi.org/10.1038/s41597-022-01254-0                                                               2
www.nature.com/scientificdata/ www.nature.com/scientificdata
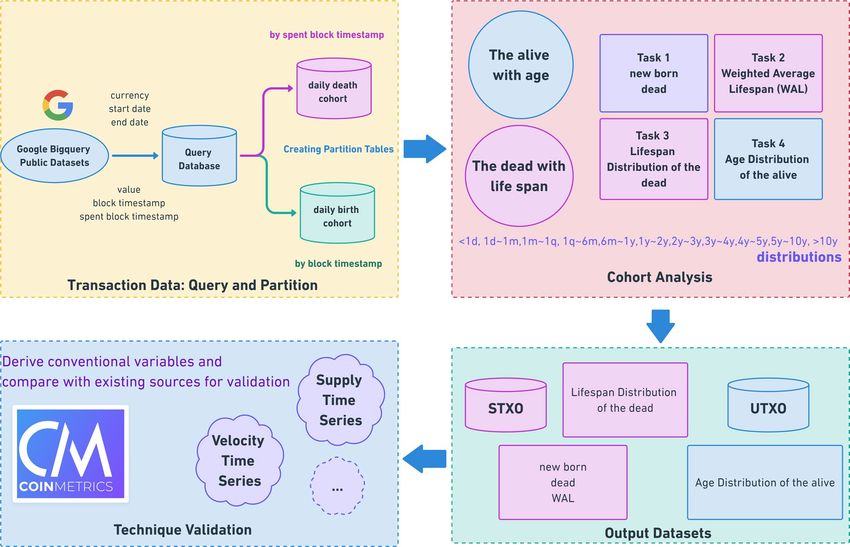
Fig. 3 Lifespan distribution of BTC STXOs. The figure shows the log percentage of spent transaction outputs
with different lifespans in each day until Feb. 2021. For example, by Feb. 2021, the STXOs with lifespans of less
than one day accounted for 80% of all STXOs, while those with lifespans between 1 day and 1 month accounted
for another 15%.
Fig. 4 Number of BTC UTXOs by age. The figure shows the total cumulative unspent transaction outputs by
age. For example, by Feb. 2021, there were approximately 200k UTXOs less than 1 day old used as the medium
of exchange and approximately 2 million UTXOs more than 10 years old lost or used as store of value.
future updates and enables automated updates. We thus provide a computationally feasible approach for char-
acterizing BTC transactions, which paves the way for future economic studies of Bitcoin. Our methods can
be generally applied to other cryptocurrencies that adopt UTXO protocols, including Litecoin, Dash, Zcash,
Dogecoin, and Bitcoin Cash.
Methods
While the Bitcoin transaction output data are publicly available on its blockchain, we find the size of the raw
data (approximately 1.3 TB) overwhelming to process, even with cloud computing platforms. To improve the
efficiency of computation, we first retrieve the data relevant to the study to create a more manageable data table
of only 45 GB. By partitioning this data table into daily birth and death cohorts, we can analyze the STXOs
and UTXOs in each cohort separately to summarize the daily characteristics of transaction outputs and create
visualizations based on the cohort summary. Our method can be adapted to the creation of future blocks — we
only need to process the transaction output data from the latest cohort and append the summary to the current
version.
Creating partitioned tables. Our primary workplace is Google Colaboratory (Colab), a Jupyter Notebook
hosted environment from Google, and BigQuery, a data warehouse from Google Cloud Platform. We first query
Scientific Data | (2022) 9:136 | https://doi.org/10.1038/s41597-022-01254-0 3www.nature.com/scientificdata/ www.nature.com/scientificdata
the columns of interest from the public dataset crypto-bitcoin on BigQuery18, which includes the input and out-
put data of Bitcoin. We then join the data queried from input and output data to create a data table that includes
the value of UTXO (value), the timestamp when the UTXO was created (block_timestamp), and the timestamp
when the UTXO was spent as an input of another transaction (spent_block_timestamp) (this column is left null if
the transaction output is unspent). As the UTXO in a transaction is counted in satoshi (1 satoshi = 10−8 BTCs),
the actual number of BTCs in a UTXO can be computed by #UTXO = value*10−8, where the value represents the
number of BTCs in satoshi. We rely on this derived data table (1.6 billion rows, 45 GB) to conduct further analysis.
To save the cost of the query, we create two partitioned tables based on the derived data table, one by the
date in block_timestamp and one by the date in spent_block_timestamp. This means that the data entries are
partitioned either by the date when the UTXOs were created or by the date when the UTXOs were spent. In this
way, the program queries only the entries with timestamps in a specific range, which saves a notable amount of
computational power. This step can significantly improve query performance and reduce query cost19.
Querying and processing cohort data. The data structure of partitioned tables coincides with our need
to process cohort data. The table partitioned by date in block_timestamp naturally divides the derived data into
birth cohorts that include the segment of transaction outputs created on the same date, and the table partitioned
by date in spent_block_timestamp divides the derived data into death cohorts that include the segment of transac-
tion outputs spent on the same date.
We query and process each birth cohort and each death cohort with a loop program following the procedure
described in Fig. 2. For each specific date after 2009-01-03, when the first block of Bitcoin was created, the birth
cohort data and the death cohort data of that date are queried and imported to Colab from BigQuery. As in Task
1, we compute the total number of BTCs in UTXOs created and spent on that date by summing the number of
BTCs in UTXOs in the birth cohort data and the death cohort data respectively. Task 2 focuses on the weighted
average lifespan (WAL) on the date, defined as the average lifespan (the difference between the time when the
output was spent and the time when the output was created) weighted by the number of BTCs contained in the
transaction outputs. WAL can be computed from the death cohort data by the formula:
WAL[date = i] = ∑ (#UTXO × Lifespan ) / ∑ #UTXO,
date = i date = i
where Lifespan = spent_block_timestamp-block_timestamp.
As in Task 3, we compute the distribution of lifespan with death cohort data on that date by first categorizing
UTXOs based on lifespan and then summing the number of BTCs in UTXOs in each category. In Task 4, we
apply a more complicated partitioning method to compute the age distribution for each specific date. The age of
a UTXO is defined as age = working_date_block_timestamp, where working date means the date of interest for
the data cohort being studied. Each UTXO that remains alive on a specific date must satisfy both conditions: a)
its block_timestamp must be smaller than the end of the working date, which means that the UTXO was created
sometime before or on the date, and b) its spent_block_timestamp must either be null, which means the UTXO
was not spent before 2021-02-10, or be larger than the end of the working date, which means that the UTXO was
spent sometime after the working date but before 2021-02-10. Thus, we cannot simply interpret this information
as either birth or death cohort data. Instead, we must first query the data needed to compute the age distribution
for a twelve-month or six-month period depending on the size of the data in each year and then split the queried
data into daily cohorts in the Python program. We compute the age distribution of each daily cohort by catego-
rizing the age of each UTXO and summing up the number of BTCs in UTXOs in each category.
Visualizing the time series. The result of our analysis is condensed into time-series data that include the
number of BTCs in UTXOs created and spent, the weighted average lifespan, the lifespan distribution, and the
age distribution on each date from 2009-01-03 to 2021-02-10. Many visualizations can potentially be generated
from this informative time series. For example, BTC token velocity, which we define below as the number of BTCs
spent in the last 30 days divided by the circulating supply of BTCs, can be computed by
29
∑ j =0#spent[date = i − j]
v[date = i] = .
Supply[date = i]
Our method can be adapted to the creation of future blocks. The time-series data for the past dates are
not subject to changes as new blocks are created. As time goes on, we need only query and process the latest
data cohorts to extend the time series. We will update the visualizations according to the latest development of
Bitcoin, and researchers may easily repeat our work in part or in whole based on their needs.
Data Records
The final data records are stored and published on the Harvard Dataverse20. The records consist of the UTXO
and the STXO datasets in csv format. Data ranges from 2009-01-03 to 2021-02-10, and the data frequency is
daily (n = 4421). The timezone used in the data is UTC + 0. In addition to examining Bitcoin, we apply the same
cohort analysis to five other cryptocurrencies and generate twelve datasets in total. Detailed information on
these data files is presented in Appendix. We also provide supplementary figures in Appendix.
Scientific Data | (2022) 9:136 | https://doi.org/10.1038/s41597-022-01254-0 4www.nature.com/scientificdata/ www.nature.com/scientificdata
Fig. 5 Block reward and circulating BTC supply. The figure shows that the block reward (net BTC supply)
roughly corresponds to the halving pattern written in the Bitcoin white paper. It also shows that the circulating
supply we compute with our UTXO data coincides exactly with the circulating supply from Coinmetrics.
Technical Validation
To further verify the validity of our methods, we use our data to calculate other variables, including block reward
and circulating supply of BTCs, and check whether the results are consistent with descriptions in the Bitcoin
white paper1 and external data sources. We compute the circulating supply of BTC by computing the cumulative
net new UTXOs with the formula
Supply[date = i] = Net _new[date ≤ i] = ∑ #created − ∑ #spent .
date ≤ i date ≤ i
Figure 5 visualizes the block rewards and the circulating supply. Block rewards are the BTC awarded to the
miner who wins the right to record a block of transactions by proof-of-work. Supply of the BTCs originates
from the block rewards, so the cumulative sum of block rewards is the total number of BTCs in UTXOs, i.e., the
circulating supply of BTC. The Bitcoin block reward was initially set at 50 BTCs per block in 2009, which means
approximately 7,200 newly minted BTCs every 24 hours. The block reward halves every 210,000 blocks, roughly
every four years, until the total BTC supply reaches 21 million1. As of the time of writing, the daily block reward
amounts to approximately 900, and the circulating BTC supply is 18.9 million.
In addition, we calculate the circulating supply of BTCs by summing all UTXOs in different age cohorts
because existing BTC are essentially just UTXOs of different ages. We then compare the circulating supply we
compute with the circulating supply data obtained from CoinMetrics (https://github.com/coinmetrics/data), a
widely used blockchain database. As shown in Fig. 5, the two measures of circulating supply match exactly with
each other. Hence, the validity of our data is verified.
Usage Notes
Applicability. Our data can inspire research in finance, computer science, and macroeconomics. Our data
can produce new technical indicators for financial studies to predict cryptocurrency bubbles21,22, measure cryp-
tocurrency volatility and systematic risk23,24, design investment strategies25–27 and implement portfolio manage-
ments28,29. For instance, Liu and Zhang17 used our data to design automated trading strategies for BTC investment
that outperform conventional approaches. In computer science, we can apply the UTXO and STXO data to eval-
uate blockchain security and scalability30–32. Wang et al.33 cite our data to demonstrate the scalability issues of
the BTC blockchain and propose an efficient storage scheme. Our data can also contribute to event studies that
evaluate the effect of macro policies on BTC transactions34.
Limitations and future research. In this section, we identify the limitations of our current results and
directions for future research. First, although the frequency of our data is on a daily level, our cohort analysis can
produce data with higher frequencies. Table 1 shows several other cryptocurrencies to which our methodology
can be easily applied. The granularity of the data can reach different levels (75 seconds to 10 minutes) depending
on the block time of each cryptocurrency.
Second, the age distribution of UTXOs is a limited measure for BTC as a store of value. UTXOs might accu-
mulate ages for at least two reasons other than being a store of value: First, the owner of the UTXOs has lost the
private key, or second, the amount of UTXOs in the owner’s account is less than the transaction fee. Owners do
Scientific Data | (2022) 9:136 | https://doi.org/10.1038/s41597-022-01254-0 5www.nature.com/scientificdata/ www.nature.com/scientificdata
name brief start date block time link
Bitcoin BTC 2009-01-03 ≈10 min whitepaper1
Bitcoin Cash BCH 2017-07-31 ≈10 min website
Litecoin LTC 2011-10-23 ≈2.5 min website
Dogecoin DOGE 2013-12-06 ≈1 min website
Dash DASH 2014-01-18 ≈2.5 min website
Zcash ZEC 2016-10-28 ≈75 seconds website
Table 1. Block time summary of UTXO-based cryptocurrencies. Data sources from white papers and websites
of these cryptocurrencies.
not transact these dust UTXOs for cost-benefit reasons. In neither case is age accumulation a sign that BTC acts
as a store of value. However, scientific methods to identify the two types of UTXOs have yet to be found.
Third, the cohort analysis we designed and implemented was for UTXO-based blockchains. However,
account-based blockchains, such as Ethereum, Polkadot, and Dfinity, adopt a different accounting method. In
the UTXO model, crypto tokens are akin to banknotes issued by central banks; in the account model, crypto
tokens are akin to balances in commercial bank accounts. Future research could extend the cohort analysis for
account-based blockchains. Moreover, Ethereum, a Turing-complete blockchain, has two types of accounts:
externally owned accounts (EOA) and contract accounts, which can be analogized to private and corporate
accounts in commercial banks. A comparative study of the two accounts by cohort analysis could be an exciting
direction for future research.
Code availability
The code used for the cohort analysis is available on GitHub (https://github.com/SciEcon/UTXO). The GitHub
repository is also archived by Zenodo35, with the code available in Python and written in Google Colab Notebook
with Markdown. first release created on Github: 22 Apr 2021; license: GPL-3.0 License
Received: 30 April 2021; Accepted: 11 March 2022;
Published: xx xx xxxx
References
1. Nakamoto, S. Bitcoin: A peer-to-peer electronic cash system. Decentralized Bus. Rev. 21260, https://www.debr.io/article/21260-
bitcoin-a-peer-to-peer-electronic-cash-system (2008).
2. Böhme, R., Christin, N., Edelman, B. & Moore, T. Bitcoin: Economics, technology, and governance. J. Econ. Perspectives 29, 213–238,
https://doi.org/10.1257/jep.29.2.213 (2015).
3. Halaburda, H. Blockchain revolution without the blockchain? Commun. ACM 61, 27–29, https://doi.org/10.1145/3225619 (2018).
4. Subacchi, P. From gold to bitcoin and beyond. Nat. 597, 626–627, https://doi.org/10.1038/d41586-021-02615-2 (2021).
5. Ornes, S. Core concept: Blockchain offers applications well beyond bitcoin but faces its own limitations. Proc. Natl. Acad. Sci. 116,
20800–20803, https://doi.org/10.1073/pnas.1914849116 (2019).
6. Townsend, R. M. Distributed Ledgers: Design and Regulation of Financial Infrastructure and Payment Systems (The MIT Press, 2020).
7. Harvey, C. R., Ramachandran, A. & Santoro, J. Defi And The Future Of Finance. (John Wiley, 2021).
8. Delgado-Segura, S., Pérez-Solà, C., Navarro-Arribas, G. & Herrera-Joancomartí, J. Analysis of the bitcoin utxo set. Financial
Cryptogr. Data Secur. 78–91, https://doi.org/10.1007/978-3-662-58820-86 (2019).
9. Urquhart, A. The inefficiency of bitcoin. Econ. Lett. 148, 80–82, https://doi.org/10.1016/j.econlet.2016.09.019 (2016).
10. Chakravarty, M. M. T. et al. The extended utxo model. Financial Cryptogr. Data Secur. 525–539, https://doi.org/10.1007/978-3-030-
54455-337 (2020).
11. Pérez-Solà, C., Delgado-Segura, S., Navarro-Arribas, G. & Herrera-Joancomartí, J. Another coin bites the dust: an analysis of dust in
utxo-based cryptocurrencies. Royal Soc. Open Sci. 6, 180817, https://doi.org/10.1098/rsos.180817 (2019).
12. Glenn, N. D. Cohort analysis (Sage Publications, 2005).
13. Mason, K. O., Mason, W. M., Winsborough, H. H. & Poole, W. K. Some methodological issues in cohort analysis of archival data.
Am. Sociol. Rev. 38, 242, https://doi.org/10.2307/2094398 (1973).
14. Breslow, N. E., Lubin, J. H., Marek, P. & Langholz, B. Multiplicative models and cohort analysis. J. Am. Stat. Assoc. 78, 1–12, https://
www.jstor.org/stable/2287093. https://doi.org/10.2307/2287093 (1983).
15. Jiang, D. et al. Cohort query processing. Proc. VLDB Endow. 10, 1–12, https://doi.org/10.14778/3015270.3015271 (2016).
16. Omidvar-Tehrani, B., Amer-Yahia, S. & Lakshmanan, L. V. Cohort representation and exploration. IEEE 5th Int. Conf. on Data Sci.
Adv. Anal. (DSAA), https://doi.org/10.1109/dsaa.2018.00027 (2018).
17. Liu, Y. & Zhang, L. Cryptocurrency valuation: An explainable ai approach. SSRN Electron. J. https://doi.org/10.2139/ssrn.3657986
(2021).
18. Day, A., Medvedev, E., AK, N. & Price, W. Introducing six new cryptocurrencies in bigquery public datasets—and how to analyze
them, https://cloud.google.com/blog/products/data-analytics/introducing-six-new-cryptocurrencies-in-bigquery-public-datasets-
and-how-to-analyze-them (2019).
19. Introduction to partitioned tables | bigquery | google cloud, https://cloud.google.com/bigquery/docs/partitioned-tables (2021).
20. Liu, Y., Zhang, L. & Zhao, Y. Replication data for: “deciphering bitcoin blockchain data by cohort analysis”. Harv. Dataverse. https://
doi.org/10.7910/DVN/XSZQWP (2021).
21. Shu, M. & Zhu, W. Real-time prediction of bitcoin bubble crashes. Phys. A: Stat. Mech. its Appl. 548, 124477, https://doi.
org/10.1016/j.physa.2020.124477 (2020).
22. Li, T. R., Chamrajnagar, A. S., Fong, X. R., Rizik, N. R. & Fu, F. Sentiment-based prediction of alternative cryptocurrency price
fluctuations using gradient boosting tree model. Front. Phys. 7, https://doi.org/10.3389/fphy.2019.00098 (2019).
23. Giudici, P. & Pagnottoni, P. Vector error correction models to measure connectedness of bitcoin exchange markets. Appl. Stoch.
Model. Bus. Ind. 36, 95–109, https://doi.org/10.1002/asmb.2478 (2019).
24. Giudici, P., Leach, T. & Pagnottoni, P. Libra or librae? basket based stablecoins to mitigate foreign exchange volatility spillovers.
Finance Res. Lett. 102054, https://doi.org/10.1016/j.frl.2021.102054 (2021).
Scientific Data | (2022) 9:136 | https://doi.org/10.1038/s41597-022-01254-0 6www.nature.com/scientificdata/ www.nature.com/scientificdata
25. Pagnottoni, P. Neural network models for bitcoin option pricing. Front. Artif. Intell. 2, https://doi.org/10.3389/frai.2019.00005
(2019).
26. Karalevicius, V., Degrande, N. & De Weerdt, J. Using sentiment analysis to predict interday bitcoin price movements. The J. Risk
Finance 19, 56–75, https://doi.org/10.1108/jrf-06-2017-0092 (2018).
27. Resta, M., Pagnottoni, P. & De Giuli, M. E. Technical analysis on the bitcoin market: Trading opportunities or investors’ pitfall? Risks
8, 44, https://doi.org/10.3390/risks8020044 (2020).
28. Daniel, K., Mota, L., Rottke, S. & Santos, T. The cross-section of risk and returns. The Rev. Financial Stud. 33, 1927–1979, https://doi.
org/10.1093/rfs/hhaa021 (2020).
29. Griffin, J. M. & Shams, A. Is bitcoin really untethered? The J. Finance 75, 1913–1964, https://doi.org/10.1111/jofi.12903 (2020).
30. Croman, K. et al. On scaling decentralized blockchains. Financial Cryptogr. Data Secur. 106–125, https://doi.org/10.1007/978-3-662-
53357-48 (2016).
31. Gervais, A. et al. On the security and performance of proof of work blockchains. Proc. 2016 ACM SIGSAC Conf. on Comput.
Commun. Secur. - CCS’16, https://doi.org/10.1145/2976749.2978341 (2016).
32. Pagnotta, E. S. Decentralizing money: Bitcoin prices and blockchain security. The Rev. Financial Stud, https://doi.org/10.1093/rfs/
hhaa149 (2021).
33. Wang, X., Wang, C., Zhou, K. & Cheng, H. Ess: An efficient storage scheme for improving the scalability of bitcoin network. IEEE
Transactions on Netw. Serv. Manag. https://doi.org/10.1109/tnsm.2021.3127187 (2021).
34. Karau, S. Monetary policy and cryptocurrencies. SSRN Electron. J, https://doi.org/10.2139/ssrn.3949549 (2021).
35. Zhang, L. & Zhao, Y. Sciecon/utxo: Preprint: Deciphering bitcoin blockchain data by cohort analysis. Zenodo, https://doi.
org/10.5281/zenodo.4708453 (2021).
Acknowledgements
We have benefited from the comments by discussions at the SciEcon Research Accelerator Seminar. We thank
two anonymous referees at Scientific Data for their insightful comments that helped us revise the manuscript.
We thank Duke Kunshan University for its continued support in interdisciplinary research and in cultivating
undergraduate research. Duke Kunshan University is the corresponding institution for this article. Duke Kunshan
University provides the funding support for the article processing charge (APC) to facilitate the great cause of
open access publication. Yinhong Zhao was a visiting undergraduate student hosted by Duke Kunshan University,
during which he started to partake in the co-authorship as the research assistant of Professor Luyao Zhang during
the Covid-19 global pandemic.
Author contributions
Each author contributed equally to this research. Yulin Liu led the discussion on the blockchain mechanism and
the economic meaning of UTXO data. Luyao Zhang designed the cohort analysis methods applying to UTXO-
based blockchains. Yinhong Zhao queried and processed the data. Each author contributed significantly to the
draft and revisions of the manuscript.
Competing interests
The authors declare no competing interests.
Additional information
Supplementary information The online version contains supplementary material available at https://doi.
org/10.1038/s41597-022-01254-0.
Correspondence and requests for materials should be addressed to L.Z.
Reprints and permissions information is available at www.nature.com/reprints.
Publisher’s note Springer Nature remains neutral with regard to jurisdictional claims in published maps and
institutional affiliations.
Open Access This article is licensed under a Creative Commons Attribution 4.0 International
License, which permits use, sharing, adaptation, distribution and reproduction in any medium or
format, as long as you give appropriate credit to the original author(s) and the source, provide a link to the Cre-
ative Commons license, and indicate if changes were made. The images or other third party material in this
article are included in the article’s Creative Commons license, unless indicated otherwise in a credit line to the
material. If material is not included in the article’s Creative Commons license and your intended use is not per-
mitted by statutory regulation or exceeds the permitted use, you will need to obtain permission directly from the
copyright holder. To view a copy of this license, visit http://creativecommons.org/licenses/by/4.0/.
© The Author(s) 2022
Scientific Data | (2022) 9:136 | https://doi.org/10.1038/s41597-022-01254-0 7You can also read