A deprivation and demographic profile of the Taranaki DHB
←
→
Page content transcription
If your browser does not render page correctly, please read the page content below
A deprivation and
demographic profile of
the Taranaki DHB
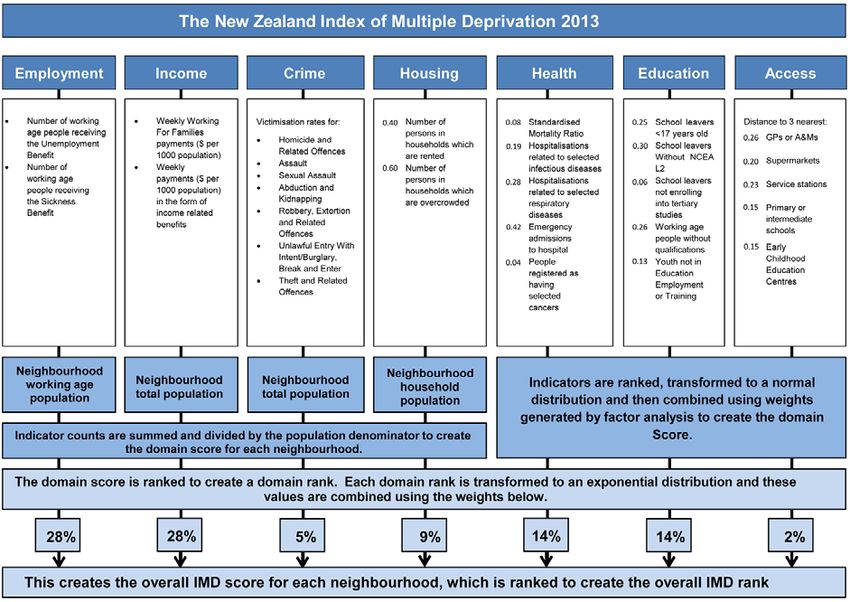
Taranaki DHB, showing overall IMD deprivation
with the most deprived areas shaded darkest
Rachael Yong, Michael Browne, Dr Jinfeng Zhao, Dr Arier Chi Lun
Lee, Dr Nichola Shackleton, Dr Sue Crengle, Dr Daniel Exeter
17/10/2017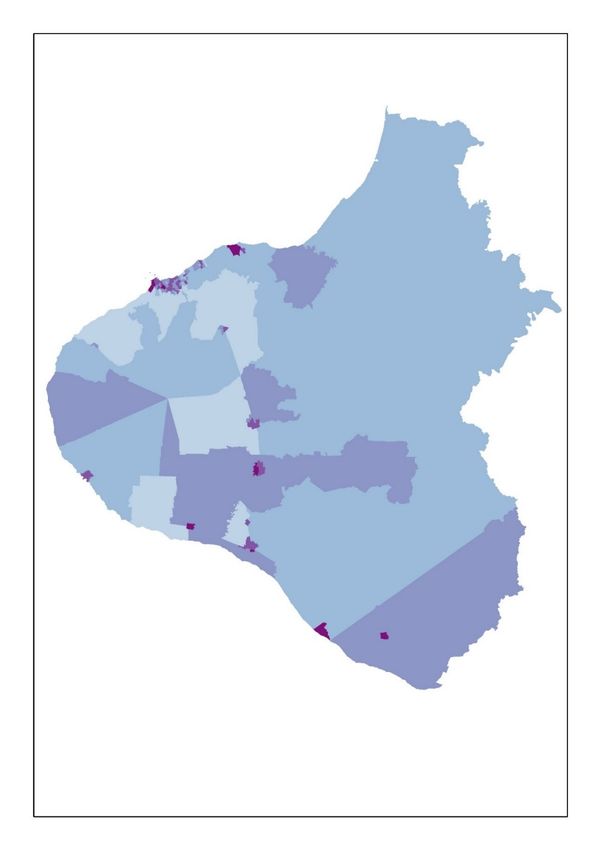
Statistics New Zealand Disclaimer

The results in this report are not official statistics, they have been created for research
purposes from the Integrated Data Infrastructure (IDI), managed by Statistics New
Zealand. The opinions, findings, recommendations, and conclusions expressed in this
paper are those of the author(s) not Statistics NZ or the University of Auckland.

 Access to the anonymised data used in this study was provided by Statistics NZ in
accordance with security and confidentiality provisions of the Statistics Act 1975. Only
people authorised by the Statistics Act 1975 are allowed to see data about a particular
person, household, business, or organisation and the results in this paper have been
confidentialised to protect these groups from identification. Careful consideration has been
given to the privacy, security, and confidentiality issues associated with using
administrative and survey data in the IDI. Further detail can be found in the Privacy impact
assessment for the Integrated Data Infrastructure available from www.stats.govt.nz.

 The results are based in part on tax data supplied by Inland Revenue to Statistics NZ
under the Tax Administration Act 1994. This tax data must be used only for statistical
purposes, and no individual information may be published or disclosed in any other form,
or provided to Inland Revenue for administrative or regulatory purposes. Any person who
has had access to the unit-record data has certified that they have been shown, have read,
and have understood section 81 of the Tax Administration Act 1994, which relates to
secrecy. Any discussion of data limitations or weaknesses is in the context of using the IDI
for statistical purposes, and is not related to the data’s ability to support Inland Revenue’s
core operational requirements.

                                    Acknowledgments

The research team are grateful to the Health Research Council of New Zealand for funding
this research project. This research would not have been possible without the provision of
data, expert guidance and support of many individuals and the following organisations:
Accident Compensation Corporation, Action on Smoking and Health, Aotearoa People's
Network Kaharoa, ANZ Bank, ASB Bank, Association of Public Library Managers Inc.,
Auckland Uniservices Ltd, Auckland University of Technology, Beacon Pathway, BNZ Bank,
BRANZ, Child Poverty Action Group, COMET Auckland, Counties-Manukau DHB,
Department of Corrections, Energy Efficiency and Conservation Association, Family Start,
Heart Foundation, Housing New Zealand Corporation, Inland Revenue, Kiwibank, Leeds
University, Maritime NZ, Massey University, Ministries of Business, Innovation and
Employment, Education, Health, Justice and Social Development, National Collective of
Independent Women’s Refuges, Ngāti Whātua o Ōrākei, Northland DHB, New Zealand
Certified Builders Association, NZ Fire Service, NZ-Libs, NZ Police, NZ Post, NZ Racing
Board, Royal New Zealand College of General Practitioners, Ollivier & Company, Otago
University, Participants in the Feb 2014 and Feb 2017 hui, Pharmac, Plunket, Prisoners Aid
and Rehabilitation Trust, Problem Gambling Foundation, Salvation Army, St John's
Ambulance, Southern African Social Policy Research Institute, Statistics New Zealand, TSB
Bank, Tairāwhiti DHB, Te Kāhui Mana Ririki Trust, Te Kupenga Hauora Māori, Te Matapihi
he tirohanga mō te iwi Trust (National Maori Housing Trust), Te Rūnanga o Ngāti Hine, Te
Wānanga o Aotearoa, Te Whānau O Waipareira Trust, Telco2 Ltd, Tenancy Tribunal,
University of Auckland, University of Canterbury, University of Otago, University of Oxford,
Waikato University, Waitemata DHB, Wellington Free Ambulance, Westpac Bank, and
Woopa Design.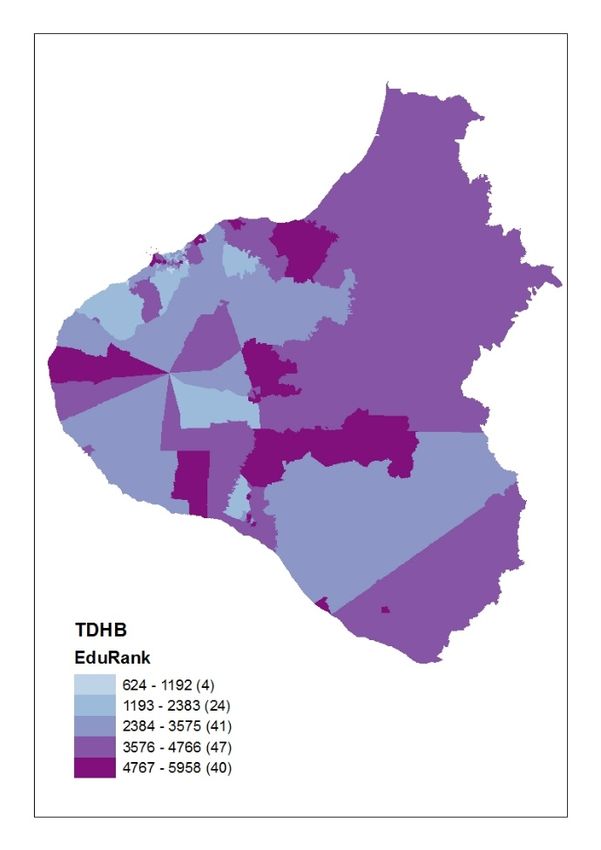
A deprivation and demographic profile of the Taranaki DHB

The New Zealand Index of Multiple Deprivation (IMD) allows one to look at
disadvantage in overall terms, as well as in terms of seven domains of deprivation:
Employment, Income, Crime, Housing, Health, Education and Access. The seven
domains are weighted to reflect the relative importance of each domain in
representing the key determinants of socio-economic deprivation, the adequacy
of their indicators and the robustness of the data that they use. Figure 1 shows
the IMD’s 28 indicators and weightings of the seven domains.

The IMD measures deprivation at the neighbourhood level using custom designed
data zones that were specifically developed for social and health research. The
New Zealand (NZ) land mass has 5,958 neighbourhood-level data zones that have
a mean population of 712 people. In urban settings, they are just a few streets
long and a few streets wide. Data zones are ranked from the least to most deprived
(1 to 5958) and grouped into five quintiles. Q1 (light shading) represents the least
deprived 20% of data zones in the whole of NZ; while Q5 (dark shading)
represents the most deprived 20%. This multidimensional deprivation information
is combined with demographic information from the 2013 census to produce a
DHB profile.

Figure 1. Flow diagram showing the IMD, its indicators, domains and
weights. Adapted from Figure 4.2 SIMD 2012 Methodology, in Scottish Index of
Multiple Deprivation 2012. Edinburgh: Scottish Government (Crown copyright
2012).
The stacked bar chart in Figure 2 shows the proportion of data zones in the
Taranaki DHB (TDHB) that belonged to each deprivation quintile for overall
deprivation (IMD) and the seven domains in 2013. If the deprivation
circumstances in the TDHB were the same as all of NZ, we would see 20% of the
TDHB’s 156 data zones in each quintile. Figure 2 shows that the proportion of data
zones with Q5 overall IMD deprivation was less than 20% for all domains, except
for Education and Access, while the proportion of data zones with Q4 deprivation
was greater than 20% for overall IMD deprivation and all domains except
Employment, Crime and Housing. The TDHB has moderate levels of overall IMD
deprivation, with 35.9% (56/156) of its data zones in Q4 or Q5.

Figure 2. Stacked bar chart showing overall deprivation and seven
domains in the TDHB

Table 1 shows summary statistics by domain for the 15 TDHB data zones that
were among NZ’s 20% most deprived (Q5) for the overall IMD and reveals the
contributions of different domains. In descending order, high (Q5) median
deprivation ranks for Education (5670), Income (5298) and Health (5015) and
Employment (4941) were contributing to high overall IMD deprivation in these 15
data zones in 2013, bearing in mind that these domains carry different weights in
the IMD (see Figure 1).
      Min, max and median 1 deprivation ranks by domain for 15 data zones with Q5 IMD
             IMD    Employment      Income   Crime     Housing   Health   Education   Access
    Min      4956   3954            4341     2857      3286      4627     4969        1807
    Max      5676   5647            5835     5128      4977      5661     5816        5729
    Median   5217   4941            5298     3714      4096      5015     5670        3912

Table 1. Minimum, maximum and median deprivation ranks by domain for
15 data zones in the TDHB with Q5 IMD deprivation

1
  When discussing the 20% most deprived data zones, ranks will usually be skewed, so it is better
to discuss the median rank (the middle value) rather than the mean rank (the average, which can
be disproportionately affected by very high values).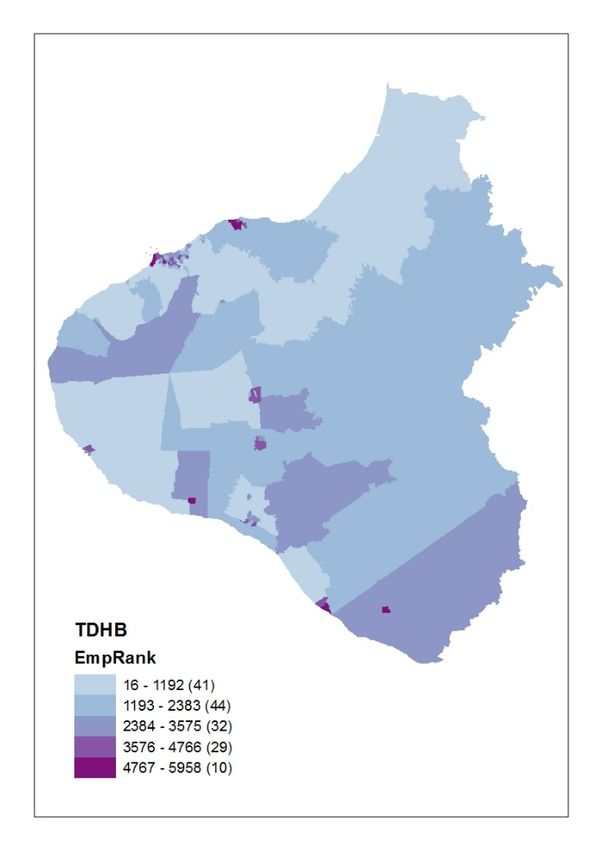
Figure 3. Distribution of overall IMD and employment deprivation in the
TDHB

The values in brackets in the legends of the maps that follow are counts of data
zones in the relevant quintile. The map for overall (IMD) on the left of Figure 3
shows moderate levels of Q5 deprivation in the TDHB. Only 9.6% (15/156) of its
data zones were among the most deprived 20% in NZ (Q5), while 16% (25/156)
were among the least deprived 20%. The median IMD rank was 2949, 0.5% (30
ranks) better than the NZ median of 2979. Most of the Q5 data zones were
concentrated in the northwestern part of the DHB in places such as Waitara and
New Plymouth, but they also occurred in Eltham, Manaia, Hawera, Patea and
Waverley. Urban data zones are difficult to see on these maps, so we suggest that
readers use the interactive maps at the IMD website to explore the TDHB further.

The map of the Employment Domain on the right of Figure 2 reflects the proportion
of working age people who were receiving the Unemployment or Sickness Benefits
in 2013. In the TDHB, only 6.4% (10/156) of data zones were among the 20%
most employment deprived in NZ, while 26.3% (41/156) of data zones were in
the least deprived 20%. The median employment deprivation rank in the TDHB
was 2170, 13.6% (809 ranks) better than the NZ median. Q5 employment
deprivation followed the general pattern of overall IMD deprivation, but with fewer
Q5 data zones in places like Eltham and Hawera.
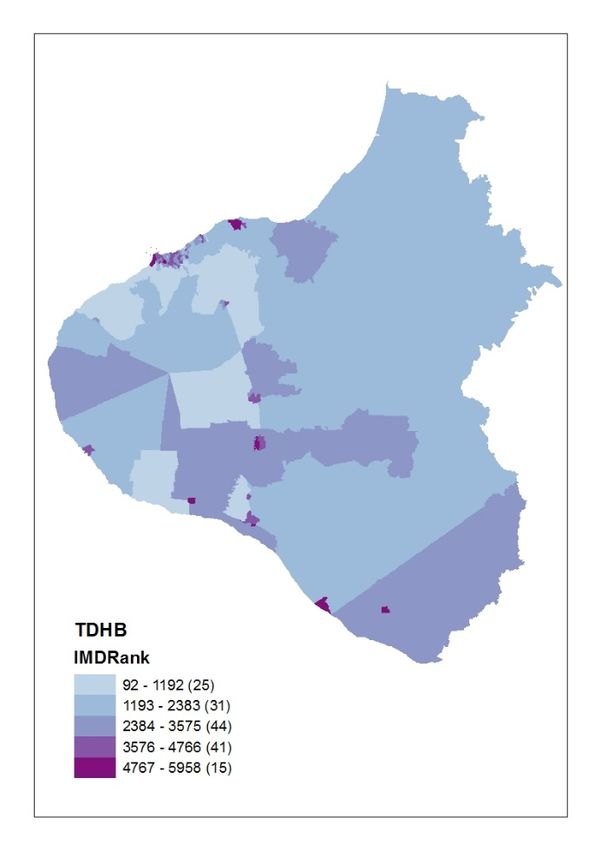
Figure 4. Distribution of income and crime deprivation in the TDHB

The Income Domain measures the amount of money per person paid by the State
in the form of Working for Families payments and income-tested benefits. In the
TDHB, 13.5% (21/156) of data zones were among NZ’s 20% most income
deprived, while 11.5% (18/156) of data zones were among the 20% least income
deprived. The median income deprivation rank in the TDHB was 3118, 2.3% (139
ranks) worse than the NZ median. High (Q5) levels of income deprivation closely
followed the pattern of Q5 overall deprivation, except there were a few more Q5
income deprived data zones in Cardiff, Opunake and Ferndale.

The Crime Domain measures victimisations per 1000 people and is largely driven
by thefts (55%), burglaries (24%) and assaults (18%). In the TDHB, only 7.1%
(11/156) of data zones were among the most deprived 20% for the Crime Domain,
while 34.6% (54/156) were among the least deprived 20%. The median crime
deprivation rank in the TDHB was 1892, 18.2% (1087 ranks) better than the NZ
median. High (Q5) crime deprivation occurred in Hillsborough, New Plymouth,
Spotswood and other towns such as Stratford, Waitara, Eltham, Hawera, Patea
and Opunake.
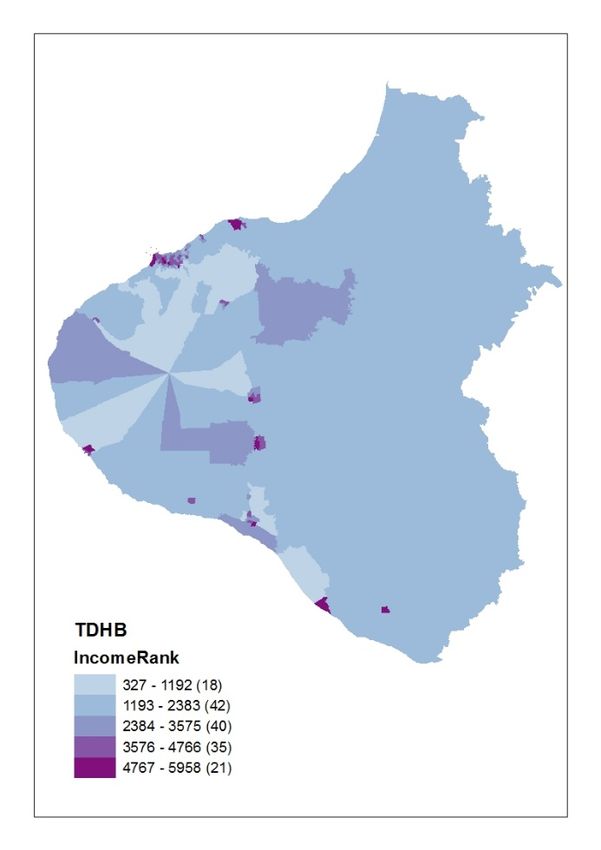
Figure 5. Distribution of housing and health deprivation in the TDHB

The Housing Domain measures the proportion of people living in overcrowded
households (60% of the weighting) and rented dwellings (40%). In the TDHB,
only 1.9% (3/156) of data zones were among the most housing deprived 20% in
NZ, while 26.3% (41/156) of data zones were among the least deprived 20%. The
median housing deprivation rank in the TDHB was 2389, 9.9% (591 ranks) better
than the NZ median. High (Q5) levels of housing deprivation occurred in Waitara,
Marfell and Spotswood.

The Health Domain consists of five indicators: standard mortality ratio, acute
hospitalisations related to selected infectious and selected respiratory diseases,
emergency admissions to hospital, and people registered as having selected
cancers. In the TDHB, 17.9% (28/156) of data zones were among the 20% most
health deprived in NZ, while 11.5% (18/156) were among the least deprived 20%.
The median health deprivation rank in the TDHB was 3266, 4.8% (287 ranks)
worse than the NZ median. High (Q5) levels of health deprivation closely followed
the pattern of Q5 overall deprivation, but with 13 additional Q5 data zones located
in New Plymouth, Eltham, Waitara, Inglewood and Hawera.
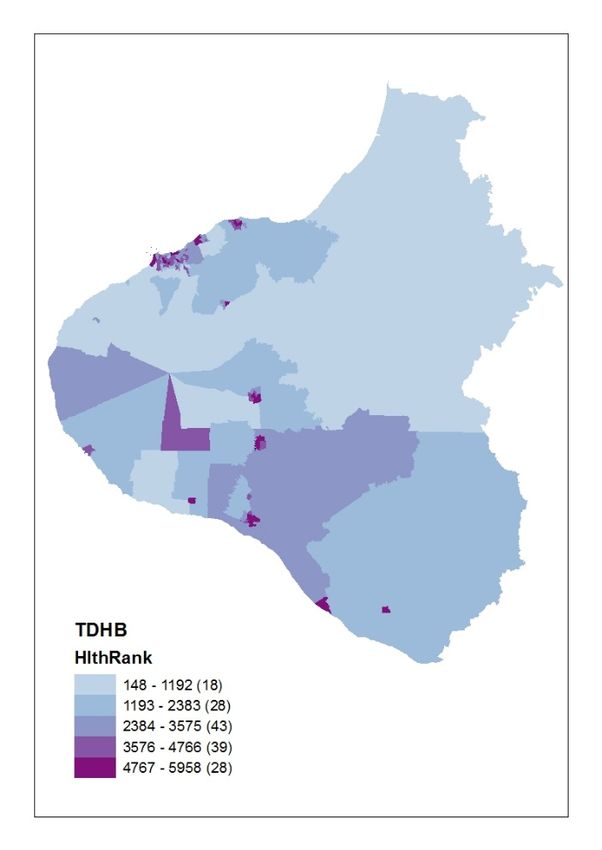
Figure 6. Distribution of education and access deprivation in the TDHB

The Education Domain measures retention, achievement and transition to
education or training for school leavers; as well as the proportion of working age
people 15-64 with no formal qualifications; and the proportion of youth aged 15-
24 not in education, employment or training (NEET). In the TDHB, 25.6% (40/156)
of data zones were among NZ’s 20% most education deprived, while only 2.6%
(4/156) were among the least deprived 20%. The median education deprivation
rank in the TDHB was 3833, 14.3% (854 ranks) worse than the NZ median. High
(Q5) levels of education deprivation occurred in urban areas, but also in large rural
data zones around Urenui, Parihaka, Midhirst, Kapuni, Te Roti and Moeroa. The
Education Domain had 25 more Q5 data zones than the overall IMD.

The Access Domain measures the distance from the population weighted centre
of each data zone to the nearest three GPs, supermarkets, service stations,
schools and early childhood education centres. In the TDHB, 32.7% (51/156) of
data zones were among NZ’s 20% most access deprived, while only 9% (14/156)
were among NZ’s 20% least deprived. The median access deprivation rank in the
TDHB was 4116, 19.1% (1137 ranks) worse than the NZ median. High (Q5) levels
of access deprivation occurred in all rural parts of the TDHB.
Age profile of the Taranaki
According to the 2013 census, the TDHB had a total population of 109,725 people
living in 156 data zones, with a mean of 703 people each (range: 504 to 987).
Mean data zone proportions for five age groups in the TDHB
Age group 0-14 15-24 25-44 45-64 65+
Taranaki 21.1% 11.8% 24.3% 26.6% 16.2%
New Zealand 2 20.4% 13.8% 25.6% 25.8% 14.3%
Difference 0.7% -2.0% -1.3% 0.8% 1.9%
Table 2. Mean data zone proportions for five age groups in the TDHB
Table 2 shows that the age profile of the TDHB differs most from the national age
profile in that it has 2.0% fewer people aged 15-24 and 1.9% more people aged
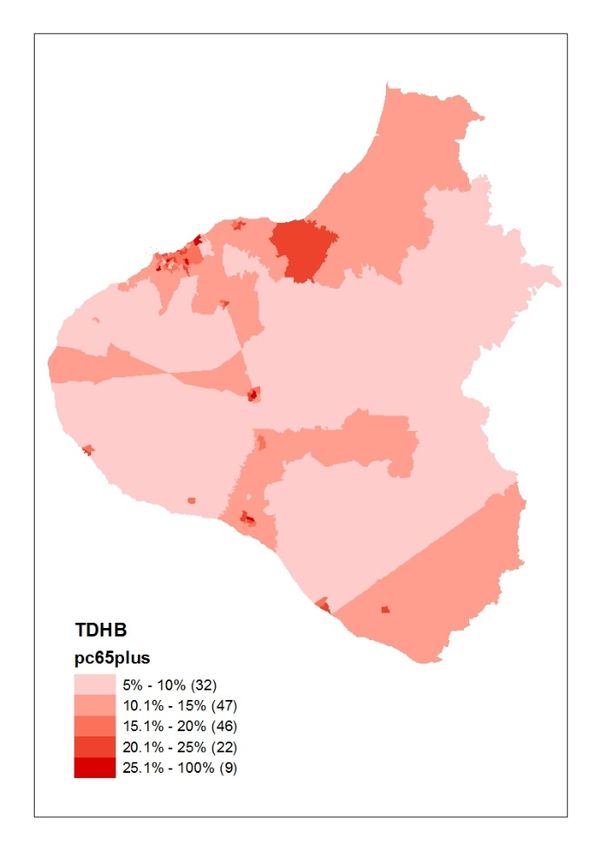
65+. Figure 7 shows the distribution of people in these two age groups.
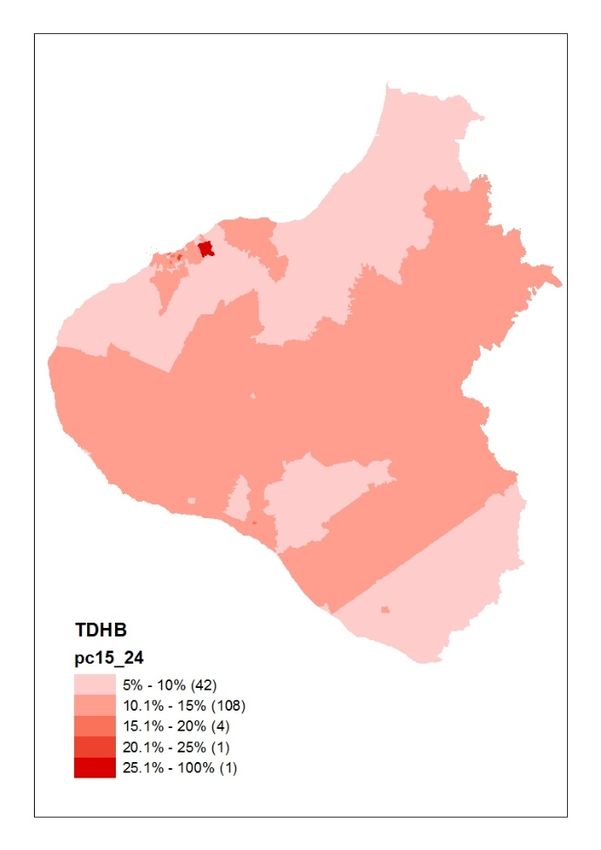
Figure 7. Distribution of people aged 15-24 and people aged 65+ in the
TDHB
2
Proportions for age groups and ethnicities at the national level are calculated using data zone
counts to ensure fair comparison with DHB values, which also use data zone counts.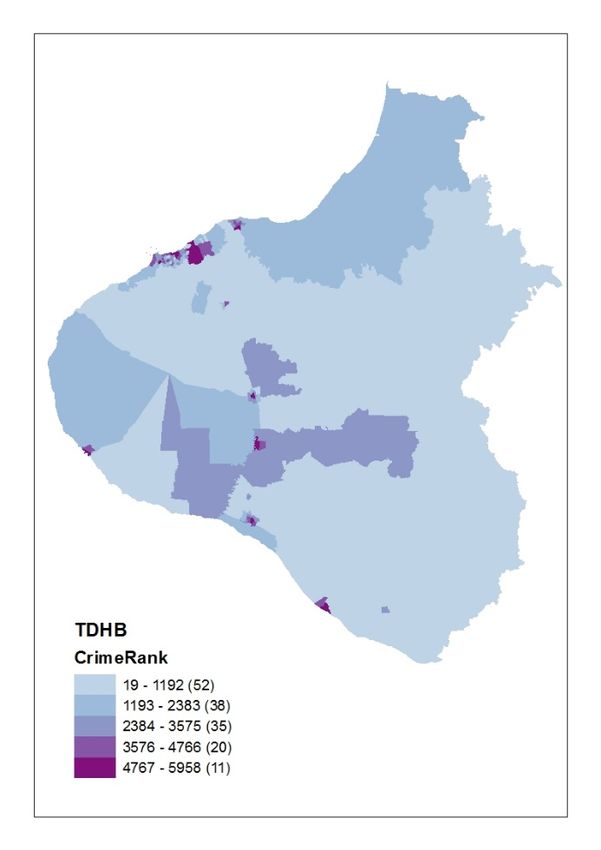
Ethnicity profile of the Taranaki DHB

This section uses the Total Response method to calculate proportions for each
ethnicity from the 2013 census. Individuals who identify as more than one
ethnicity are counted in more than one category. The proportion of Māori living in
data zones within the TDHB ranged from 3.9% to 52.1%. The overall proportion
of Māori in the TDHB was 17.4% higher than the national proportion of 14.9%.
The proportion of Māori per data zone was greatest in a data zone located in Patea
(52.1%), followed by one in Waitara (51.6%).

The proportion of Pacific ethnicity living in data zones within the TDHB ranged
from 0.0% to 6.4%. The overall proportion of Pacific ethnicity in the TDHB was
1.5%, significantly lower than the national proportion of 7.3%. The greatest
proportions of Pacific were located in New Plymouth and in smaller towns such as
Bell Block, Waitara, Normanby, Hawera and Patea. A data zone in Blagdon had
the greatest proportion of Pacific (6.4%).

The percentage of New Zealand European and Other ethnicities (NZEO) in the
TDHB ranged from 56.4% to 99.5%. The overall proportion of NZEO was 91.3%,
which was greater than the national proportion of 87.5%. The lowest proportions
of NZEO (
You can also read