A Comprehensive Analysis and prognostication of COVID-19 (SARS-Cov-2) Outbreak situation in India - OSF
←
→
Page content transcription
If your browser does not render page correctly, please read the page content below
A Comprehensive Analysis and prognostication of COVID-19
           (SARS-Cov-2) Outbreak situation in India
                         Mr. Satyabrata Sahoo1, Ms. Neeti Goutam2
Abstract
Covid-19 is an infectious respiratory disease caused by the severe acute respiratory syndrome
coronavirus 2 (SARS-CoV-2), which was first identified in late December 2019 in China, and
later spread worldwide. The first case of Covid-19 was diagnosed in the last week of January
2020 in India. Subsequently, the number of cases drastically rose. As of May 11, 2021, in
India, 2,33,40,375 positive cases have been reported, out of which 1,93,76,561 recovered and
2,53,634 death were reported as per covid19india report. To avail in designing better
strategies and in making effective decisions, we can use forecasting techniques. These
techniques assess the past situation, thereby enabling better prognostications about the
situation to occur in the future. Based on these time series modeling, this paper tries to study
the prediction of Covid-19 in terms of total substantiated, recovered, and death cases. It also
examines the daily infected, active, recovery, and death cases. The correlation coefficients
and sarimax forecasting model were applied for prediction and statistical measures used for
population variance equality.
Keywords: covid-19, coronavirus, time series, correlation, f-statistical test, ANOVA (Analysis
of Variance), t-test, prediction, sarimax.

Introduction:
Novel Coronavirus disease (COVID-19) has affected millions of lives across the globe. Severe
acute respiratory syndrome coronavirus 2 (SARS-CoV-2) causes the disease.3 The virus
transmits through droplets of people coughing, sneezing, or talking. (Singhal, 2020) People
showing symptoms of the disease and those who are non-symptomatic carrying the viral
burden infect others around. The most visible and common symptoms of the disease are fever,
cough, sore throat, headache, issues with breathing, and fatigue. The condition, in most cases,
shows mild symptoms and is curable at home. However, sometimes the virus attacks the
person and could lead to situations like pneumonia, acute respiratory distress syndrome,
organ failure, and death.
The first identified case was from Wuhan, the capital city of Hubei District in China, in
December 2019 and declared a pandemic by the World Health Organization in March 2020.
The virus then traveled to places and countries and traced its first case in India back on
January 30, 2019, in Kerala. The reported first death case was dated March 12, 2020.4

1 Principal Author, Technical Lead, Sanrachana, SGT University
2 Corresponding author, Strategic Lead and Communications, Sanrachana, SGT University
3 https://www.ncbi.nlm.nih.gov/pmc/articles/PMC7179986/pdf/cureus-0012-00000007386.pdf
4 Timeline of the COVID-19 pandemic in India (January–May 2020) - Wikipedia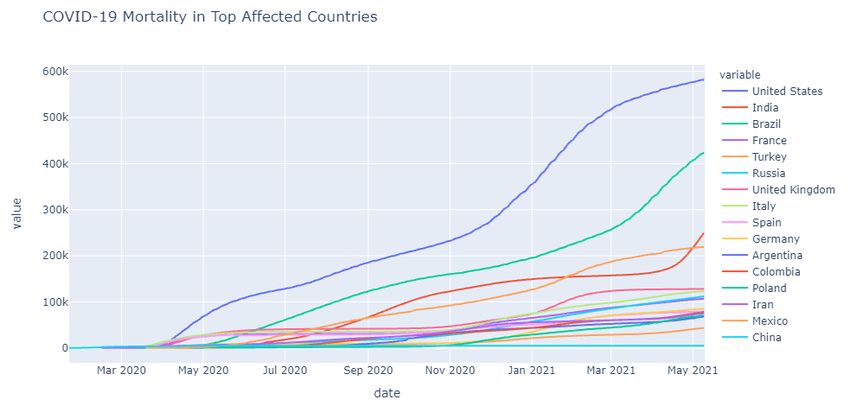
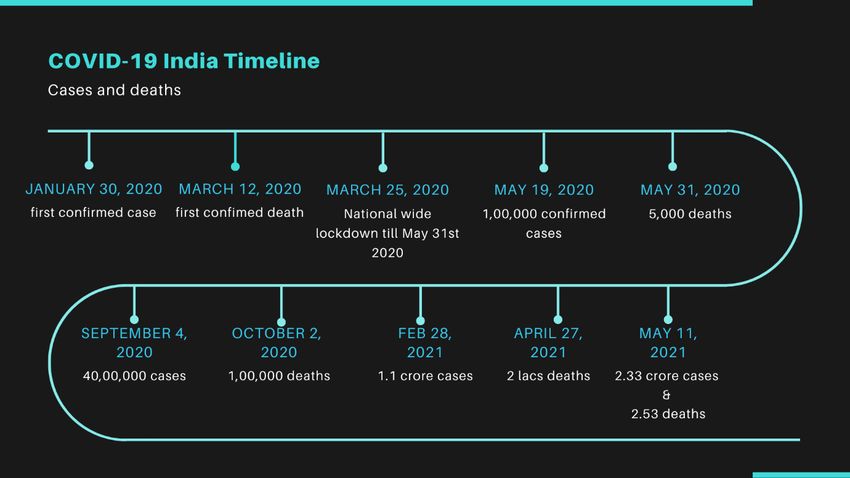
Timeline of Covid cases in India (Major breakpoints)

Till date, there are 161,838,102 cases globally and 3,358,711 deaths, whereas 139,658,123
have recovered. India has over 24, 046, 809 cases and 2, 62,350 deaths so far. India has the
third-highest mortality after the USA and Brazil5 (Worldometer). At present, India is fighting
hard to end the second COVID-19 wave. India has become a war zone as many patients are
gasping for primary health facilities.
Currently, India sees over three lacs cases daily. The facilities began to sore now. There is
difficulty in getting hospital beds, oxygen cylinders, ICU beds, and so on. This also puts a huge
financial burden on people who strive hard to make money for ICU, medications, and
ventilators. With a large population around, it is an enormous task to manage and handle this
pandemic effectively.6
Till date, there are plenty of studies available predicting the future trends of disease using
various scientific models. 78910111213

5 COVID Live Update: 170,610,467 Cases and 3,547,873 Deaths from the Coronavirus - Worldometer
(worldometers.info)
6 Prediction of COVID-19 Trend in India and Its Four Worst-Affected States Using Modified SEIRD and LSTM
Models | SpringerLink
7 https://doi.org/10.1371/journal.pone.0230405
8 https://doi.org/10.1016/j.chaos.2020.110017
9 https://doi.org/10.1016/j.chaos.2020.109850
10 https://doi.org/10.1016/j.jeconom.2020.07.038
11 https://doi.org/10.1016/j.idm.2020.03.002
12 https://doi.org/10.1016/j.chaos.2020.109889
13 https://doi.org/10.3390/app10186448
Data Availability, Model, and Methodology:
Analysis of the COVID-19 dataset for coronavirus disease is performed on the substructure of
reported cases (confirmed, recovered, and death) in India. We have collected data from
covid19india14 and our world in data15. In our study, Covid-19 India APIs were used to extract
data in Jupyter notebook through anaconda navigator and analyzed with Python
programming. Python codes are available in our GitHub account. Our study examined patterns
of total substantiated cases, total active cases, total recovery cases, total death cases. We
have also examined the daily infected cases, daily active cases, daily recuperation cases, and
daily death cases. Withal automatic SARIMA is especially kenned for forecasting time series
data, and forecasting total substantiated and death cases. The confidence level was 95%. A
p-value of 0.05 or less is considered statistically paramount. Data from January 30, 2020, to
May 12, 2021, is mainly used for analysis.
Results
Trend analysis:
From Fig.1, it has been optically discerned that the confirmed and recovered cases pattern is
virtually the same till the terminus of the second week of Mar '21, and then the slope has
drastically transmuted. Also, we can see that the recovery rate improved against the confirmed
cases. When we compared last year's pick period with the current period, the second wave of
this disease drastically increased the new instances with the highest number of mortality. The
below-given figure (Fig.1) is the cumulative number of substantiated cases against the
recuperation rate in India, which describes the Covid situation in India till May 12, 2020.

                      (Fig.1 Total confirmed cases/active/recovered/ death cases in India)

As far as daily new cases are concerned, the increment is now at the pick level. Fig.2 shows
an exponential magnification in daily new patients from the third week of Apr '21 compared
with last year's highest new cases. Withal, the recovery rate ameliorated from the second
week of Apr '21, and it kept on going at a more preponderant pace. On May 6, 2021, 4,14,280
cases were registered, which is the highest number of cases in India's daily Covid meter, and
till date, the mean recovery rate is 69 percent.

14   https://api.covid19india.org/
15   https://github.com/owid/covid-19-data
(Fig.2. Daily new cases/recovered/death cases in India)
After optically canvassing the first death in the second week of Mar '20, the total number of
fatalities commenced to climb up with virtually the same pattern. Fig. 3 is used to represent
the number of COVID-19 deaths for India over 468 days. Deaths are recorded from 30-Jan-
2020 till 12-May-2021. Likewise, Fig.4 shows a homogeneous pattern in new daily death was
optically canvassed most of the time from the first week of April to the last week of June, then
it commenced to go up and perpetuated till November 2020. In contrast, from mid-Apr'21
onwards, the mortality rate increased tremendously compared to the previous year's pick
duration. The highest mortality rate was on 7th May '21, i.e., 4233, with a fatality rate of 1.09
percent. Data shows there is 2, 53,634 individual death as of May 11, 2021.
(Fig.3 Total Deaths in India)(Fig.4 Daily death in India)
This pandemic is traveling ecumenically across different countries. It commenced in China but
has surmounted the globe. We require to analyze country-sagacious replication and effect
because this will avail us in understanding what has ensued in other countries. When we
examine the datasets of the COVID-19 hit countries across the globe, we considered the 15
most-affected countries with the highest number of COVID-19 cases till May 12, 2021.
Additionally, we have also considered China as it was the first country where coronavirus
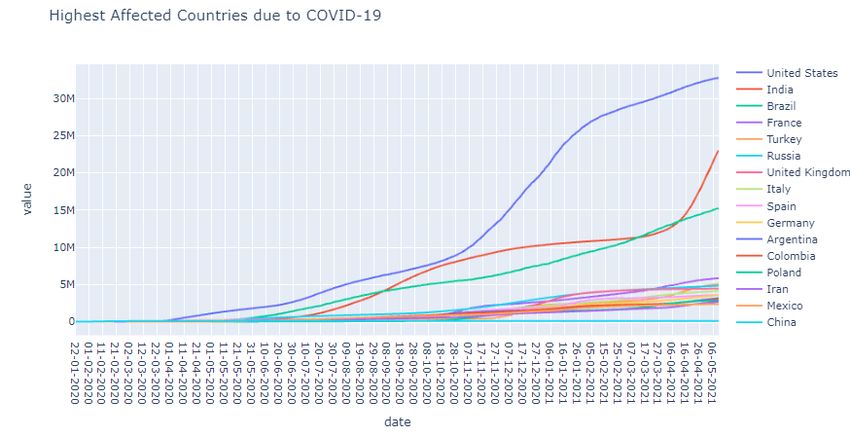
emerged. Fig.5 shows the cumulative number of cases in the highest affected countries. It has
visually perceived that the USA is the most affected country with more than 33 million
cumulative COVID'19 cases. India is now at the second position with more than 23 million
cumulative Covid-19 cases.
(Fig.5 Top 16 highest affected countries cases)
Fig.6 shows the mortality due to coronavirus disease for the top 15 affected countries over
468 days and recorded from 30-Jan-2020 till 12-May-2021. It is clearly in Fig.6 represent that
the USA is the most affected country with more than 6 lakh cumulative corona deaths.Excluding the USA, Brazil is worst affected with more than 4.4 lakh deaths, and then India
with more than 2.5 lakh cumulative COVID deaths.
(Fig.6 Mortality due to Covid-19 in Top Affected Countries)
State-wise Analysis:
Analyzing India COVID-19 infection data and considering the entirety of India to be on the
same page may not provide us the correct picture because of the confirmed, recovered
progression over time and preventive measures taken by state governments and the common
public for each state are different. Table.1 shows that the significant encumbrance of the
COVID-19 cases in the country has been mainly from active cases in the top 10 highly affected
States of the country. The overall recuperation rate in the top 10 highly affected States was
84 per 100 coronaviruses confirmed cases against 81 per 100 confirmed cases in the rest of
the States. In the top 10 highly affected states, the highest recuperation rate was in Delhi
(92.30%), followed by Maharashtra (87.67%), Tamil Nadu (87.60%), West Bengal (86.42),
and then Uttar Pradesh (84.98%). However, in the rest of other states, the highest
recuperation rate was in Andaman and Nicobar Islands (95.69%), followed by Tripura
(90.75%), Arunachal Pradesh (90.32%), Ladakh (89.66%), Telangana (87.59%), and then
Assam (86.06%).
Maharashtra is the top infected State in India where 5.18 million confirmed cases and more
than 77 thousand deaths (Mortality rate 1.49%) due to Covid-19, out of these 4.54 million
people are recovered (Recovery rate 87.67%) with and 3.83 lakh individual (Active rate
10.79%) are still under treatment. Except for Maharashtra, Karnataka is the worst affected
state with the highest number of active cases (5.34 lakhs), with recovery and mortality rates
of 69.83% and 0.99%, respectively. Lakshadweep is the least affected state in India.Recovered Active Death
State/UT Confirmed Numbers Recovery Numbers Active Numbers Mortality
Rate Rate Rate
All India 23340592 19376792 83.02% 3699685 15.85% 254225 1.09%
Top 10 highly
Sl. affected 17510956 14631780 83.56% 2682791 15.32% 193660 1.11%
States
1 Maharashtra 5179929 4541391 87.67% 558996 10.79% 77191 1.49%
2 Karnataka 2013193 1405869 69.83% 587452 29.18% 19852 0.99%
3 Kerala 1967406 1537138 78.13% 423955 21.55% 5959 0.30%
4 Uttar Pradesh 1545212 1313112 84.98% 216057 13.98% 16043 1.04%
5 Tamil Nadu 1438509 1260150 87.60% 162181 11.27% 16178 1.12%
6 Delhi 1348699 1244880 92.30% 83809 6.21% 20010 1.48%
7 Andhra
14.75%
Pradesh 1322934 1118933 84.58% 195102 8899 0.67%
8 West Bengal 1032740 892474 86.42% 127673 12.36% 12593 1.22%
9 Chhattisgarh 873060 740283 84.79% 121836 13.96% 10941 1.25%
10 Rajasthan 789274 577550 73.17% 205730 26.07% 5994 0.76%
Other States 5829636 4745012 81.39% 1016894 17.44% 60565 1.04%
11 Gujarat 703594 563133 80.04% 131832 18.74% 8629 1.23%
12 Madhya
16.11%
Pradesh 691232 573271 82.93% 111366 6595 0.95%
13 Haryana 640252 525345 82.05% 108997 17.02% 5910 0.92%
14 Bihar 612570 507041 82.77% 102099 16.67% 3429 0.56%
15 Odisha 554666 465133 83.86% 87265 15.73% 2268 0.41%
16 Telangana 506988 444049 87.59% 60136 11.86% 2803 0.55%
17 Punjab 459268 371494 80.89% 76856 16.73% 10918 2.38%
18 Assam 304429 261980 86.06% 39264 12.90% 1838 0.60%
19 Jharkhand 296895 238277 80.26% 54533 18.37% 4085 1.38%
20 Uttarakhand 256934 171454 66.73% 76500 29.77% 4014 1.56%
21 Jammu and
22.54%
Kashmir 224898 171350 76.19% 50701 2847 1.27%
22 Himachal
25.74%
Pradesh 140759 102499 72.82% 36232 1989 1.41%
23 Goa 124774 90134 72.24% 32836 26.32% 1804 1.45%
24 Puducherry 75024 59177 78.88% 14829 19.77% 1018 1.36%
25 Chandigarh 51857 42647 82.24% 8625 16.63% 585 1.13%
26 Tripura 38155 34624 90.75% 3098 8.12% 410 1.07%
27 Manipur 36370 30880 84.91% 4981 13.70% 509 1.40%
28 Meghalaya 20579 17040 82.80% 3297 16.02% 242 1.18%
29 Arunachal
9.35%
Pradesh 20575 18583 90.32% 1924 68 0.33%
30 Nagaland 16552 12779 77.21% 3081 18.61% 156 0.94%
31 Ladakh 15564 13955 89.66% 1452 9.33% 157 1.01%
32 Sikkim 10165 7042 69.28% 2741 26.97% 177 1.74%
33 Dadra and
Nagar Haveli
13.94%
and Daman
and Diu 9228 7906 85.67% 1286 4 0.04%
34 Mizoram 7795 6002 77.00% 1771 22.72% 22 0.28%
35 Andaman and
3.10%
Nicobar 6426 6149 95.69% 199 78 1.21%
36 Lakshadweep 4087 3068 75.07% 993 24.30% 10 0.24%
(Table.1 State-wise case in India as of May 12, 2021)
Source: covid19india
(Top 10 highly affected States of India: Maharashtra, Karnataka, Kerala, Uttar Pradesh, Tamil Nadu,
Delhi, Andhra Pradesh, West Bengal, Chhattisgarh, and Rajasthan)District wise Statistics:
(Fig.7 District wise statistics)
The district-level number of COIVD-19 cases as of May 12, 2021, is visualized in the above
graph. We have analyzed only the top twenty districts which are most affected in India. In the
above diagram, Unknown represents the Delhi Covid cases. This pandemic is mainly affected
the urban population and communities with poor households having lower transformation. As
of May '21, the virus spread across all districts, but the gravity of the outbreak is primarily
concentrated in major urban agglomerations such as Delhi, Bengaluru, Pune, and Mumbai.
Data reveals that Mumbai has the highest mortality rate (2.0%) with fewer active cases (5.9%),
followed by Kolkata, Ahmedabad, Delhi, and North 24 Parganas. Thane, Delhi, Mumbai, and
Nashik districts have the highest recovery rate (92.8%, 92.4%, 91.8%, and 91.4%) than
Ahmedabad, Ernakulam, Thrissur, and Bengaluru Urban (74.2%, 73.2%, 71.7%, and 62.2%).
That's why Bengaluru Urban, Thrissur, Ernakulam, Ahmedabad are the top districts where
there are maximum active cases.
Statistical Analysis:
Statistical analysis is being performed to have a more conclusive view from the above
visualizations for India. To determine the variance in the number of confirmed cases and
recovered cases for two parameters, cumulative mean proportion of the population of
confirmed cases and recovered patients for each specified state F- statistical test and ANOVA
for the unequal variance and t-test have been performed. ANOVA uses the F-test to determine
whether the variability between-group means it is more astronomically immense than the
variability of the optical discernments within the groups. If that ratio is adequately sizably
voluminous, we can conclude that not all the expedients are equipollent.Correlation matrix for the dataset:
(Fig.8 Pearson Correlation Matrix)
The Pearson's Correlation coefficient test has analyzed to evaluate the impact or vigor of these
two quantitative variables. The above correlation matrix shows that the variables "Confirmed"
and "Recovered" are highly correlated. We can see other variables are also positively
correlated with each other.
Statistical Description:
For understanding the dataset congruously, a statistical description was performed on the
consummate dataset. The definition of statistical data shown in the below table. The notations
Count, Nmiss, Mean, STD, Min, Max, P1, P5, and P10 are used to denote the number of
counts, missing values, mean of values, the standard deviation of the values, minimum value,
maximum value, first quantile, fifth quantile, and tenth quantile, respectively.F-test and T-test for Daily Confirmed Cases:
From the above result of the F-Test, we conclude that maximum variance has been seen for
both parameters. While comparing with two groups like Maharashtra and Karnataka, Kerala
and Uttar Pradesh, Tamil Nadu and Delhi, Andhra Pradesh and West Bengal, the p-value is
smaller than the significance level, which is 0.05. Thus, we'll reject the null hypothesis that the
variances of two variables are equal. Hence, the conflict between the two groups is not similar.
But in the case of Karnataka and Kerala, Uttar Pradesh and Tamil Nadu, Delhi and Andhra
Pradesh, Chhattisgarh and Rajasthan, the number of variances for daily coronavirus
confirmed chances are equal as the p-value is 0.786, 0.218, 0.201, 0.782, respectively, which
greater than significance value 0.05 thus we fail to reject the null hypothesis.
Further, to determine whether the difference is significant or not, two sample T-Test
(Independent) has been done. From the above tests, where the value of p is more significant
than 0.05, which fails to reject the null hypothesis in that test, and random groups are
statistically equal. Hence, the two groups have statistically equivalent. Still, for the regions like
Maharashtra and Karnataka, Kerala and Uttar Pradesh, Tamil Nadu and Delhi, Andhra
Pradesh and West Bengal, Chhattisgarh and West Bengal, the difference is quite significant
as the p-value is smaller than the significance level for daily confirmed cases.

F-test and T-test for Mortality:

From the below results of the f-test, followed by the T-test for the mortality parameter, we
conclude that the two groups have a statistically equal variance when the p-value is higher
than the significant level, and the two variables have an unequal variance when the p-value
less than 0.05. When comparing Maharashtra state with Karnataka and Delhi, the results of
the f-test shows that the p-value (9.44e-29, 1.45e-33 respectively) is less than the significant
level, and also the result of the t-test gives the exact p-value, so we reject the null hypothesis
hence the two groups have statistically unequal. Kerala, in comparison with Karnataka and
Uttar Pradesh, Andhra Pradesh, in contrast with Delhi and West Bengal, also have a p-value
less than 0.05. But in the case of Tamil Nadu compared with Uttar Pradesh and Delhi, West
Bengal with Chhattisgarh, the result of f-test followed by t-test have equal variance as p-value
is more excellent than significant level.
ANOVA result for COVID'19 cases:

 Here we perform the two-way ANOVA test using the anova_lm () function from the stats
models library. The P-value for states and case variables is less than the significant level,
which is 0.05; thus, it indicates that both factors have a statistically significant effect on
coronavirus cases. And also, the p-value for the interaction effect (0.0) less than 0.5 means
that there is a significant interaction effect between states and circumstances.

Forecasting:

Estimating or Presaging and modeling such an epidemic outbreak's spread, effects, impacts
as well as mortality rate is not only an arduous task but additionally challenging. By applying
the time series model, the stationarity of the time series is required to check. The Augmented
Dickey-Fuller test statistics to check whether the series is stationary or not, a prevalent
statistical method is performed, one of the most widely used statistical measures when
studying the stationary sequence. We proposed a time series model for presaging the number
of confirmed, recuperated, and death cases. Sarimax model is used to soothsay the possible
number of cases in the future. The SARIMAX model for cumulative substantiated and
recuperated cases are illustrated in Fig. 9, in which prediction is up to December 2021. In Fig.
9, the actual data for confirmed and recuperated instances is represented by the supernova
color, Acapulco color, respectively, and the predicted data in red and Prussian blue lines. And
for mortality, actual and predicted data (up to December 2021) is illustrated in Fig. 10. In
Fig.10, essential data for death cases are characterized by the Bright Turquoise color and
predicted in red color line.

                (Fig. 9 Actual and predicted: confirmed and recovered cases in India)
(Fig. 10 Actual and predicted: death cases in India) Discussion & Conclusion The Global pandemic caused by the Novel Coronavirus (COVID-19) has only affected millions' lives and put health systems under immense stress. India has one of the highest cases around the globe. Because of its vast population, there is a persistent need for forecasts and their associated chanciness. Prediction and forecast studies and methods should thus become an essential part of the decision-making process. Decision-makers can therefore sort the issues faced by various sectors of the population and economy. In this sequel, it is consequential to analyze forecasting models for COVID-19 to potentiate allied organizations with more congruous information possible. This study discussed the spread of COVID-19 in different states of India and proposed a model for presaging the number of confirmed, recuperated, and death cases for 218 days starting from May 28, 2021. The result obtained shows that affected chances will decrement from the first week of June 2021 with a higher recuperation rate and lower mortality rate. The mortality rate will be less than 1K in Sep '21 and onwards as per our study. This presage may be subsidiary in resource management, like health accommodations, and timely action may be taken with prior preparation to truncate the loss of human life.
You can also read