A Bioinformatics Study of Immune Infiltration-Associated Genes in Sciatica
←
→
Page content transcription
If your browser does not render page correctly, please read the page content below
Hindawi
Computational Intelligence and Neuroscience
Volume 2022, Article ID 7372431, 8 pages
https://doi.org/10.1155/2022/7372431

Research Article
A Bioinformatics Study of Immune Infiltration-Associated
Genes in Sciatica

          Tao Ma,1 Guanhua Li,1 Yuheng Ma,1 Zhaoqi Ren,2 Houyun Xie,1 Chaoyong Sun,1 Lei Tian,1
          Hao Zhang,1 and Wei Wang 1
          1
              Department of Anesthesiology, PLA Rocket Force Characteristic Medical Center, Beijing, China
          2
              Department of Infusion, PLA Rocket Force Characteristic Medical Center, Beijing, China

          Correspondence should be addressed to Wei Wang; wangwei_pla@cumt.edu.cn

          Received 8 February 2022; Accepted 9 March 2022; Published 24 March 2022

          Academic Editor: Akshi Kumar

          Copyright © 2022 Tao Ma et al. This is an open access article distributed under the Creative Commons Attribution License, which
          permits unrestricted use, distribution, and reproduction in any medium, provided the original work is properly cited.
          Sciatica has been widely studied, but the association of sciatica with immune infiltration has not been studied. We aimed to screen
          key genes and to further investigate the impact of immune infiltration in patients with sciatica. The bioinformatics analyzes were
          performed based on the GSE150408 dataset. Subsequently, we used CIBERSORT to study the immune infiltration in the disease
          group. Results showed that 13 genes were with differentially expressions in the sciatica group compared to healthy participants,
          including 8 up-regulated and 5 down-regulated genes. Through the LASSO model and SVM-RFE analysis, a total of 6 genes have
          intersections, namely SLED1, CHRNB3, BEGAIN, SPTBN2, HRASLS2, and OSR2. The ROC curve area also confirmed the
          reliability of this method. CIBERPORT analysis showed that T cell gamma delta infiltration decreased and neutrophil infiltration
          increased in the disease group. Then the association of these six key genes with immune infiltration was further verified. We found
          six overlapping genes and found that they were closely associated with the total immune infiltration in the sciatic nerve disease
          group. These findings may provide new ideas for the diagnosis and therapeutics of patients with sciatica.

1. Introduction                                                         Then further evaluate the correlation between immune cell
                                                                        infiltration and the central gene in sciatica so as to provide
Sciatica is commonly caused by lumbar disc herniation                   new research ideas for the treatment and early detection of
involving peripheral neuropathy [1, 2]. According to sta-               sciatica.
tistics, the incidence of sciatica in one’s life is as high as 40%.
The common treatment methods for sciatica include non-                  2. Materials and Methods
surgical conservative treatment and nonsurgical treatment.
90% of acute sciatica can be effectively relieved by non-                2.1. Screening of Differentially Expressed Genes (DEGs).
surgical treatment [3].                                                 We downloaded GSE150408 in the GEO database (https://
     Proteomic analysis has identified proteins related to               www.ncbi.nlm.nih.gov/geo/). The platform of the
sciatica or intervertebral disc degeneration, which may be              GSE150408 mRNA microarray is GPL21185, which was used
involved in the pathophysiological process of sciatica [4]. It          for the following analyzes.
is generally believed that mechanical compression combined
with immunity and inflammation can lead to sciatica during
lumbar disc herniation. Many cytokines related to immunity              2.2. Identification of Feature Gene. The feature genes were
and inflammation are activated in lumbar disc herniation                 screened by two machine learning algorithms, least ab-
[5, 6].                                                                 solute convergence and selection operator (LASSO) and
     In this study, we used two machine learning methods to             support vector machine-recursive feature elimination
explore and identify the key genes of patients with sciatica            (SVM-RFE) and validated in the validation dataset. Ma-
and preliminarily analyzed the immune cell infiltration.                 chine learning is a new type of algorithm analysis tool. This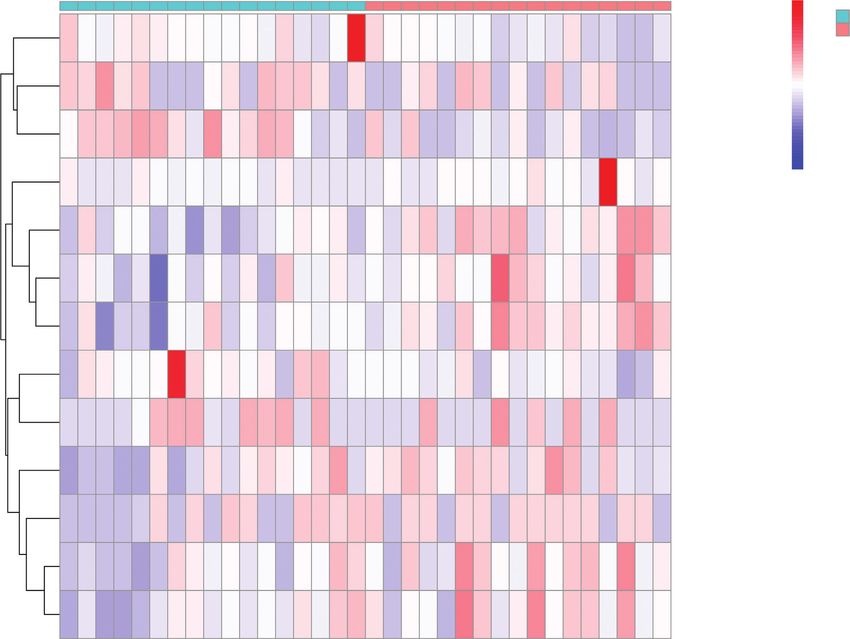
2 Computational Intelligence and Neuroscience
study used the method of machine learning to identify associated with T cells gamma delta (R � 0.72, P � 3.8e − 06)
features for algorithm analysis. Two machine learning al- and negatively associated with neutrophils (R � −0.39,
gorithms, LASSO and SVM-RFE, were applied for marker P � 0.022), T cells CD4 naive (R � −0.45, P � 0.0081)
screening. LASSO is a regression algorithm regularized (Figure 5(b)).
through “glmnet” package in R. SVM-RFE is a supervised SPTBN2 had a positive correlation with CD4 memory-
learning technique that can rank features based on re- activated T cells (R � 0.38, P � 0.025) and a negative cor-
cursion. We adopted the “e1071” package to complete the relation with neutrophils (R � −0.37, P � 0.033), T cells
SVM algorithm. (CD4 naı̈ve) (R � −0.41, P � 0.017) (Figure 5(d)). CHRNB3
had a positive correlation with gamma delta-Tcells (R � 0.72,
P � 3.8e − 06) and a negative correlation with neutrophils
2.3. Analyzes of Immune Infiltration. The CIBERSORT
(R � −0.39, P � 0.022). No correlation was found between
deconvolution algorithm was adopted for the estimation of
BEGAIN, HRASLS2, OSR2, and immune cell infiltration
different immune cell proportions. Totally, we obtained
(Figures 5(c)–5(f )).
twenty-two types of immune cells. CIBERSORT filters data
with p < 0.05. We then calculated each immune cell type’s
percentage and displayed it as a bar graph. The “pheatmap” 4. Discussion
package was adopted for the construction of the heat map of
So far, there is no specific diagnostic method for sciatica.
the twenty-two types of immune cells. Comparisons of levels
Combining medical history with a physical examination is
of the twenty-two types of immune cells were done using a
the most common diagnostic method [7]. As a common
package.
clinical syndrome, sciatica is caused by two causes: one is
internal and the other is external factors [8, 9]. When sciatica
2.4. Statistical Analysis. Analyzes of the association of im- occurs, it often causes pain in the legs, back and below the
mune cells with feature genes were performed using knee, usually accompanied by tingling in the legs, numbness
Spearman’s rank via R software. We used the “ggplot2” or muscle weakness [10, 11].
package for the visualization of the plot. P < 0.05 indicated This study showed that 13 genes were differentially
statistically significant. expressed in patients with sciatica. Through two methods,
we identified six key genes, which are SLED1, CHRNB3,
3. Result BEGAIN, SPTBN2, HRASLS2, and OSR2. We determined
the association of these differentially expressed genes and
3.1. Diagnostic Feature Biomarkers Screening. After remov- immune infiltration in patients with sciatica. CIBERPORT
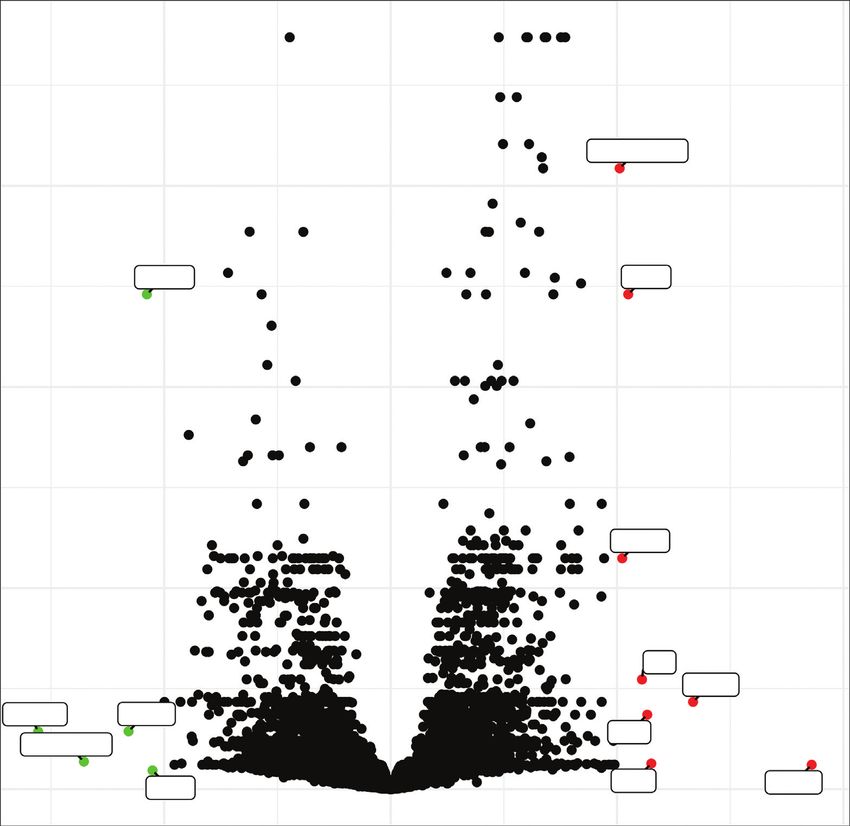
ing the batch effects, thirteen DEGs were screened out: 8 analysis showed that T cell gamma delta infiltration de-
significantly up-regulated and 5 significantly down-regu- creased and neutrophil infiltration increased in the sciatica
lated (Figures 1(a) and 1(b)). Using the LASSO regression group. Up to now, there has still been a lack of research on
algorithm, we found 8 potential Figure 1(b) variables for the brain-enriched guanylate kinase-associated protein. Studies
disease group (Figure 2(a)). A total of thirteen features were have shown that brain-enriched guanylate kinase-associated
determined in Figure 2(b). SLED1, CHRNB3, BEGAIN, protein participates in chronic pain. We demonstrated in the
SPTBN2, HRASLS, and OSR2 were finally selected in SNI model that mechanical abnormal pain, an abnormal
Figure 2(c). Then, ROC was performed for the evaluation of pain condition caused by harmless stimuli, was significantly
the value of the prediction of the 6 characteristic genes. The attenuated in BEGAIN deficient mice [12, 13]. Another key
AUCs for all 6 genes were greater than 0.8 (Figure 3(a)). It gene found is SPTBN2. It is the research on SPTBN2. At
showed that the characteristic biomarkers have a high di- present, it is mainly used in research on congenital cerebellar
agnostic ability, Figure 3(f ). ataxia and various cancers. In the study of cancer, miR-424-
5p was found to be able to accelerate the development of
endometrial cancer through regulating SPTBN2 and then
3.2. Analyzes of Immune Infiltration. Immune infiltration in
the cldn4/PI3K/Akt axis [14–16]. Combined with bio-
control and sciatica groups was explored with the twenty-
informatics and cell experiments, SPTBN2 may become a
two subpopulations of immune cells. The percentage of the
novel target of lung adenocarcinoma. SPTBN2, highly
twenty-two types of immune cells was visually displayed in
expressed in LUAD, might indicate poor prognosis. Cell
Figure 4(a). CIBERPORT analysis showed that T cells
experiments confirmed that SPTBN2 could promote the
gamma delta infiltration decreased and the degree of neu-
proliferative, migrative, and invasive abilities of LUAD cells
trophils infiltration increased in the sciatica group
[17].
(Figure 4(b)).
The researchers found that glia was significantly acti-
vated in the brains of patients who experienced chronic pain,
3.3. Relationship of Central Genes with Immune Cells. As indicating that immune cells can spread and maintain
shown in Figure 5(a), SLED1 was related to macrophages M0 disease states, including neuropathic pain, through com-
(R � 0.38, P � 0.025), B cells memory (R � 0.42, P � 0.014), munication with neurons rather than being regarded as
neutrophils (R � 0.56, P � 0.00073) positively and correlated bystanders [18]. During nerve injury, neuronal activity will
with monocytes (R � −0.43, P � 0.011), T cells gamma delta be activated, resulting in the recruitment of monocytes/
(R � −0.53, P � 0.0016) negatively. CHRNB3 was positively macrophages (peripheral) to the injured site. At the same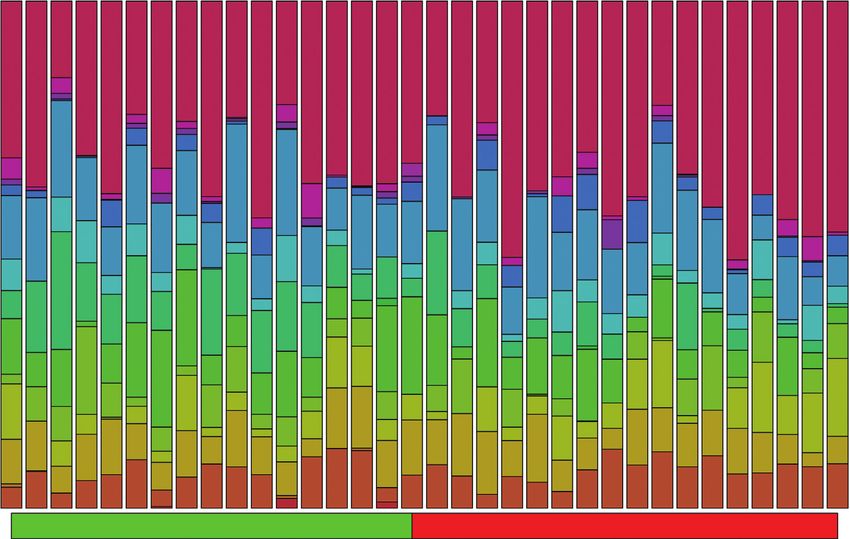
Computational Intelligence and Neuroscience                                                           3

                                                                                           Type
                                                                     Type
                                                                                              Con
                                                                                      4
                                                                                              Treat
                                                                     SPTBN2
                                                                                      2

                                                                     LOC101060810     0

                                                                                      -2
                                                                     CHRNB3
                                                                                      -4

                                                                     OSR2

                                                                     XLOC_I2_012836

                                                                     FCGR1A

                                                                     SLED1

                                                                     HRASLS2

                                                                     BTNL3

                                                                     BEGAIN

                                                                     RPS4Y2

                                                                     BPI

                                                                     AZU1

                                                      (a)
                                              Figure 1: Continued.
4                                                                                                                                                       Computational Intelligence and Neuroscience

                                                                                                                                                            XLOC_12_012836

                                                        0.6

                                                                                       CHRNB3                                                                     SLED1
                                    –log10(adj.P Val)

                                                        0.4

                                                                                                                                                                FCGR1A

                                                        0.2

                                                                                                                                                                       BPI

                                                                                                                                                                               BEGAIN

                                                               HRASLS2               SPTBN2
                                                                                                                                                               AZU1
                                                                    LOC101060810

                                                                                                                                                                OSR2                     RPS4Y2
                                                        0.0                              BTNL3

                                                                                         –1                    0                                              1                                   2
                                                                                                                          logFC

                                                              Sig
                                                                Down
                                                                Not
                                                                Up

                                                                                                              (b)

Figure 1: Differential analyzes based on the datasets: (a) heat map of DEGs (adjust P < 0.05, |logFC| >1) and (b) the volcano map of DEGs.

                                   12 12 12 12 12 12 12 9 10 9 9 7 5 3

                              10
                                                                                                                                             0.48
                                                                                                                   RMSE (Cross–Validation)

                              8                                                                                                              0.46
          Binomial Deviance

                                                                                                                                             0.44
                              6
                                                                                                                                             0.42
                              4
                                                                                                                                             0.40

                              2                                                                                                              0.38
                                                                                                                                                                                                      N=13
                                                                                                                                             0.36
                                    –10                             –8              –6           –4    –2                                           2   4              6           8        10        12
                                                                                   Log(λ)                                                                                    Variables
                                                                               (a)                                                                                     (b)
                                                                                                      Figure 2: Continued.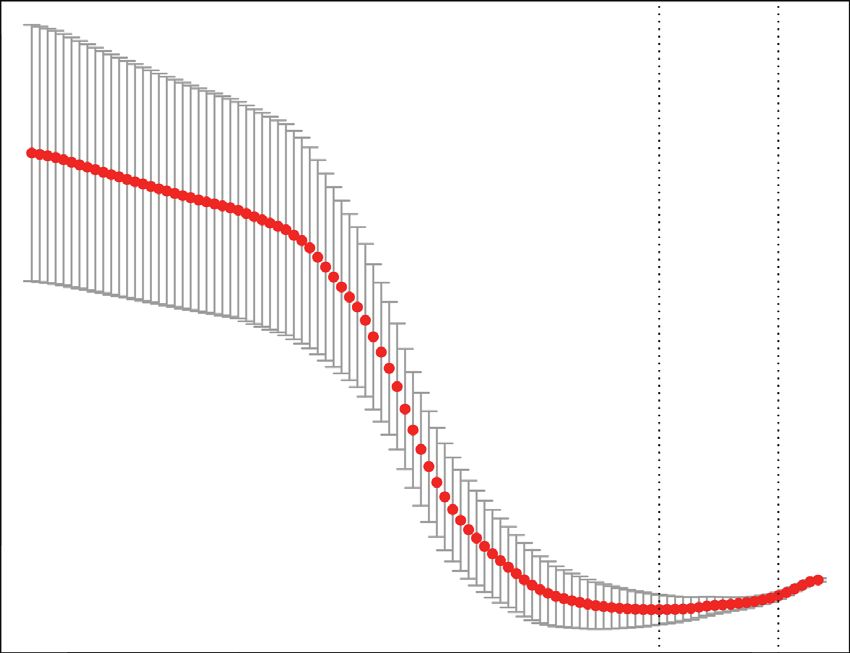
Computational Intelligence and Neuroscience                                                                                                                                                                   5

                                                                        LASSO                                                      SVM – RFE

                                                                                                         6                           5

                                                                                                         (c)

Figure 2: Establishment of prognostic genes: (a) selection of tuning feature in LASSO models, (b) selection of biomarkers using SVM-RFE
and (c) the overlapped feature genes between 2 methods.

                                           BEGAIN                                                          CHRNB3                                                                HRASLS2
                       1.0                                                             1.0                                                                   1.0

                       0.8                                                             0.8                                                                   0.8

                       0.6                                                             0.6                                                                   0.6
         Sensitivity

                                                                         Sensitivity

                                                                                                                                               Sensitivity
                                              AUC: 0.727                                                        AUC: 0.834                                                          AUC: 0.727
                       0.4                 95% CI: 0.540–0.886                         0.4                   95% CI: 0.689–0.948                             0.4                 95% CI: 0.547–0.886

                       0.2                                                             0.2                                                                   0.2

                       0.0                                                             0.0                                                                   0.0

                             0.0   0.2   0.4          0.6   0.8   1.0                        0.0   0.2   0.4           0.6    0.8        1.0                       0.0   0.2   0.4        0.6     0.8   1.0
                                         1 – Specificity                                                 1 – Specificity                                                       1 – Specificity

                                         (a)                                                             (b)                                                                   (c)
                                               OSR2                                                            SLED1                                                              SPTBN2
                       1.0                                                             1.0                                                                   1.0

                       0.8                                                             0.8                                                                   0.8

                       0.6                                                             0.6                                                                   0.6
         Sensitivity

                                                                         Sensitivity

                                                                                                                                               Sensitivity

                                              AUC: 0.675                                                        AUC: 0.837                                                          AUC: 0.734
                       0.4                 95% CI: 0.481–0.851                         0.4                   95% CI: 0.682–0.955                             0.4                 95% CI: 0.564–0.893

                       0.2                                                             0.2                                                                   0.2

                       0.0                                                             0.0                                                                   0.0

                             0.0   0.2   0.4          0.6   0.8   1.0                        0.0   0.2   0.4           0.6    0.8        1.0                       0.0   0.2   0.4        0.6     0.8   1.0
                                         1 – Specificity                                                 1 – Specificity                                                       1 – Specificity

                                         (d)                                                             (e)                                                                   (f )

Figure 3: Diagnosis efficiency ROC curve of the feature genes: (a)–(f ) ROC curve of SLED1 (a), CHRNB3 (b), BEGAIN (c), SPTBN2 (d),
HRASLS2 (e), and OSR2 (f ).

time, microglia will release inflammatory-related mediators                                                      [20, 21]. Immune system activation has been shown to
after activation, resulting in neuronal sensitivity [19].                                                       promote and increase neuropathic pain [22].
    The signal molecules of the immune system are cyto-                                                             Immune cells play an important role in different path-
kines. An increase of proinflammatory cytokines is related to                                                    ophysiological processes in the state of neuropathic pain. It
the existence of pain after nerve injury, while antiin-                                                         brings the pain field to different directions and provides
flammatory cytokines are related to the down regulation of                                                       opportunities for new methods for the treatment of chronic
the immune system and the relief of neuropathic pain                                                            pain.
6 Computational Intelligence and Neuroscience
100%
80%
60%
Relative Percent
40%
20%
0%
Con Treat
B Cells naive T cells regulatory (Tregs) Macrophages M2
B Cells memory T cells gamma delta Dendritic cells resting
Plasma cells NK cells resting Dendritic cells activated
T cells CD8 NK cells activated Mast cells resting
T cells CD4 naive Monocytes Mast cells activated
T cells CD4 memory resting Macrophages M0 Eosinophils
T cells CD4 memory activated Macrophages M1 Neutrophils
T cells follicular helper
(a)
p=0.020
0.5
0.4
Fraction
0.3
pComputational Intelligence and Neuroscience 7
Neutrophils8 Computational Intelligence and Neuroscience
Conflicts of Interest onset case and Brief review of the literature,” The Cerebellum,
vol. 17, no. 3, pp. 276–285, 2018.
The authors declare that they have no conflicts of interest. [16] P. Wang, T. Liu, Z. Zhao, Z. Wang, S. Liu, and X. Yang,
“SPTBN2 regulated by miR-424-5p promotes endometrial
cancer progression via CLDN4/PI3K/AKT axis,” Cell Death
Authors’ Contributions Discovery, vol. 7, no. 1, p. 382, 2021.
[17] C. Wu, B. Dong, L. Huang et al., “SPTBN2, a new biomarker
Tao Ma and Guanhua Li contributed equally to this work. of lung adenocarcinoma,” Frontiers in Oncology, vol. 11,
Article ID 754290, 2021.
[18] M. Malcangio, “Role of the immune system in neuropathic
References pain,” Scandinavian Journal of Pain, vol. 20, no. 1, pp. 33–37,
[1] M. A. Stafford, P. Peng, and D. A. Hill, “Sciatica: a review of 2019.
history, epidemiology, pathogenesis, and the role of epidural [19] H. Tozaki-Saitoh and M. Tsuda, “Microglia-neuron interac-
steroid injection in management,” British Journal of Anaes- tions in the models of neuropathic pain,” Biochemical
thesia, vol. 99, no. 4, pp. 461–473, 2007. Pharmacology, vol. 169, Article ID 113614, 2019.
[2] J.-P. Valat, S. Genevay, M. Marty, S. Rozenberg, and B. Koes, [20] M. A. Thacker, A. K. Clark, F. Marchand, and S. B. McMahon,
“Sciatica,” Best Practice & Research Clinical Rheumatology, “Pathophysiology of peripheral neuropathic pain: immune
vol. 24, no. 2, pp. 241–252, 2010. cells and molecules,” Anesthesia & Analgesia, vol. 105, no. 3,
[3] C. S. Bailey, P. Rasoulinejad, D. Taylor et al., “Surgery versus pp. 838–847, 2007.
conservative care for persistent sciatica lasting 4 to 12 [21] A. K. Clark, E. A. Old, and M. Malcangio, “Neuropathic pain
months,” New England Journal of Medicine, vol. 382, no. 12, and cytokines: current perspectives,” Journal of Pain Research,
pp. 1093–1102, 2020. vol. 6, pp. 803–814, 2013.
[4] W. Ren and R. Wu, “Effect of general and sub-arachnoid [22] K. Ren and R. Dubner, “Interactions between the immune and
anesthesia on the incidence of postoperative delirium and nervous systems in pain,” Nature Medicine, vol. 16, no. 11,
cognitive impairments in elderly Chinese patients,” Tropical pp. 1267–1276, 2010.
Journal of Pharmaceutical Research, vol. 20, no. 2,
pp. 433–439, 2021.
[5] R. F. McCarron, M. W. Wimpee, P. G. Hudkins, and
G. S. Laros, “The inflammatory effect of nucleus pulposus,”
Spine, vol. 12, no. 8, pp. 760–764, 1987.
[6] K. Hemati, M. Y. Karimi, A. Hosseinzadeh et al., “Induction of
analgesia using atorvastatin in experimental diabetic neu-
ropathy through NMDA receptor and inflammatory cytokine
inhibition,” Iran Red Crescent Me, vol. 23, no. 1, p. e454, 2021.
[7] A. H. Ropper and R. D. Zafonte, “Sciatica,” New England
Journal of Medicine, vol. 372, no. 13, pp. 1240–1248, 2015.
[8] B. W. Koes, M. W. van Tulder, and W. C. Peul, “Diagnosis and
treatment of sciatica,” BMJ, vol. 334, no. 7607, pp. 1313–1317,
2007.
[9] I. A. Bernstein, Q. Malik, S. Carville, and S. Ward, “Low back
pain and sciatica: summary of NICE guidance,” BMJ, vol. 356,
p. i6748, 2017.
[10] E. R. Stirling, M. S. Patel, and P. J. Sell, “Sciatica,” British
Journal of Hospital Medicine, vol. 77, no. 11, pp. C180–C183,
2016.
[11] Z. Sun, Z. H. Liu, Y. f. Chen et al., “Molecular immunotherapy
might shed a light on the treatment strategies for disc de-
generation and herniation,” Medical Hypotheses, vol. 81, no. 3,
pp. 477–480, 2013.
[12] T. Katano, M. Fukuda, H. Furue et al., “Involvement of brain-
enriched guanylate kinase-associated protein (BEGAIN) in
chronic pain after peripheral nerve injury,” eNeuro, vol. 3,
no. 5, 2016.
[13] M. Deguchi, Y. Hata, M. Takeuchi et al., “BEGAIN (brain-
enriched guanylate kinase-associated protein), a novel neu-
ronal PSD-95/SAP90-binding protein,” Journal of Biological
Chemistry, vol. 273, no. 41, pp. 26269–26272, 1998.
[14] F. Nicita, M. Nardella, E. Bellacchio et al., “Heterozygous
missense variants of SPTBN2 are a frequent cause of con-
genital cerebellar ataxia,” Clinical Genetics, vol. 96, no. 2,
pp. 169–175, 2019.
[15] M. A. Al-Muhaizea, F. AlMutairi, R. Almass et al., “A novel
homozygous mutation in SPTBN2 leads to spinocerebellar
ataxia in a consanguineous family: report of a new infantile-You can also read